CWS Market Review – June 2, 2026
(This is the free version of CWS Market Review. If you like what you see, then please sign up for the premium newsletter for $20 per month or $200 for the whole year. If you sign up today, you can see our two reports, “Your Handy Guide to Stock Orders” and “How Not to Get Screwed on Your Mortgage.”)
Last October, 60 Minutes interviewed Andrew Ross Sorkin about his book on the 1929 stock market crash. As I expected, the segment came with dire warnings concerning parallels between the market of 1929 and the market of today.
Please. This market is barely recognizable to the market of 1929. It’s a lazy argument that describes any rally as a potential new Great Depression.
This is what I wrote at the time:
I hate that this even needs to be said, but the current market isn’t anything like the market of 1929. Just as a reminder, the stock market fell 89% from top to bottom. That’s what we’re talking about when we compared us to 1929.
Many more Americans are invested in the stock market than was the case 100 years ago. There’s no gold standard today. No fixed commissions. There’s a global economy. We have deposit insurance. During the Great Depression, the unemployment rate reached 25%. Today it’s just over 4%.
Bear markets happen. We even had a brief one earlier this year. That’s part of investing. That’s quite a different thing from 1929.
During the Great Depression, 9,000 U.S. banks went insolvent. Last year, there were two.
As it turns out, people love to be scared. Despite these serious-sounding warnings, the market stubbornly refuses to crash. In fact, it’s only marched higher. The Nasdaq Composite is up more than 22% since 60 Minutes aired its segment. For good measure, CBS ran it again this past Sunday.
Of course, for the super bears, any contrasting evidence is further proof of the bubble. The stock market is indeed volatile, and that’s exactly why we’re focused on the long term.
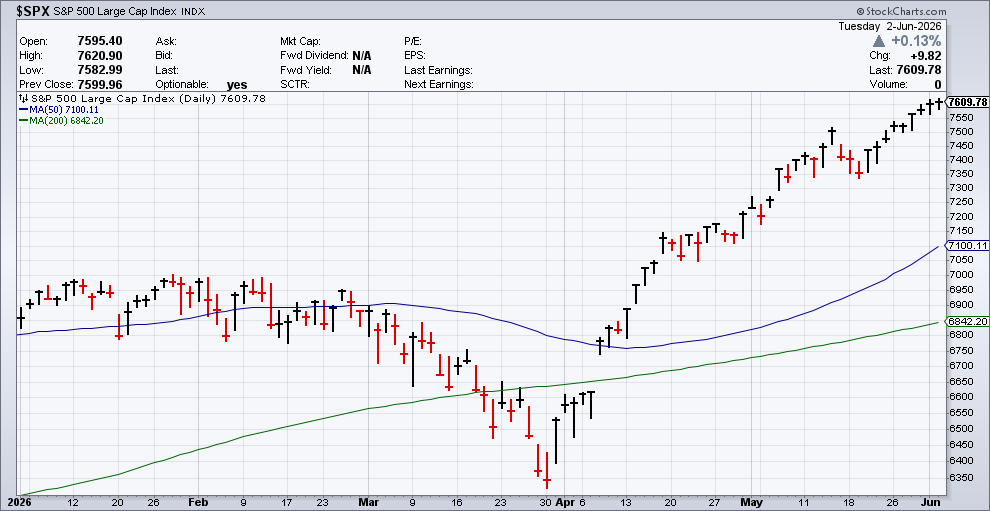
Today, the S&P 500 closed higher for the ninth day in a row. We also had a nine-day winning streak last year. The index has closed higher for the last nine weeks in a row. This week may very well be #10.
For the last few months, utility stocks have badly lagged the overall market. Watching the relative performance of utilities is often a good “tell” for the market’s overall mood.
The S&P 500 is in black and the Utilities are in blue.
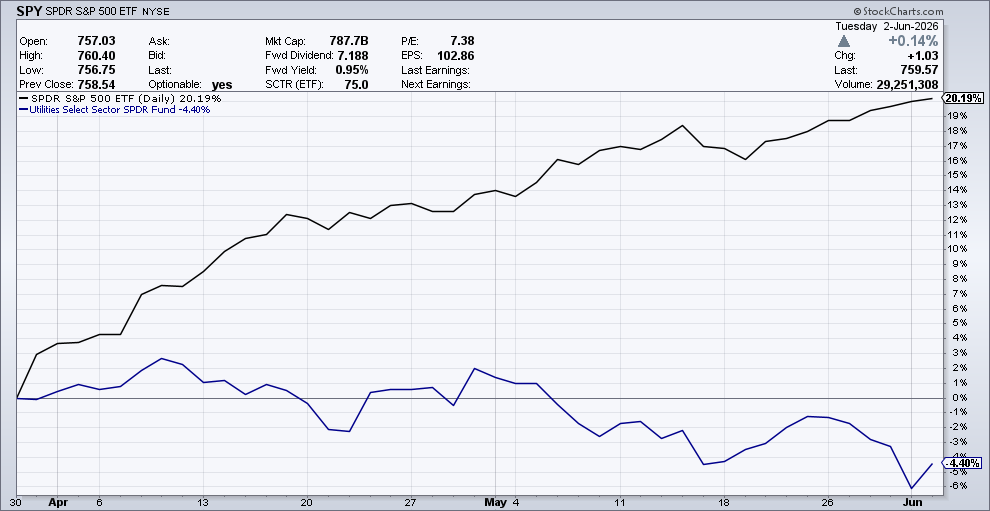
For now, the market apparently has little need for safe and dependable stocks like utilities. Instead, Wall Street is madly embracing higher risk stocks. For example, Micron (MU) hit a new high today. Over the last year, the stock is up 10-fold.
Investors should certainly be more cautious in this market. The economy continues to grow but there are growing signs of concern, not of a depression, but of slower growth. Let’s take a closer look at the low-hire, low-fire economy.
The Low-Hire, Low-Fire Economy
This morning, the Bureau of Labor Statistics (BLS) released its jobs openings report, better known as the JOLTS report.
The BLS said that available employment hit 7.62 million in April. That’s a jump of 731,000. Economists had been expecting 6.8 million. It’s also the highest since May 2024.
The jump in openings put the available jobs above the total of unemployed workers. The rate of openings compared with the size of the labor force rose 0.4 percentage point to 4.6%.
By industry, nearly all of the openings came from the professional and business services category, which added 668,000 positions, a possible indicator of the impact from artificial intelligence on labor demand. Health care and social assistance, the greatest engine of job creation, added 89,000. Financial activities saw a decline of 134,000. Most other categories reported little change.
One concerning stat is that the report said that hiring dropped. During April, employers hired 5.12 million new workers. That’s a drop of 419,000. Layoffs fell a bit as did quits. The quits number is often a good proxy for worker confidence. You’re more likely to leave your current job if you think you can easily get another one.
The low-hire, low-fire economy is still in play. The labor market has been like this for more than a year. This Friday, we’ll get the May jobs report. I’m expecting much of the same.
In fact, the jobless rate has barely moved. Over the last 10 months, the monthly unemployment rate has been 4.3% five times, 4.4% three times, and once it was 4.5%; plus, we never got the October report thanks to the government shutdown.
The conflict with Iran has yet to hurt the overall economy. On Monday, we got the ISM Manufacturing Index for May, and it was a good report. Last month, the index rose 1.3 points to 54.0. That’s a four-year high.
Any number over 50 means that the manufacturing sector of the economy is expanding. Manufacturing now makes up about 10% of the economy. The improved numbers probably reflect companies’ front-loading of orders as they try to navigate supply line issues during the war with Iran.
By the way, don’t listen to people who say that the United States doesn’t make anything anymore. In reality, the U.S. is a manufacturing powerhouse. The difference is that a lot fewer workers do it. Manufacturing has grown for the last five months in a row.
Some of the numbers may not tell the complete story since there’s been a massive increase in AI investments. If we exclude that, then the economy may be weaker than it appears.
For Friday, Wall Street expects to see 80,000 net new jobs and for the unemployment rate to hold at 4.3%.
Q1 GDP Growth was Revised Lower
On Friday, the Bureau of Economic Analysis lowered the government’s estimate for Q1 GDP growth. The initial report said that the economy grew by 2% during the first three months of this year. Now that’s been taken down to 1.6%.
These are in annualized inflation-adjusted numbers. The economy grew at a 0.5% rate for Q4. We’ll get our first look at Q2 GDP in late July. The reports are revised twice after the initial report, although the GDP numbers are frequently revised again many years after the initial report.
The Q1 numbers were helped by large tax refunds. Also, business spending in equipment rose by 17%. Profits from current production fell to $40 billion. That’s down from nearly $250 billion for Q4. Gross Domestic Income rose by 1.5% in Q4.
Along with the GDP report, we got the report on personal income and spending. This includes the PCE price index which is important because it’s the Federal Reserve’s preferred measure of inflation.
In April, PCE prices rose by 1.5%. Over the last year, PCE prices are up by 3.8%. That’s the highest in three years. If we exclude food and energy, then PCE inflation was up 0.2% last month, and 3.3% for the last 12 months.
Before I go, I wanted to mention the very good earnings report we had from Science Applications International Corporation (SAIC) yesterday. I’ll have more details in our paid issue later this week.
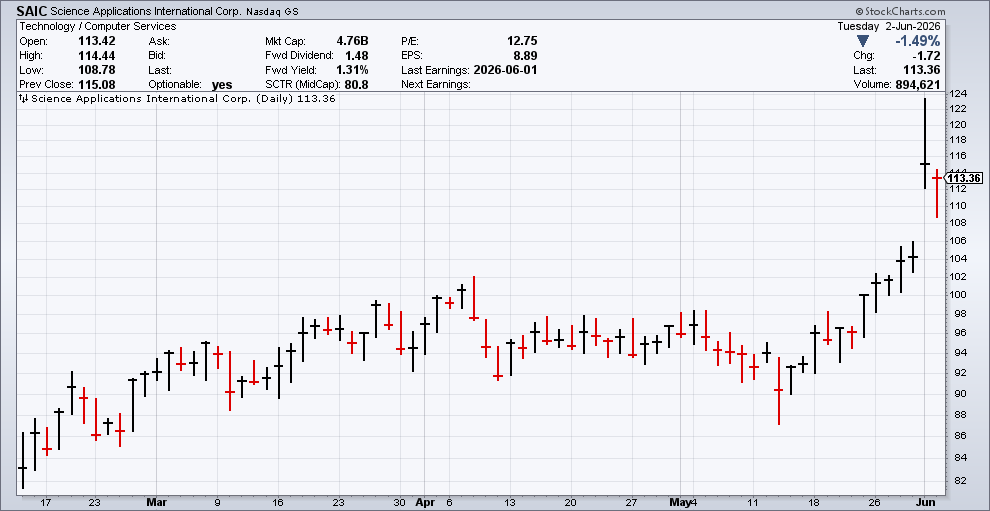
SAIC said it made $3.23 per share for its fiscal Q1 compared with Wall Street’s forecast for $2.28 per share. That’s a beat of 41%.
CEO Jim Reagan said, “These results reflect our focus on execution and our commitment to our financial targets. We are raising our guidance to reflect this strong start, while continuing to invest for the future.”
SAIC raised its full-year earnings range from $9.50 to $9.70 per share, to $9.90 to $10.10 per share.
At one point in yesterday’s trading, the stock was up more than 18%. It later settled lower for a gain of 10%. We have a 13% gain this year with SAIC. I’ll have full details in our paid newsletter, which you can sign up for here.
That’s all for now. I’ll have more for you in the next issue of CWS Market Review.
– Eddy
Posted by Eddy Elfenbein on June 2nd, 2026 at 6:10 pm
The information in this blog post represents my own opinions and does not contain a recommendation for any particular security or investment. I or my affiliates may hold positions or other interests in securities mentioned in the Blog, please see my Disclaimer page for my full disclaimer.
-
Archives
- June 2026
- May 2026
- April 2026
- March 2026
- February 2026
- January 2026
- December 2025
- November 2025
- October 2025
- September 2025
- August 2025
- July 2025
- June 2025
- May 2025
- April 2025
- March 2025
- February 2025
- January 2025
- December 2024
- November 2024
- October 2024
- September 2024
- August 2024
- July 2024
- June 2024
- May 2024
- April 2024
- March 2024
- February 2024
- January 2024
- December 2023
- November 2023
- October 2023
- September 2023
- August 2023
- July 2023
- June 2023
- May 2023
- April 2023
- March 2023
- February 2023
- January 2023
- December 2022
- November 2022
- October 2022
- September 2022
- August 2022
- July 2022
- June 2022
- May 2022
- April 2022
- March 2022
- February 2022
- January 2022
- December 2021
- November 2021
- October 2021
- September 2021
- August 2021
- July 2021
- June 2021
- May 2021
- April 2021
- March 2021
- February 2021
- January 2021
- December 2020
- November 2020
- October 2020
- September 2020
- August 2020
- July 2020
- June 2020
- May 2020
- April 2020
- March 2020
- February 2020
- January 2020
- December 2019
- November 2019
- October 2019
- September 2019
- August 2019
- July 2019
- June 2019
- May 2019
- April 2019
- March 2019
- February 2019
- January 2019
- December 2018
- November 2018
- October 2018
- September 2018
- August 2018
- July 2018
- June 2018
- May 2018
- April 2018
- March 2018
- February 2018
- January 2018
- December 2017
- November 2017
- October 2017
- September 2017
- August 2017
- July 2017
- June 2017
- May 2017
- April 2017
- March 2017
- February 2017
- January 2017
- December 2016
- November 2016
- October 2016
- September 2016
- August 2016
- July 2016
- June 2016
- May 2016
- April 2016
- March 2016
- February 2016
- January 2016
- December 2015
- November 2015
- October 2015
- September 2015
- August 2015
- July 2015
- June 2015
- May 2015
- April 2015
- March 2015
- February 2015
- January 2015
- December 2014
- November 2014
- October 2014
- September 2014
- August 2014
- July 2014
- June 2014
- May 2014
- April 2014
- March 2014
- February 2014
- January 2014
- December 2013
- November 2013
- October 2013
- September 2013
- August 2013
- July 2013
- June 2013
- May 2013
- April 2013
- March 2013
- February 2013
- January 2013
- December 2012
- November 2012
- October 2012
- September 2012
- August 2012
- July 2012
- June 2012
- May 2012
- April 2012
- March 2012
- February 2012
- January 2012
- December 2011
- November 2011
- October 2011
- September 2011
- August 2011
- July 2011
- June 2011
- May 2011
- April 2011
- March 2011
- February 2011
- January 2011
- December 2010
- November 2010
- October 2010
- September 2010
- August 2010
- July 2010
- June 2010
- May 2010
- April 2010
- March 2010
- February 2010
- January 2010
- December 2009
- November 2009
- October 2009
- September 2009
- August 2009
- July 2009
- June 2009
- May 2009
- April 2009
- March 2009
- February 2009
- January 2009
- December 2008
- November 2008
- October 2008
- September 2008
- August 2008
- July 2008
- June 2008
- May 2008
- April 2008
- March 2008
- February 2008
- January 2008
- December 2007
- November 2007
- October 2007
- September 2007
- August 2007
- July 2007
- June 2007
- May 2007
- April 2007
- March 2007
- February 2007
- January 2007
- December 2006
- November 2006
- October 2006
- September 2006
- August 2006
- July 2006
- June 2006
- May 2006
- April 2006
- March 2006
- February 2006
- January 2006
- December 2005
- November 2005
- October 2005
- September 2005
- August 2005
- July 2005
 Eddy Elfenbein is a Washington, DC-based speaker, portfolio manager and editor of the blog Crossing Wall Street. His