Author Archive
-
The TIPs Yield Curve
Eddy Elfenbein, October 26th, 2010 at 3:27 pmHere’s a look at the yield curve of inflation-protected Treasury securities, otherwise known as TIPs:

This chart is, in my opinion, pretty stunning. Investors greatly prefer the liquidity and reliability of U.S. government debt to just about everything else.
The media made a lot of noise yesterday about the TIPs auction due in April 2015 going off at a negative yield. (It’s the 12th data point from the left, right near the -0.5% line.) But the TIP due in July 2017 is going for slightly less than 0.0%.
Update: Paul has found the source!
-
This Is a Great Earnings Season
Eddy Elfenbein, October 26th, 2010 at 2:19 pmThe numbers have been coming in fast this week and we can now say that this is a great earnings season. Dirk Van Dijk of Zacks has more details. Here’s a sample:
* Great start with a median surprise of 5.88%, and a 7.58 surprise ratio. Total of 128 positive surprises and just 17 disappointments. Positive year-over-year growth for 130, falling EPS for 28 firms, a 3.81 ratio. Total net income reported up 33.8%.
* Sales Surprise ratio at 1.78, median surprise 0.64%, 54.7% of all firms do better than expected on top line. Revenue growth healthy at 5.78%. Excluding financials, revenue growth at 10.2%.
* Total net income (for those yet to report) for the S&P 500 in the third quarter of 2010 is expected to rise 13.8% over third quarter of 2009 levels — a slowdown from the 37.4% growth those same firms had in the second quarter. A rebound to 15.8% growth expected in the fourth quarter.
* Net margins (among the 341 yet to report) expected to rise to 7.52% from 6.92% a year ago. Excluding financials, net margins expected to rise from 6.88% last year to 7.11% in the third quarter.
* Full-year total earnings for the S&P 500 expected to jump 42.5% in 2010, 11.0% further in 2011. Total revenues for the S&P 500 expected to rise 4.93% in 2010, 6.05% in 2011. Excluding financials, revenue growth of 8.38% expected in 2010, 7.01% in 2011.
* Net Margins marching higher, from 5.90% in 2008 to 6.42% in 2009 to 8.78% expected for 2010, 9.12% expected for 2011 — a major source of earnings growth. Net margins ex-financials 7.81% in 2008, 7.13% in 2009, 8.14% expected for 2010, 8.50% in 2011.
* Revisions ratio for full S&P 500 at 1.85 for 2010, at 1.21 for 2011, an improvement from last week. Ratio of firms with rising to falling mean estimates at 1.70 for 2010, 1.11 for 2011. Total revisions activity picking up, for 2010, all from estimate increases.
* S&P 500 earned $57.57 in 2009: $81.96 in 2010 and $90.78 in 2011 expected.
* Top Down estimates: $79.90 for 2010, $92.27 for 2011.
-
Owning Citigroup
Eddy Elfenbein, October 26th, 2010 at 12:46 pmThanks to its low price, the daily trading volume in Citigroup (C) is astounding. On heavy days, the volume exceeds 1 billion shares. That’s around 43,000 shares every second.
For this year, the daily average is about 600 million shares. The total for the year is 120 billion shares. Since the company has 29.05 billion shares outstanding, the average Citigroup shareholder owns the stock for about 10 weeks.
-
IBM’s $10 Billion Share Buyback
Eddy Elfenbein, October 26th, 2010 at 10:57 amShares of IBM (IBM) are getting a nice boost today on news that the company has approved a $10 billion share buyback plan.
OK, that’s nice and it makes for great press releases.
But here’s my contention. How would shareholders vote if they had the choice between $8 per share now or a $10 billion buyback plan that will theoretically lift the stock by $8 per share?
Even after considering the tax consequences, I have no doubt that shareholders would vote for the cash. And those who want more shares could use their new cash to buy more IBM stock. It’s that simple. But IBM is giving no choice to its shareholders and it’s using corporate cash to buy a stock that’s doubled in less than two years.
(We should also remember that IBM merely approved a buyback plan. It may take a long time to be implemented.)
-
Ford Keeps on Cruising
Eddy Elfenbein, October 26th, 2010 at 10:37 am
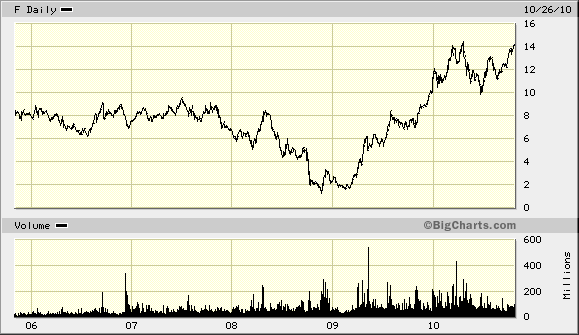
Earlier this year, I got a big head start on the media when I called Ford (F) my “Stock of the Decade.” Perhaps I had been rushing things but you never know with these media phenomena.
The good news is that Ford keeps proving me right. Today the car maker reported earnings of 38 cents per share, 10 cents better than the Street’s estimate. This was Ford’s sixth-straight quarter of making a profit. The company is also working to pay down their massive (MASSIVE) debt.
Bolstering the financial performance, Ford also announced it paid down its revolving credit line by $2 billion and will make a cash payment of $3.6 billion on Friday to cover the last of its health-care trust obligations. The Voluntary Employee Beneficiary Association covers 195,000 retirees and their spouses. It was established by the U.S. auto makers and the United Auto Workers as of way of helping the auto maker reduce rising health care costs. The UAW has control of the trust.
These actions alone will reduce the company’s overall automotive debt to $22.8 billion from $27.3 billion at the end of June.
Ford also plans to lower its debt even further by offering two convertible debt securities in the fourth quarter. Holders will be offered a cash premium as an inducement for them to convert the debt into shares of Ford common stock.
The company has said that it expects all of its business units will be profitable in Q4 and next year. Not getting a bailout seems to help Ford among consumers. In North America, Ford’s pre-tax profit jumped from $314 million to $1.6 billion. Sales of F-Series pickups have picked up by 25% over the past year.
-
Morning News: October 26, 2010
Eddy Elfenbein, October 26th, 2010 at 7:37 am15 Inviolable Rules for Dealing with Wall Street
Stock Futures Dip; Home Price, Confidence Data Eyed
Bernanke Asset Purchases Risk Unleashing 1970s Inflation Genie
5 Reasons Why Warren Buffet Is Wrong About Hedge Funds
DuPont Net Falls 10%, Raises View
Shrinking Bank Revenue Signals Dawn of `Worst’ Growth Decade
China Telecom Giant Makes Push for U.S. Market
Bank of England Chief: Basel III Incomplete Answer
-
My Earnings Forecast for Nicholas Financial
Eddy Elfenbein, October 25th, 2010 at 4:27 pmThis Thursday, little Nicholas Financial (NICK) will report earnings for their fiscal second quarter. It’s hard to say what Wall Street’s consensus is because, well…no one follows NICK. As far as I know, I’m the only one.
Here’s my take: The good news is that the story is still the same. NICK’s business has improved dramatically since the credit crisis. The company continues to make money and the quality of their portfolio is a lot better.
Here’s my estimate for this earnings report:
Receivables: $245 million
Gross yield: 25%
Interest Expense: 2.5%
Provision for Credit Losses: 2.8%
Pre-Tax Yield: 10%
EPS: 30 cents or moreThose are just guesses but I doubt I’m too far off. Even if I’m off by a bit, the fundamental story is the same. The portfolio is growing slowly. The quality of the portfolio is improving. The yield spread between what they borrow and what they lend is gigantic.
Last quarter they made 29 cents per share and the quarter before that, they made 28 cents per share. For this calendar year (which is not the same as NICK’s fiscal year), they should make about $1.20 per share, maybe $1.25 per share.
Even at the current higher stock price of $10, NICK is still very inexpensive. If they earn $1.20 per share for 2010, that’s basically like a 12% bond. By comparison, 30-year Treasuries are going for less than 4%.
Of course, I don’t know how the market will react to earnings. It seems like the stock woke up all of a sudden about one month ago. Who knows why? As I said before, the story is still the same. Fundamentally, nothing has changed. My view is that NICK is a great buy under $12 per share.
-
Apple Vs. Google
Eddy Elfenbein, October 25th, 2010 at 11:27 amRuss Roberts spoke to Thomas Hazlett of George Mason in a podcast about the rivalry between Apple and Google:
It is commonly argued that Apple with its closed platform and tight control from the top via Steve Jobs is making the same mistake it made in its earlier competition with Microsoft. Google on the other hand is lauded for its open platform and leveraging of a large number of suppliers for its Android phone, for example. Hazlett, drawing on his recent article in the Financial Times, argues that these arguments fail to recognize the different competitive advantages of Apple and Google and the implications of those advantages for the companies’ respective strategies. The conversation concludes with a discussion of the move to application-based web browsing such as Facebook, Twitter, and the implications for Google.
The podcast is 68 minutes long.
-
Buy List +11.5 YTD
Eddy Elfenbein, October 25th, 2010 at 10:21 amOur Buy List is having a very nice day so far but I should remind you (and me) to never judge a market day until the closing bell.
All 20 stocks are trading higher. AFLAC (AFL) broke $56 per share and is very close to a new 52-week high. Intel (INTC) is inches away from $20 per share. Both Nicholas Financial (NICK) and Reynolds American (RAI) are at fresh 52-week highs.
The Buy List is currently up 1.20% for the day and 11.50% for the year.
-
Fiserv and AFLAC’s Earnings Due this Week
Eddy Elfenbein, October 25th, 2010 at 8:53 amThis will be another busy week for earnings. I’m especially looking forward to Friday’s GDP report. This will be our first look out how well the economy did during the third quarter.
So far, the much-talked-about Double Dip has been in the second derivative. The rate of growth has slowed down, but we haven’t actually seen negative growth. I don’t expect much from this report, perhaps around 2%.
On our Buy List, Fiserv (FISV) and AFLAC (AFL) both will report on Tuesday. Fiserv rarely deviates much from Wall Street’s earnings forecast.
The Street currently expects $1.00 per share for Q3 earnings. In July, they gave full-year guidance of $3.96 to $4.07 per share. I wouldn’t be surprised if they lifted the low end of that forecast.
AFLAC said it expects Q3 earnings of $1.35 to $1.38 per share. Of course, since much of AFLAC’s business is in Japan, much of the fine-tuning depends on the yen/dollar rate. For all of 2010, AFLAC sees earnings of $5.34 per share.
-
Archives
- July 2026
- June 2026
- May 2026
- April 2026
- March 2026
- February 2026
- January 2026
- December 2025
- November 2025
- October 2025
- September 2025
- August 2025
- July 2025
- June 2025
- May 2025
- April 2025
- March 2025
- February 2025
- January 2025
- December 2024
- November 2024
- October 2024
- September 2024
- August 2024
- July 2024
- June 2024
- May 2024
- April 2024
- March 2024
- February 2024
- January 2024
- December 2023
- November 2023
- October 2023
- September 2023
- August 2023
- July 2023
- June 2023
- May 2023
- April 2023
- March 2023
- February 2023
- January 2023
- December 2022
- November 2022
- October 2022
- September 2022
- August 2022
- July 2022
- June 2022
- May 2022
- April 2022
- March 2022
- February 2022
- January 2022
- December 2021
- November 2021
- October 2021
- September 2021
- August 2021
- July 2021
- June 2021
- May 2021
- April 2021
- March 2021
- February 2021
- January 2021
- December 2020
- November 2020
- October 2020
- September 2020
- August 2020
- July 2020
- June 2020
- May 2020
- April 2020
- March 2020
- February 2020
- January 2020
- December 2019
- November 2019
- October 2019
- September 2019
- August 2019
- July 2019
- June 2019
- May 2019
- April 2019
- March 2019
- February 2019
- January 2019
- December 2018
- November 2018
- October 2018
- September 2018
- August 2018
- July 2018
- June 2018
- May 2018
- April 2018
- March 2018
- February 2018
- January 2018
- December 2017
- November 2017
- October 2017
- September 2017
- August 2017
- July 2017
- June 2017
- May 2017
- April 2017
- March 2017
- February 2017
- January 2017
- December 2016
- November 2016
- October 2016
- September 2016
- August 2016
- July 2016
- June 2016
- May 2016
- April 2016
- March 2016
- February 2016
- January 2016
- December 2015
- November 2015
- October 2015
- September 2015
- August 2015
- July 2015
- June 2015
- May 2015
- April 2015
- March 2015
- February 2015
- January 2015
- December 2014
- November 2014
- October 2014
- September 2014
- August 2014
- July 2014
- June 2014
- May 2014
- April 2014
- March 2014
- February 2014
- January 2014
- December 2013
- November 2013
- October 2013
- September 2013
- August 2013
- July 2013
- June 2013
- May 2013
- April 2013
- March 2013
- February 2013
- January 2013
- December 2012
- November 2012
- October 2012
- September 2012
- August 2012
- July 2012
- June 2012
- May 2012
- April 2012
- March 2012
- February 2012
- January 2012
- December 2011
- November 2011
- October 2011
- September 2011
- August 2011
- July 2011
- June 2011
- May 2011
- April 2011
- March 2011
- February 2011
- January 2011
- December 2010
- November 2010
- October 2010
- September 2010
- August 2010
- July 2010
- June 2010
- May 2010
- April 2010
- March 2010
- February 2010
- January 2010
- December 2009
- November 2009
- October 2009
- September 2009
- August 2009
- July 2009
- June 2009
- May 2009
- April 2009
- March 2009
- February 2009
- January 2009
- December 2008
- November 2008
- October 2008
- September 2008
- August 2008
- July 2008
- June 2008
- May 2008
- April 2008
- March 2008
- February 2008
- January 2008
- December 2007
- November 2007
- October 2007
- September 2007
- August 2007
- July 2007
- June 2007
- May 2007
- April 2007
- March 2007
- February 2007
- January 2007
- December 2006
- November 2006
- October 2006
- September 2006
- August 2006
- July 2006
- June 2006
- May 2006
- April 2006
- March 2006
- February 2006
- January 2006
- December 2005
- November 2005
- October 2005
- September 2005
- August 2005
- July 2005
 Eddy Elfenbein is a Washington, DC-based speaker, portfolio manager and editor of the blog Crossing Wall Street. His