Author Archive
-
The Market Doesn’t Always Do What We Want
Eddy Elfenbein, January 19th, 2010 at 10:20 amBefore Intel’s earnings came out I wrote, “The Street is looking for 30 cents a share which is definitely too low. I expect earnings around, 35 cents a share, but the mystery is how Wall Street will react.”
I was more right than I realized. Intel obliterated the Street by earning 40 cents a share, yet the stock fell 3.2% the next day. So if exceeding expectations disappoints, you have to wonder what the true expectations were.
There was some talk that Intel’s gross margins are now so high (67%) that there’s no way they can increase them anymore. Sure, I buy that. The company has said it’s targeting margins 61% for this year. But it in way means that Intel will be less profitable.
The point for us is how unpredictable investing can be. Even when all the fundamentals go our way, we can still lose. If the market wants to go down, it will go down. The media and analysts will attempt to seize on any bit of info to explain the sell-off. Yet, the accurate explanation for why it happened is simply unknowable.
Unfortunately, that doesn’t make for a good analyst report or news item. In the long run, stock prices do make sense. But in the short term, it might as well be astrology. -
Intel Delivers Huge Quarter
Eddy Elfenbein, January 14th, 2010 at 4:17 pmYesterday I said that I expected Intel (INTC) to report earnings of 35 cents a share which was well above Wall Street’s consensus of 30 cents a share. Even my optimistic estimate was too low. The company just reported earnings of 40 cents a share.
Here’s a look at their future guidance:Q1 2010
* Revenue: $9.7 billion, plus or minus $400 million.
* Gross margin percentage: 61 percent, plus or minus 2 percentage points.
* R&D plus MG&A spending: Approximately $3 billion.
* Amortization of acquisition-related intangibles and costs associated with the Wind River acquisition: Approximately $20 million.
* Impact of equity investments and interest and other: Gain of approximately $20 million.
* Depreciation: Approximately $1.1 billion.
Full-Year 2010
* Gross margin percentage: 61 percent, plus or minus 3 percentage points.
* Spending (R&D plus MG&A): $11.8 billion, plus or minus $100 million.
* R&D spending: Approximately $6.2 billion.
* Tax rate: Approximately 30 percent.
* Depreciation: Approximately $4.4 billion, plus or minus $100 million.
* Capital spending: Expected to be $4.8 billion, plus or minus $100 million.That Q1 revenue target of $9.7 billion +/-$400 million is well above Wall Street’s consensus of $9.35 billion.
-
Barney Vs. Erin
Eddy Elfenbein, January 14th, 2010 at 4:02 pmHere’s an entertaining interview of Barney Frank by Erin Burnett:
-
The Dow Jones Hit Its Bull Market High 10 Years Ago Today
Eddy Elfenbein, January 14th, 2010 at 6:48 amOn Friday, January 14, 2000, the Dow closed at 11,722.98 — a level it wouldn’t break for over six years. That peak capped an amazing 17-1/2 year run. In the ensuring 10 years, we’ve lost about 1,000 points or roughly 8.9%. Inflation, or at least the CPI, has increased by about 28% which makes the inflation-adjusted close from ten years more like 15,000. Ten years ago, gold was going for about $280 an ounce (around $360 inflation adjusted).
In the letters section of the January 2000 issue of the Atlantic, J. Douglas Van Sant of Stockton, California criticized the article in the September 1999 issue on Dow 36,000 by James Glassman and Kevin Hassett.
Mr. Van Sant wrote:I would be willing to bet Glassman and Hassett that even ten years from now, when earnings and dividends should have nearly doubled, the Dow Jones Industrial Average will still be closer to its current level of 11,000 than to their hyperbolic projection of 36,000.
Good call. The Dow closed yesterday at 10,680.77.
Glassman and Hassett replied:To J. Douglas Van Sant we say, if the Dow is closer to 10,000 than to 36,000 ten years from now, we will each give $1,000 to the charity of your choice.
I recommend Haiti.

-
Once Again, Economists Are Split
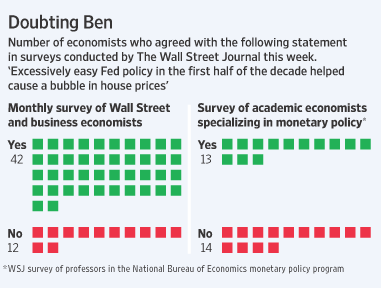
Eddy Elfenbein, January 13th, 2010 at 12:21 pmI sometimes think that a group of academic economists couldn’t agree on the color of the sky. The WSJ surveyed economists over Ben Bernanke’s view that low rates didn’t contribute to the housing bubble (to be fair, Bernanke merely said it wasn’t the primary cause of the bubble).
Here’s what the WSJ found:
-
This Just In
Eddy Elfenbein, January 13th, 2010 at 12:16 pm“Whatever we did, it didn’t work out well.” Lloyd Blankfein CEO of Goldman Sachs
-
The Buy List So Far
Eddy Elfenbein, January 13th, 2010 at 11:20 amI probably shouldn’t mention this so early and jinx myself, but the Buy List has gotten off to a very nice start this year. Through 11am this morning, the Buy List is up 3.77% for the year which is almost exactly double the S&P 500, which is up 1.88%. So far, so good.
The Buy List will get a big test tomorrow when Intel (INTC) reports its earnings. The Street is looking for 30 cents a share which is definitely too low. I expect earnings around, 35 cents a share, but the mystery is how Wall Street will react. -
The Credit Market Slowly Wakes Up
Eddy Elfenbein, January 13th, 2010 at 10:57 amThe credit markets recently passed an important milestone when the spread between the BAA corporate bond index and the 10-year Treasury bond fell below 250 basis points. This spread is a good measure of the willingness of lenders to take on default risk.
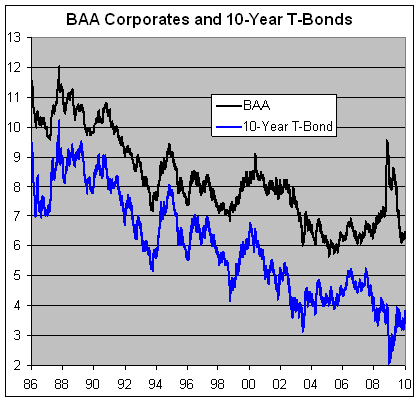
In the best of times, the spread is around 160 basis points, and that’s where it was during the summer of 2007. By early 2008, the spread doubled and then nearly doubled again during the frantic days of September 2008. The spread reaches its peak of 616 basis points on December 4, 2008.
Since then, the spread has plunged. It dropped below 300 over the summer, and it just recently fell below 250 for the first time in over two years.
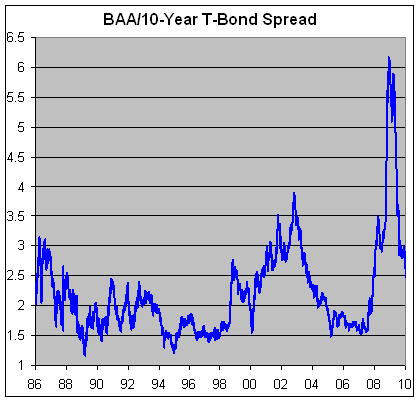
So what does that means for equities? It’s hard to put an exact effect on each instance, but historically stocks have shown a clear preference for a tighter BAA-10YTB spread.
I ran the numbers and found that since 1986, when the spread is 250 basis points or more, the stock market has lost an average of -4.50% annually. When the spread is 249 basis points or less, the market has gained an average of 12.13% annually.
There’s probably a feedback loop at work. Because the yield spread narrows, it’s good for companies because it lowers their borrowing costs. The lower borrowing costs make them more profitably and in turn, less likely to default. -
Chinese Revaluation Needs to Come Soon
Eddy Elfenbein, January 13th, 2010 at 9:56 amThe WSJ writes on the most important economic issue right now, the absurd peg of the Chinese yuan:
Surging Chinese exports and an expansion in the U.S. trade deficit have shown this week that a revaluation in the Chinese yuan is the most urgent item of unfinished business for the global economy.
Most economists believe a modest appreciation in the yuan is inevitable sometime this year. The latest move by the People’s Bank of China — an incremental increase in its T-bill rate last week and a hike in reserve ratios and one-year T-bills on Tuesday — could even pave the way for this.
But time is running out. Anger is growing around the world over what many see as a grossly unfair advantage for China’s exporters. “The monetary disorder has became unacceptable,” said French President Nicolas Sarkozy last week.
China’s leaders have said nothing of plans to raise the value of their currency — even though this would help diffuse inflationary pressures — and have at times sounded hostile to the suggestion.This could get ugly. China currently holds $2 trillion in reserves.
-
One Bank Had a Very Good Year
Eddy Elfenbein, January 12th, 2010 at 10:26 amThe Federal Reserve earned $45 billion last year:
Much of the higher earnings came about because of the Fed’s aggressive program of buying bonds, aiming to push interest rates down across the economy and thus stimulate growth. By the end of 2009, the Fed owned $1.8 trillion in U.S. government debt and mortgage-related securities, up from $497 billion a year earlier. The interest income on those investments was a major source of Fed profits — though that income comes with risks, as the central bank could lose money if it later sells those securities to reduce the money supply.
The Fed also made money on its emergency loans to banks and other firms and on special programs to prop up lending, such as one that supports credit cards, auto loans, and other consumer and business lending. Those programs impose interest and fees on participants, with the aim of ensuring that the Fed does not lose money.
And while the central bank in its most recent financial report had recorded a $3.8 billion decline in the value of loans it made in bailing out the investment bank Bear Stearns and the insurer American International Group, the Fed also logged $4.7 billion in interest payments from those loans. Further losses — or gains — on the two bailouts are possible as time goes by. The Fed also charges fees for operating the plumbing of the financial system, such as clearing checks and electronic payments between banks.Despite what conspiracy theorists think, any profit over the Fed’s 6% dividend goes right to the U.S. Treasury.
-
Archives
- July 2026
- June 2026
- May 2026
- April 2026
- March 2026
- February 2026
- January 2026
- December 2025
- November 2025
- October 2025
- September 2025
- August 2025
- July 2025
- June 2025
- May 2025
- April 2025
- March 2025
- February 2025
- January 2025
- December 2024
- November 2024
- October 2024
- September 2024
- August 2024
- July 2024
- June 2024
- May 2024
- April 2024
- March 2024
- February 2024
- January 2024
- December 2023
- November 2023
- October 2023
- September 2023
- August 2023
- July 2023
- June 2023
- May 2023
- April 2023
- March 2023
- February 2023
- January 2023
- December 2022
- November 2022
- October 2022
- September 2022
- August 2022
- July 2022
- June 2022
- May 2022
- April 2022
- March 2022
- February 2022
- January 2022
- December 2021
- November 2021
- October 2021
- September 2021
- August 2021
- July 2021
- June 2021
- May 2021
- April 2021
- March 2021
- February 2021
- January 2021
- December 2020
- November 2020
- October 2020
- September 2020
- August 2020
- July 2020
- June 2020
- May 2020
- April 2020
- March 2020
- February 2020
- January 2020
- December 2019
- November 2019
- October 2019
- September 2019
- August 2019
- July 2019
- June 2019
- May 2019
- April 2019
- March 2019
- February 2019
- January 2019
- December 2018
- November 2018
- October 2018
- September 2018
- August 2018
- July 2018
- June 2018
- May 2018
- April 2018
- March 2018
- February 2018
- January 2018
- December 2017
- November 2017
- October 2017
- September 2017
- August 2017
- July 2017
- June 2017
- May 2017
- April 2017
- March 2017
- February 2017
- January 2017
- December 2016
- November 2016
- October 2016
- September 2016
- August 2016
- July 2016
- June 2016
- May 2016
- April 2016
- March 2016
- February 2016
- January 2016
- December 2015
- November 2015
- October 2015
- September 2015
- August 2015
- July 2015
- June 2015
- May 2015
- April 2015
- March 2015
- February 2015
- January 2015
- December 2014
- November 2014
- October 2014
- September 2014
- August 2014
- July 2014
- June 2014
- May 2014
- April 2014
- March 2014
- February 2014
- January 2014
- December 2013
- November 2013
- October 2013
- September 2013
- August 2013
- July 2013
- June 2013
- May 2013
- April 2013
- March 2013
- February 2013
- January 2013
- December 2012
- November 2012
- October 2012
- September 2012
- August 2012
- July 2012
- June 2012
- May 2012
- April 2012
- March 2012
- February 2012
- January 2012
- December 2011
- November 2011
- October 2011
- September 2011
- August 2011
- July 2011
- June 2011
- May 2011
- April 2011
- March 2011
- February 2011
- January 2011
- December 2010
- November 2010
- October 2010
- September 2010
- August 2010
- July 2010
- June 2010
- May 2010
- April 2010
- March 2010
- February 2010
- January 2010
- December 2009
- November 2009
- October 2009
- September 2009
- August 2009
- July 2009
- June 2009
- May 2009
- April 2009
- March 2009
- February 2009
- January 2009
- December 2008
- November 2008
- October 2008
- September 2008
- August 2008
- July 2008
- June 2008
- May 2008
- April 2008
- March 2008
- February 2008
- January 2008
- December 2007
- November 2007
- October 2007
- September 2007
- August 2007
- July 2007
- June 2007
- May 2007
- April 2007
- March 2007
- February 2007
- January 2007
- December 2006
- November 2006
- October 2006
- September 2006
- August 2006
- July 2006
- June 2006
- May 2006
- April 2006
- March 2006
- February 2006
- January 2006
- December 2005
- November 2005
- October 2005
- September 2005
- August 2005
- July 2005
 Eddy Elfenbein is a Washington, DC-based speaker, portfolio manager and editor of the blog Crossing Wall Street. His