Author Archive
-
CWS Market Review – October 16, 2020
Eddy Elfenbein, October 16th, 2020 at 7:08 am“The best time to invest is when you have money.” – John Templeton
It’s the time of year for witches, tricks, black magic, hexes and sorcery. That’s right, it’s Q3 earnings season.
Over the next weeks, most of Corporate America will report how well it did during July, August and September. Or perhaps, how well it didn’t do.
We’ve already gotten our first look at some earnings reports. The big banks usually go first, and the results look pretty good. Goldman Sachs, for example, beat Wall Street’s consensus by more than 70%. For the moment, the big banks aren’t allowed to raise their dividends or buy back stock. I think that regulation may be lifted early next year. (Eagle is a small fry, so that’s why it was able to resume its buybacks.)
The stock market had a strong day on Monday but lost ground on Tuesday, Wednesday and Thursday. The folks in Washington seem hopelessly deadlocked on any stimulus deal. It looks like whatever happens, it will come after the election. There are also some concerns of a coronavirus spike in Europe.
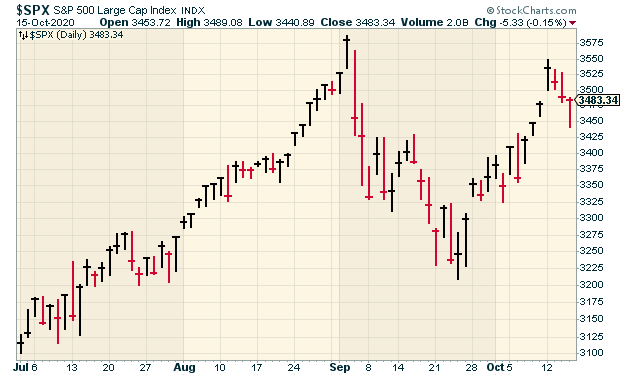
I’m pleased to see that our Buy List is holding up well. Since the market peaked on September 2, the S&P 500 has fallen 2.72%, while our Buy List is down just 0.20%. That tells me the high-quality stocks are serving as a safe harbor for nervous investors.
In this week’s issue, I’ll preview the first six of our Buy List stocks that are due to report earnings next week. I’m expecting good results. Last earnings season, every single Buy List stock beat earnings except one, and they reported inline.
Later on, I’ll discuss the big reorganization announcement from Disney. The Mouse House is apparently following after Netflix. I’ll tell you what it all means. But first let’s take a look at our updated Earnings Calendar.
Updated Buy List Earnings Calendar
Here’s a look at our upcoming Q3 earnings. I’ve listed each stock, its earnings date and Wall Street’s consensus. I’m still waiting to hear when Middleby and Broadridge will report. Both will probably report sometime in early November.
Stock Ticker Date Estimate Result Globe Life GL 21-Oct $1.75 Silgan SLGN 21-Oct $0.95 Stepan SCL 21-Oct $1.40 Check Point Software CHKP 22-Oct $1.53 Danaher DHR 22-Oct $1.36 Eagle Bancorp EGBN 22-Oct $0.81 AFLAC AFL 27-Oct $1.13 Fiserv FISV 27-Oct $1.16 Sherwin-Williams SHW 27-Oct $7.75 Cerner CERN 28-Oct $0.71 Church & Dwight CHD 29-Oct $0.67 Intercontinental Exchange ICE 29-Oct $0.99 Moody’s MCO 29-Oct $2.10 Stryker SYK 29-Oct $1.40 Trex TREX 2-Nov $0.37 Ansys ANSS 4-Nov $1.26 Becton, Dickinson BDX 5-Nov $2.52 Hershey HSY 6-Nov $1.70 Disney DIS 12-Nov -$0.71 Broadridge Financial Sol BR TBA $0.63 Middleby MIDD TBA $1.02 Six Buy List Earnings Previews
We have six Buy List stocks due to report next week: three on Wednesday and three more on Thursday.
In July, Globe Life (GL) reported fiscal-Q2 operating earnings of $1.65 per share. That beat expectations of $1.53 per share. The company also narrowed its operating income guidance for this year. The previous range was $6.65 to $7.25 per share. Now Globe Life sees earnings ranging from $6.80 to $7.04 per share.
If Globe Life’s outlook is correct, that means the shares are going for less than 12 times earnings. This tends to be one of the most stable stocks in our portfolio. GL is currently down 21% for us this year. It’s been dragged down with most of the financial sector. For Q3, Wall Street expects $1.75 per share.
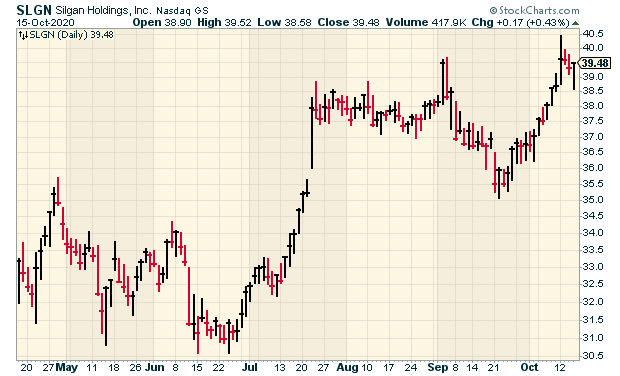
Silgan (SLGN) has been an impressive stock for us this year. I’m almost always surprised when I see which stocks are our big winners each year.
For Q2, the metal-container folks earned 85 cents per share. That beat expectations by 20 cents per share. This was the strongest quarter in the company’s history. Net sales were up by 7.6% to $1.18 billion. The stock popped on the news (see July in the chart below).
Silgan also did something very rare for 2020. The company increased guidance. Silgan now sees full-year earnings of $2.70 to $2.85 per share. Silgan also increased its free-cash-flow estimate for this year from $275 million to $330 million. For Q3, Wall Street expects Silgan to report earnings of 95 cents per share.
Stepan (SCL), our favorite chemical company, had a blow-out earnings report for Q2. The company raked in $1.65 per share. That beat estimates by 45 cents per share. The consensus for next week’s report is for $1.40 per share. Shares of Stepan are within 4% of a new 52-week high. The company has increased its dividend for the last 52 years in a row.
Check Point Software (CHKP) is due to report next Thursday. Three months ago, the Israeli cyber-security company reported Q2 earnings of $1.58 per share. That beat expectations by 14 cents per share.
The numbers were pretty good. Quarterly revenue rose 4% to $506 million. Wall Street had been expecting $488 million. Cash flow from operations increased by 8% to $252 million. During Q2, Check Point bought back 3.1 million shares for a total cost of $325 million. The company continues to have a solid balance sheet, which is something I like to see.
Interestingly, Check Point said that cyber-attacks have increased during the pandemic. In May, the company documented 192,000 coronavirus-related cyber-attacks a week.
On Thursday, Check Point snapped a six-day winning streak. For next week, Wall Street expects earnings of $1.53 per share.
Danaher (DHR) has become a very big winner for us this year. The stock hit a new 52-week high earlier this week. At Thursday’s close, DHR is up 47% for us this year. On our Buy List, that’s second only to Trex (TREX), which is up 74% this year.
Three months ago, Danaher said that Q2 earnings increased 32% to $1.44 per share. Wall Street had been expecting $1.09 per share. Revenue increased 19% to $5.3 billion.
For Q3, Danaher sees revenue growth “in the mid- to high-single digit range.” CEO Thomas P. Joyce, Jr., said, “We are very pleased with our second-quarter results—especially in such a challenging environment. Our solid revenue growth, strong cash-flow generation and more than 30% adjusted EPS growth are a testament to our team’s commitment to the Danaher Business System and the outstanding portfolio of businesses that comprise Danaher today.”
Shares of Danaher have drifted above our $212 Buy Below. I’ll probably adjust it next week, but I want to see the earnings report first.
Eagle Bancorp (EGBN) is also set to report next Thursday. We’ve been very patient with this one, and it looks like the story is finally turning in our favor. To recap, as a bank Eagle is a well-run outfit. The problem is that possible scandals by previous management have inflated its lawyer bills and depressed the stock.
The stock is currently going for about nine times this year’s earnings, and that’s after a nice rally. In one eleven-day stretch, Eagle rallied over 21%. The bank recently said it’s reinstating its share-buyback program. During Q1, the bank halted all share buybacks. Eagle wasn’t alone. A lot of companies did this at the start of the pandemic.
Through the end of this year, management has been authorized to buy as much as 5% of Eagle’s outstanding shares. As of Jun 30, Eagle had 460,000 shares remaining under the buyback authority.
Only five analysts have estimates for Q3. The consensus is for Eagle to report earnings of 81 cents per share. At its current share price, Eagle yields just under 3%.
What to Make of Disney’s Reorg
Last week, Dan Loeb called on Disney (DIS) to suspend its dividend. Loeb is a well-known activist investor. Currently, Disney pays a semi-annual dividend of 88 cents per share each July and December. The company skipped its dividend this summer.
An annual dividend of $1.76 per share works out to over $3 billion per year. Loeb wants Disney to put that cash into its streaming service.
But through it all, Disney’s streaming business has been a notable success story. After making its debut last November, Disney+ had 60.5 million subscribers worldwide by August—well ahead of analysts’ and Disney’s own forecasts. Its other offerings are Hulu, with 36 million, and ESPN+, with 9 million. Next year, Disney is also planning to add an international streaming service similar to Hulu, to be called Star.
Barron’s pointed out that this is the opposite of what activist investors usually do. They’re known for pursuing short-term profits at the expense of long-term financial health. This time, Loeb is looking at the long term.
I understand Loeb’s thinking, but I think he’s premature. In my view, it all comes down to Covid-19. If a vaccine comes out tomorrow, then Disney’s troubles go away. Disney is a company almost perfectly made to be impacted by the coronavirus.
Relatedly, I floated the idea on Twitter recently of Disneyland leaving California. Most Twitterers responded by saying this was a farfetched idea. Probably so. Still, the mess of Covid has allowed people to rethink what their businesses are about, and unthinkable options are now thinkable.
Disney is in the hot seat after announcing that it’s laying off 28,000 workers. Senator Elizabeth Warren, for example, criticized Disney for laying off employees while protecting executive salaries. To be fair, Disney has continued healthcare benefits to furloughed employees.
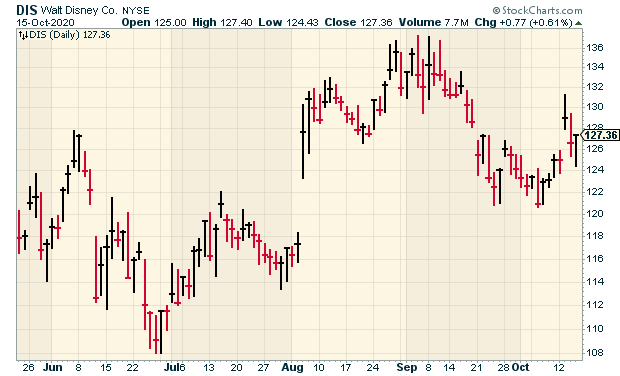
The big news this week is that Disney announced a major reorganization. The company is “centralizing its media businesses into a single organization that will be responsible for content distribution, ad sales and Disney+.” In my opinion, this is a reflection of the importance of streaming to Disney’s business. The company, in many ways, is shifting towards a business model of a company like Netflix. Kareem Daniel will be in charge of the new media and entertainment distribution group.
The announcement worked. Shares of Disney popped 3.7% on the news. I think investors like the idea of owning the “next Netflix,” and Disney getting an earnings multiple like Netflix. Still, this doesn’t solve Disney’s major near-term headache of being overly reliant on travel and sports—in other words, the things most impacted by Covid. The reorg is a provocative move, but don’t let it mislead you as to where Disney’s major concerns are.
Disney is due to report Q3 earnings on November 12, and investor day is on December 10.
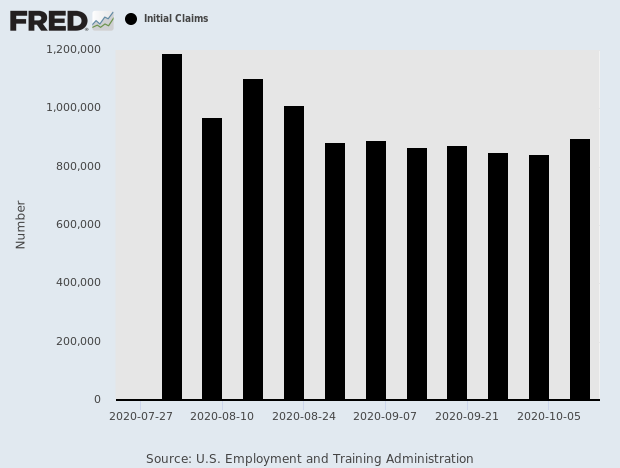
That’s all for now. Next week will be dominated by earnings. On Monday, we’ll get the NAHB homebuilder’s index. Then on Tuesday, housing starts and building permits are reported. On Thursday, the existing-home sales report comes out. Also on Thursday, we’ll get another jobless-claims report. The last one came in at 898,000. Be sure to keep checking the blog for daily updates. I’ll have more market analysis for you in the next issue of CWS Market Review!
– Eddy
Morning News: October 16, 2020
Eddy Elfenbein, October 16th, 2020 at 7:02 amTop World Bank Economist Says Financial Crisis Could Emerge From Pandemic
Wall Street Bank Trading Boom Does Little To Assuage Concerns About Lending
Twitter Changes Course After Republicans Claim ‘Election Interference’ & Facebook and Twitter Dodge a 2016 Repeat, and Ignite a 2020 Firestorm
A Biden Win Would Transform How the Wealthy Invest Their Money
U.S. Judge ‘Not Inclined’ To Reverse Decision On WeChat App Store Ban
Boeing Max Judged Safe to Fly by Europe’s Aviation Regulator
Antiviral Drug Remdesivir Proves Ineffective In Treating Covid-19, WHO Study Finds
Here’s Why Canned Corn Might Be Tough to Find At Supermarkets
Former Pipe Factory Worker Becomes a Budget-Store Billionaire
Shares of Gun Makers Gain as Biden’s Lead Grows
Feds Charge Tech Mogul Robert Brockman With Hiding $2 billion From IRS
Michael Batnick: This Time Was Different
Cullen Roche: Three Things I Think I Think – Cycles, Hunting Biden and Hacking Life
Ben Carlson: The Similarities Between Shane Battier and John Maynard Keynes
Joshua Brown: Here’s A Blank Slate & Countdown to the Election – Live Webcast
Be sure to follow me on Twitter.
Jobless Claims Rise to 898,000
Eddy Elfenbein, October 15th, 2020 at 11:07 amThis morning’s jobless claims report rose to 898,000. That was above Wall Street’s forecast of 830,000. This was also the highest report since August 22. I’ve talked before about the increase slowing down, but now claims are now moving in the wrong direction.
The total for the week ended Oct. 10 was the highest number since Aug. 22 and another sign that the labor market continues to struggle to get back to its pre-coronavirus pandemic mark as cases rise and worries increase over a renewed wave in the fall and winter. The number represented a gain of 53,000 from the previous week’s upwardly revised total of 845,000.
The stimulus talks appear to be deadlocked but the White House has signaled its willingness to keep negotiating.
House Speaker Nancy Pelosi, the lead negotiator for Democrats, had identified testing as one of the main sticking points in talks. Mnuchin appeared to cede ground to the speaker in an interview on CNBC’s “Squawk Box.”
“That issue is getting overblown,” Mnuchin said. “We’ve agreed to $178 billion overall for health. It’s an extraordinary amount of money. We’d agreed with the Democrats with $75 billion going to testing, contact tracing.”
The big banks are usually the first to report earnings and today we got the report from Morgan Stanley. The bank had a solid Q3. Overall, the banks are doing pretty well. This week, Morgan Stanley’s market cap passed Citigroup’s.
The banks are currently not allowed to increase dividends or buy back stock. This has resulted in a growing cash hoard at the banks.
Morning News: October 15, 2020
Eddy Elfenbein, October 15th, 2020 at 7:09 amIMF Sees Worldwide Debt Soaring to 100 Percent of GDP Due to COVID-19
ECB Sees Little Reason to Rush Into New Stimulus This Month
Trump Administration to Consider Adding China’s Ant Group to Trade Blacklist
Stepped Up Chinese Scrutiny Increases Investment Risk of ‘Beast’ Ant
Japanese Automakers Are Helping Fuel U.S. Recovery
Bank Earnings Show Diverging Fortunes on Wall Street and Main Street
Value Stocks Could Shine After U.S. Election, No Matter Who Wins
The End Of Oil? Battle Lines Drawn As Industry Grapples With Energy’s Future
Why These Retail Giants Are Booming Amid The Pandemic
A Small Business Argument for Joe Biden & What Small Business Owners Really Need From the Next President
DOJ Shoots Down DirecTV and Dish Merger Again
BTS Management’s Stock Soars on First Day of Trading
Ben Carlson: Animal Spirits: Bearish the Whole Way Up
Michael Batnick: Chart of the Day
Be sure to follow me on Twitter.
Earnings Season Begins
Eddy Elfenbein, October 14th, 2020 at 11:26 amYesterday, the market snapped its four-day winning streak, but stocks are up again today. Energy is particularly strong while the rest of the market is mixed. We got some of the first earnings reports this morning. The banks are usually first. Goldman Sachs crushed expectations ($9.68 vs $5.57) while Wells Fargo and Bank of America both missed expectations.
Richard Clarida, the vice-chair of the Fed, told the Institute of International Finance, “That said, the Covid-19 recession threw the economy into a very deep hole, and it will take some time, perhaps another year, for the level of GDP to fully recover to its previous 2019 peak…It will likely take even longer than that for the unemployment rate to return to a level consistent with our maximum-employment mandate.”
Morning News: October 14, 2020
Eddy Elfenbein, October 14th, 2020 at 7:02 amEurope Can Impose Tariffs on U.S. in Long-Running Aircraft Battle
After Two Lost Decades, U.S.’s Weakest Local Economies May Face Worse From Pandemic
Stocks Are Soaring — But Most Black People Are Missing Out
FDA Faults Quality Control at Lilly Plant Making Trump-Touted COVID Drug
BTS’s Loyal Army of Fans Is the Secret Weapon Behind a $4 Billion I.P.O.
Walmart’s Black Friday Plan Caps Customer Capacity at Just 20%
Amazon’s ‘Christmas Creep’ Poses Stress Test for FedEx, UPS
In China, Apple’s 5G iPhone 12 Sparks Fever-Pitch, But Divided Reaction
Three Things Apple Announced That People Actually Want, and One They Don’t
Meet The Guilt-Ridden Oil Billionaire Trying To Save The Planet
Joshua Brown: Disney Wants The Netflix Treatment, Renting A House, Breaking Up Tech Monopolies
Michael Batnick: And Now Some Bad News & New WAYT!
Ben Carlson: Why Are So Many Unprofitable Companies the Best Performing Stocks This Year?
Nick Maggiulli: The Best Investing Books for Every Kind of Investor
Be sure to follow me on Twitter.
The Market Is Down After Second-Highest Close
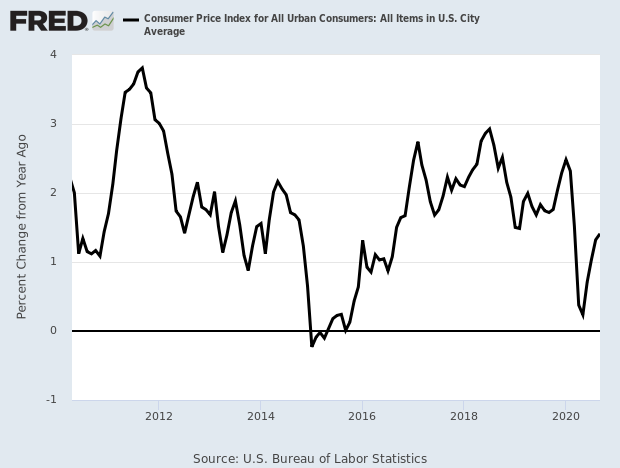
Eddy Elfenbein, October 13th, 2020 at 3:13 pmYesterday, the stock market closed at its second-highest level ever. Today, the market has pulled back some. This morning’s CPI report showed that both headline and core inflation rose by 0.2% last month.
The Labor Department said on Tuesday its consumer price index increased 0.2% last month after gaining 0.4% in August. The CPI advanced 0.6% in both June and July after falling in the prior three months as business closures to slow the spread of the coronavirus weighed on demand.
In the 12 months through September, the CPI increased 1.4% after rising 1.3% in August. Economists polled by Reuters had forecast the CPI climbing 0.2% in September and rising 1.4% year-on-year.
That’s not bad and it indicates that inflation isn’t heating up despite the Fed’s new permissive attitude. As I write this, the S&P 500 is off by about 0.60%.
Disney got a nice boost today thanks to its reorg announcement. At one point, shares of the Mouse House were up over 5%.
Here’s a chart of headline inflation:
Morning News: October 13, 2020
Eddy Elfenbein, October 13th, 2020 at 7:06 amDalio Says ‘Time Is on China’s Side’ in Power Struggle With U.S.
July Is the New January: More Companies Delay Return to the Office
Walt Disney Restructures Entertainment Businesses to Boost Streaming
Covid-19 Vaccines Are Chance at Salvation, Financial and Beyond, for Drug Makers
First, A Vaccine Approval. Then ‘Chaos and Confusion.’
J&J Halts Covid-19 Vaccine Trial Due to Unexplained Illness
Apple Event Expected to Bring 5G Speed, Smaller iPhone 12
Amazon Pandemic Prime Day Steals Rivals’ Black Friday Spotlight
Amazon Bets on Prime Day in Latin America to Battle Local Rivals
Audi to Build Electric Cars Geared to Chinese Buyers From 2024
Retail Investors Embrace Risk and the ‘Hive Mind’ in Stock Boom
Goldman Sachs Struggling to Reach Financial Targets
Economists Tell Stories, Just Like Novelists — Don’t Let the Nobel for ‘Economic Sciences’ Fool You
Three Rockefellers Say Banks Must Stop Financing Fossil Fuels
Ben Carlson: Don’t Mix Your Politics With Your Portfolio
Howard Lindzon: Momentum Monday – Blue Wave?
Be sure to follow me on Twitter.
Disney’s Reorg Announcement
Eddy Elfenbein, October 12th, 2020 at 4:39 pmAfter the bell, Disney released a statement.
In light of the tremendous success achieved to date in the Company’s direct-to-consumer business and to further accelerate its DTC strategy, The Walt Disney Company (NYSE: DIS) today announced a strategic reorganization of its media and entertainment businesses. Under the new structure, Disney’s world-class creative engines will focus on developing and producing original content for the Company’s streaming services, as well as for legacy platforms, while distribution and commercialization activities will be centralized into a single, global Media and Entertainment Distribution organization. The new Media and Entertainment Distribution group will be responsible for all monetization of content—both distribution and ad sales—and will oversee operations of the Company’s streaming services. It will also have sole P&L accountability for Disney’s media and entertainment businesses.
The creation of content will be managed in three distinct groups—Studios, General Entertainment, and Sports—headed by current leaders Alan F. Horn and Alan Bergman, Peter Rice, and James Pitaro. The Media and Entertainment Distribution group will be headed by Kareem Daniel, formerly President, Consumer Products, Games and Publishing. All five leaders will report directly to Bob Chapek, Chief Executive Officer, The Walt Disney Company. Disney Parks, Experiences and Products will continue to operate under its existing structure, led by Josh D’Amaro, Chairman, Disney Parks, Experiences and Products, who continues to report to Mr. Chapek. Rebecca Campbell will serve as Chairman, International Operations and Direct-to-Consumer. Bob Iger, in his role as Executive Chairman, will continue to direct the Company’s creative endeavors.
“Given the incredible success of Disney+ and our plans to accelerate our direct-to-consumer business, we are strategically positioning our Company to more effectively support our growth strategy and increase shareholder value,” Mr. Chapek said. “Managing content creation distinct from distribution will allow us to be more effective and nimble in making the content consumers want most, delivered in the way they prefer to consume it. Our creative teams will concentrate on what they do best—making world-class, franchise-based content—while our newly centralized global distribution team will focus on delivering and monetizing that content in the most optimal way across all platforms, including Disney+, Hulu, ESPN+ and the coming Star international streaming service.”
Under the new structure, the Company’s three content groups will be responsible and accountable for producing and delivering content for theatrical, linear and streaming, with the primary focus being the Company’s streaming services:
STUDIOS: Messrs. Horn and Bergman will serve as Chairmen, Studios Content, which will focus on creating branded theatrical and episodic content based on the Company’s powerhouse franchises for theatrical exhibition, Disney+ and the Company’s other streaming services. The group will include the content engines of The Walt Disney Studios, including Disney live action and Walt Disney Animation Studios, Pixar Animation Studios, Marvel Studios, Lucasfilm, 20th Century Studios and Searchlight Pictures.
GENERAL ENTERTAINMENT: Mr. Rice will serve as Chairman, General Entertainment Content, which will focus on creating general entertainment episodic and original long-form content for the Company’s streaming platforms and its cable and broadcast networks. The group will include the content engines of 20th Television, ABC Signature and Touchstone Television; ABC News; Disney Channels; Freeform; FX; and National Geographic.
SPORTS: Mr. Pitaro will serve as Chairman, ESPN and Sports Content, which will focus on ESPN’s live sports programming, as well as sports news and original and non-scripted sports-related content, for the cable channels, ESPN+, and ABC.
The Media and Entertainment Distribution group, led by Mr. Daniel, will be responsible for the P&L management and all distribution, operations, sales, advertising, data and technology functions worldwide for all of the Company’s content engines, and it will also manage operations of the Company’s streaming services and domestic television networks. The group will work in close collaboration with the content creation teams on programming and marketing.
Should Disney Cut Its Dividend?
Eddy Elfenbein, October 12th, 2020 at 12:16 pmLast week, Dan Loeb called on Disney (DIS) to suspend its dividend. Loeb is a well-known activist investor. Currently, Disney pays a semi-annual dividend of 88 cents per share, each July and December. The company skipped its dividend this summer.
An annual dividend of $1.76 per share works out to over $3 billion per year. Loeb wants Disney to put that cash into its streaming service.
But through it all, Disney’s streaming business has been a notable success story. After making its debut last November, Disney+ had 60.5 million subscribers worldwide by August—well ahead of analysts’ and Disney’s own forecasts. Its other offerings are Hulu, with 36 million, and ESPN+, with 9 million. Next year, Disney is also planning to add an international streaming service similar to Hulu, to be called Star.
Barron’s points out that this is the opposite of what activist investors usually do. They’re known for pursuing short-term profits at the expense of long-term financial health. This time, Loeb is looking at the long term.
I understand Loeb’s thinking, but I think he’s premature. In my view, it all comes down to Covid-19. If a vaccine comes out tomorrow, then Disney’s troubles go away. Disney is a company almost perfectly made to be impacted by the coronavirus.
Relatedly, I floated the idea on Twitter recently of Disneyland leaving California. Most Twitterers responded by saying this was a very farfetched idea. Probably so. Still, the mess of Covid has allowed people to rethink what their business is about, and unthinkable options are now thinkable.
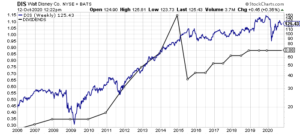
(Note on the chart above. The black line is dividends. Disney switched from an annual to a semi-annual dividend.)
-
Archives
- July 2026
- June 2026
- May 2026
- April 2026
- March 2026
- February 2026
- January 2026
- December 2025
- November 2025
- October 2025
- September 2025
- August 2025
- July 2025
- June 2025
- May 2025
- April 2025
- March 2025
- February 2025
- January 2025
- December 2024
- November 2024
- October 2024
- September 2024
- August 2024
- July 2024
- June 2024
- May 2024
- April 2024
- March 2024
- February 2024
- January 2024
- December 2023
- November 2023
- October 2023
- September 2023
- August 2023
- July 2023
- June 2023
- May 2023
- April 2023
- March 2023
- February 2023
- January 2023
- December 2022
- November 2022
- October 2022
- September 2022
- August 2022
- July 2022
- June 2022
- May 2022
- April 2022
- March 2022
- February 2022
- January 2022
- December 2021
- November 2021
- October 2021
- September 2021
- August 2021
- July 2021
- June 2021
- May 2021
- April 2021
- March 2021
- February 2021
- January 2021
- December 2020
- November 2020
- October 2020
- September 2020
- August 2020
- July 2020
- June 2020
- May 2020
- April 2020
- March 2020
- February 2020
- January 2020
- December 2019
- November 2019
- October 2019
- September 2019
- August 2019
- July 2019
- June 2019
- May 2019
- April 2019
- March 2019
- February 2019
- January 2019
- December 2018
- November 2018
- October 2018
- September 2018
- August 2018
- July 2018
- June 2018
- May 2018
- April 2018
- March 2018
- February 2018
- January 2018
- December 2017
- November 2017
- October 2017
- September 2017
- August 2017
- July 2017
- June 2017
- May 2017
- April 2017
- March 2017
- February 2017
- January 2017
- December 2016
- November 2016
- October 2016
- September 2016
- August 2016
- July 2016
- June 2016
- May 2016
- April 2016
- March 2016
- February 2016
- January 2016
- December 2015
- November 2015
- October 2015
- September 2015
- August 2015
- July 2015
- June 2015
- May 2015
- April 2015
- March 2015
- February 2015
- January 2015
- December 2014
- November 2014
- October 2014
- September 2014
- August 2014
- July 2014
- June 2014
- May 2014
- April 2014
- March 2014
- February 2014
- January 2014
- December 2013
- November 2013
- October 2013
- September 2013
- August 2013
- July 2013
- June 2013
- May 2013
- April 2013
- March 2013
- February 2013
- January 2013
- December 2012
- November 2012
- October 2012
- September 2012
- August 2012
- July 2012
- June 2012
- May 2012
- April 2012
- March 2012
- February 2012
- January 2012
- December 2011
- November 2011
- October 2011
- September 2011
- August 2011
- July 2011
- June 2011
- May 2011
- April 2011
- March 2011
- February 2011
- January 2011
- December 2010
- November 2010
- October 2010
- September 2010
- August 2010
- July 2010
- June 2010
- May 2010
- April 2010
- March 2010
- February 2010
- January 2010
- December 2009
- November 2009
- October 2009
- September 2009
- August 2009
- July 2009
- June 2009
- May 2009
- April 2009
- March 2009
- February 2009
- January 2009
- December 2008
- November 2008
- October 2008
- September 2008
- August 2008
- July 2008
- June 2008
- May 2008
- April 2008
- March 2008
- February 2008
- January 2008
- December 2007
- November 2007
- October 2007
- September 2007
- August 2007
- July 2007
- June 2007
- May 2007
- April 2007
- March 2007
- February 2007
- January 2007
- December 2006
- November 2006
- October 2006
- September 2006
- August 2006
- July 2006
- June 2006
- May 2006
- April 2006
- March 2006
- February 2006
- January 2006
- December 2005
- November 2005
- October 2005
- September 2005
- August 2005
- July 2005
 Eddy Elfenbein is a Washington, DC-based speaker, portfolio manager and editor of the blog Crossing Wall Street. His