Author Archive
-
RIP: Paul Volcker
Eddy Elfenbein, December 9th, 2019 at 11:50 am
Former Fed Chairman Paul Volcker has died at the age of 92. Volcker ran the Fed from 1979 to 1987. His tenure may have been one of the most important in the Fed’s history.
Volcker raised rates to extraordinary levels in an attempt to kill inflation. The strategy worked but it sent the U.S. economy into a painful recession. At one point, Volcker was given Secret Service protection.
The inflation rate was 1% under President Lyndon Johnson in 1965 but ballooned to a breakneck 14.8% in March 1980. To combat the price rises, Volcker’s Fed jacked up the federal funds rate and tightened the money supply. The rate, used by banks and credit unions for overnight loans to other depository institutions, reached a record 22.36% in July 1981. (By comparison, it was zero to 0.25% from December 2008 to December 2015, during the financial crisis and its aftermath.) Shortly after becoming Fed chairman, Volcker raised the discount rate by 0.5%, which would be considered a sizable jolt today.
The imposing Volcker stood 6’7″. He was appointed by President Carter and reappointed by President Reagan.
-
Morning News: December 9, 2019
Eddy Elfenbein, December 9th, 2019 at 7:32 amJapanification the Scourge Threatening to Go Global in 2020
I.M.F., Endorsing Zelensky, Approves Loan for Ukraine
Repo Blowup Was Fueled By Big Banks and Hedge Funds
Trump Cripples W.T.O. as Trade War Rages
This Man May Be Big Tech’s Biggest Threat
Swelling U.S. IPO Backlog Points to Crowded 2020 Field
HSBC Investment Banking Chief to Step Down
Trial Begins in U.S. States’ Effort to Block T-Mobile/Sprint Deal
A $1 Billion Grudge Drove GM’s Shock Suit Against Fiat Chrysler
Why Apple Scrapped the Release of Its Oscar Contender, ‘The Banker’
Jeff Miller: Weighing the Week Ahead: Will This Rally Never End?
Cullen Roche: My View on “Late Stage Capitalism”
Roger Nusbaum: 401k Assets To Pay Student Loans?
Howard Lindzon: Momemtum Monday…The Financials Have Joined The Party
Michael Batnick: Things We Take for Granted, and Things We Don’t Miss
Be sure to follow me on Twitter.
-
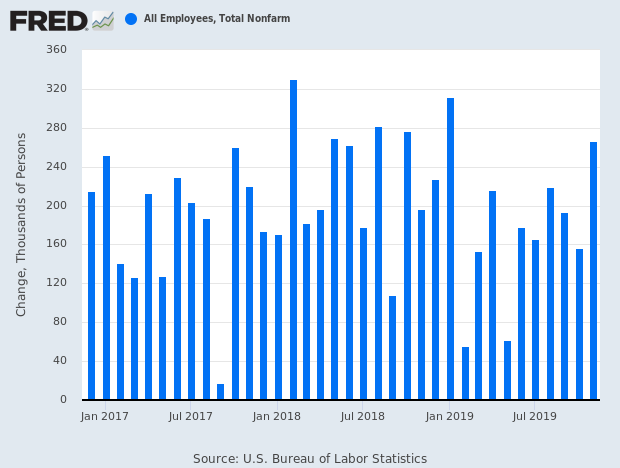
November NFP +266,00; Unemployment 3.5%
Eddy Elfenbein, December 6th, 2019 at 8:38 amThe November jobs report is out. The US economy created 266,000 net new jobs last month. The forecast was for 187,000. There were also positive revisions of 41,000 jobs (13,000 to September and 28,000 to October).
The unemployment rate is now 3.5% which is a 50-year low. The U-6 Rate ticked down 0.1% to 6.9%. The labor force participation rate is 63.2%. That also fell by 0.1%.
Average hourly earnings rose seven cents to $28.29. In the last year that’s up 3.1%.
Manufacturing saw an increase of 54,000 jobs. Motor vehicles and parts rose by 41,000 due to the end of the GM strike. Healthcare, as well as leisure and hospitality, rose by 45,000.
-
CWS Market Review – December 6, 2019
Eddy Elfenbein, December 6th, 2019 at 7:08 am“Whatever happens in the stock market today has happened before and will happen again.” – Jesse Livermore
I hope everyone had a great Thanksgiving. We have a lot to be thankful for this year, especially a very good stock market.
Before I get to today’s issue, I have an announcement. I’m going to unveil the 2020 Buy List on December 25. It’s Buy List-mas!
This year, Christmas falls on a Wednesday and the market will be closed, so that’s a good time to send you a special issue with our 2020 Buy List. As a reminder, we change the Buy List just once a year. Five new stocks will go in and five current stocks will come out. The Buy List will remain at 25 stocks. I like to announce the new stocks a few days early so no one can claim I’m somehow manipulating the market.
For track-record purposes, the 25 stocks are assumed to be equally balanced based on the closing prices as of December 31. Then on January 2, the first day of trading for the new year, the new Buy List goes into effect. After that, it’s locked and sealed, and I can’t make any changes for the next 12 months.
Following the Christmas issue, I’ll send you another issue on January 1 which will have a performance summary of the 2019 Buy List and the details for the 2020 Buy List. It’s looks like we’re headed toward another market-beating year! Patience and discipline eventually pay off.
In this week’s CWS Market Review, I’ll discuss next week’s Fed meeting. (Spoiler alert: The Fed will leave rates alone.) I’ll also recap the two earnings reports we had before Thanksgiving. We also had some dividend increases recently (54 straight years for Hormel!). But first, let’s see what the Fed has in store for us next week.
Don’t Expect Another Fed Rate Cut Next Week
The Federal Reserve meets again next week on December 10-11. This is also a meeting where the Fed will update its economic projections for the next few years. (The Fed’s track record is terrible, even for economists.)
It’s widely expected that the Fed won’t change rates. Let me be somewhat clearer—the Fed won’t change rates next week.
In fact, it looks like the Fed won’t change rates for a few months. According to the futures market, the earliest cut would happen this summer, and that’s probably stretching it. If I had to guess, I’d say the Fed will probably raise rates before the end of next year.
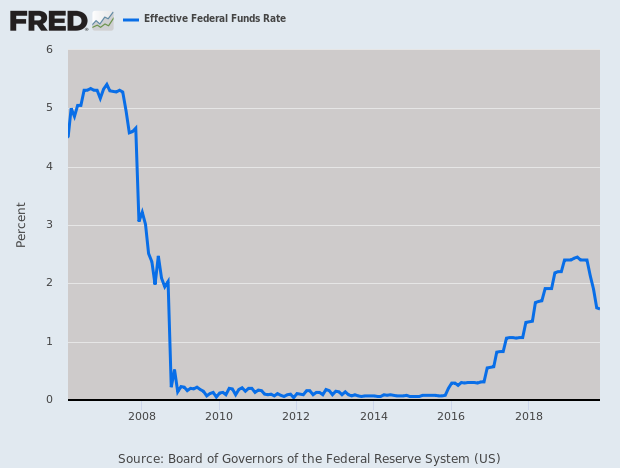
In any event, the Fed’s recent rate cuts were exactly what the market needed. They helped propel our late-year rally. The recent market has been one of small steps that are mostly upward. Here’s an interesting stat (via Callie Cox): so far this year, the S&P 500 has closed higher on 138 trading days. That’s a success rate of 58.7% which is the best rate since 1995.
The S&P 500 has nearly done two months without a daily decline of more than 1%. In fact, we’ve only had two days in the last two months where the index fell by more than 0.5%.
For one thing, the economic outlook is brighter. The Atlanta Fed’s GDPNow forecast sees Q4 GDP rising by 1.5%. That’s not much, but the forecast had been 0.3% just a few weeks ago.
Also, the bond market has stopped rallying. The yield on the 10-year has somewhat stabilized between 1.7% and 1.8%. For Q4, the S&P 500 will probably show earnings growth of about 15%, give or take.
Speaking of earnings, let’s look at two of our recent Buy List earnings reports.
Smucker Beat Earnings But Cut Guidance
On November 22, shortly after I sent you the last issue, JM Smucker (SJM) reported fiscal Q2 earnings of $2.26 per share. That beat Wall Street’s forecast of $2.13 per share, although adjusted net sales fell 1%. Cash from operations was up by 10%.
The bad news is that Smucker again lowered its full-year guidance. The previous guidance range has been $8.35 to 8.55 per share. Now Smucker sees earnings of $8.10 to $8.30 per share. This is the second time they’ve cut guidance. The original guidance was $8.45 to $8.65 per share.
This is what the company had to say:
“While our second-quarter sales performance did not meet our expectations, we delivered EPS growth ahead of our projection, reflecting our commitment to maintain financial discipline and strengthen our bottom line,” said Mark Smucker, President and Chief Executive Officer.
“Despite continuing softness for our premium dog-food offerings, we were pleased with the performance for the balance of our portfolio, as the momentum for our cat-food and pet-snacks businesses continued with year-over-year sales increases, our high-growth coffee brands improved household penetration and market share, and Smucker’s Uncrustables grew 19 percent, helping accelerate growth in snacking. Looking ahead, the actions we are taking across the Company, including the recently announced leadership changes, position us well for future long-term growth and shareholder-value creation.”
The problem has been their premium dog-food business. Smucker has said that other parts of the business will help soften the blow from bad pet-food sales. I’m not pleased with these results. Fortunately, the stock has been fairly stable. Perhaps some traders had been expecting even worse news. Shares of SJM have rallied for the last four days in a row. SJM remains a buy up to $112 per share.
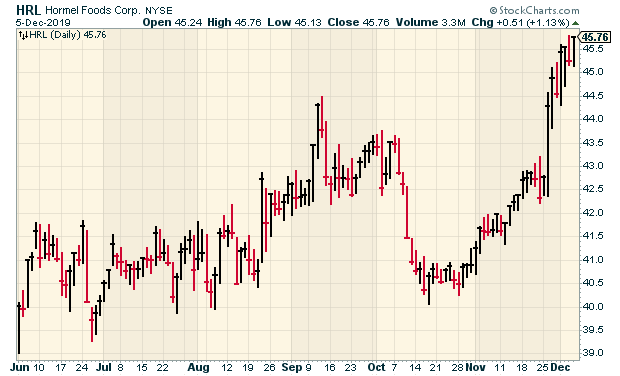
Hormel Foods Beat Earnings
On Tuesday, November 26, Hormel Foods (HRL) reported fiscal Q4 earnings of 47 cents per share. That was one penny better than estimates. For the entire fiscal year, Hormel made $1.80 per share.
For next year, Hormel sees sales ranging between $9.5 billion and $10 billion and EPS between $1.69 and $1.83. Wall Street had been expecting $1.76 per share.
Hormel also raised its annual dividend from 84 cents to 93 cents per share. This is the 54th year in a row that Hormel has increased its dividend.
“Refrigerated Foods has been a strong earnings contributor all year, and this quarter was no different. I am proud of how our value-added businesses helped offset another steep decline in commodity profits,” Snee said. “Grocery Products and Jennie-O Turkey Store posted modest earnings growth while the International results were below our expectations as the team continues to manage through challenges due to African swine fever and global trade uncertainty.”
“We grew organic volume and sales in three of our four segments this quarter,” Snee said. “Our SPAM® family of products and Herdez® authentic salsas and sauces were notable contributors within Grocery Products. Refrigerated Foods delivered strong value-added sales growth with excellent results posted by brands such as Hormel® Bacon 1TM, Hormel® Fire BraisedTM, Hormel® Black Label® and Columbus®. Jennie-O Turkey Store delivered top-line growth led by a double-digit increase in whole-bird sales. We made nice gains in lean-ground-turkey distribution, but we have much more work to do.”
The shares got a nice bump on Tuesday and have been holding on to those gains since then. Since October 28, HRL is up 13%. This week, I’m lifting my Buy Below on Hormel Foods to $48 per share.
Buy List Updates
Shares of AFLAC (AFL) took a tumble on Monday and Tuesday. The company held an investor presentation yesterday. You can see the PDF here.
The duck stock underwhelmed investors with its outlook for 2020. AFLAC said it sees earnings of $4.39 to $4.59 assuming the yen averages ¥105 for the year. But if the yen averages ¥110, then AFLAC sees earnings of $4.30 to $4.50. If the yen trades at ¥115, then AFLAC sees earnings of $4.23 to $4.43 per share.
In simple terms, AFLAC basically sees flat earnings for next year. That’s really not about their poor performance but a tougher environment. There’s nothing wrong with AFLAC.
We also had two more dividend increases. Stryker (SYK) said it’s raising its payout by 11%. The quarterly dividend will increase from 52 cents to 57.5 cents per share. The new dividend is payable on January 31 to shareholders of record on December 31.
Going by Thursday’s close, Stryker now yields 1.1%. This is their 27th annual dividend increase in a row.
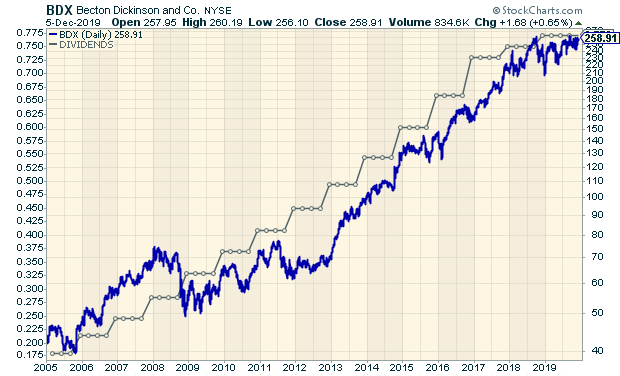
Becton, Dickinson (BDX) has an even longer streak. The company just bumped up its dividend for the 48th year in a row. The quarterly payout increases from 77 cents to 79 cents per share. The dividend will be payable on December 31 to holders of record on December 10.
Last month, Becton beat earnings by one penny per share. The company sees revenue growth for next year of 4% to 4.5% which is 5% to 5.5% on a currency-neutral basis. Becton sees 2020 EPS ranging between $12.50 and $12.65. Going by Thursday’s close, BDX now yields 1.2%.
Fiserv (FISV) said it’s selling its investment-services division to a private-equity firm. Fiserv will still own 40% of the division. The deal is expected to close in the first quarter of 2020. It should bring in $510 million in after-tax profits for the company. I’m raising our Buy Below on Fiserv to $117 per share.
Before I go, I want to make two other adjustments to our Buy Below prices. I’m raising our Buy Below on RPM International (RPM) to $77 per share. I’m also raising Globe Life (GL) to $104 per share.
That’s all for now. The big November jobs report will be out later this morning. The consensus is for 180,000 net new jobs. The Federal Reserve meets again on Tuesday and Wednesday. The policy statement will come out on Wednesday at 2 p.m. ET followed by a press conference by Fed Chairman Jerome Powell. The CPI report is also due out on Wednesday, and the retail-sales report comes out on Friday. Be sure to keep checking the blog for daily updates. I’ll have more market analysis for you in the next issue of CWS Market Review!
– Eddy
-
Morning News: December 6, 2019
Eddy Elfenbein, December 6th, 2019 at 7:06 amThe Prince Got His World-Beating IPO. Now the Hard Work Begins
OPEC and Russia Agree to Cuts in Oil Production
U.S. Objects to World Bank’s Lending Plans for China
China to Waive Trade War Tariffs for Some U.S. Soy, Pork Purchases
What to Expect From the November Jobs Report
Returning General Motors Workers Seen Boosting U.S. November Payrolls
Is Blockchain the New Ethical Gold Rush? Maybe.
One of Wall Street’s Most Lucrative Businesses Is at Risk
SoftBank to Have ‘Last Laugh’ on WeWork Deal, Bernstein Says
United C.E.O. Munoz to Step Down, 5 Years After Leading Turnaround
GM And LG Chem Plan $2.3 Billion Electric Battery Venture In Ohio
BlackRock Just Fired a Potential Successor to CEO Larry Fink. Here’s Why.
Joshua Brown: Fortune’s 2020 Roundtable
Michael Batnick: Animal Spirits: It Is What It Is
Ben Carlson: Bull Markets Last Much Longer Than You Think & There’s Always a Bear Market Somewhere
Be sure to follow me on Twitter.
-
Morning News: December 5, 2019
Eddy Elfenbein, December 5th, 2019 at 7:29 amJapan Plans to Spend $120 Billion to Stimulate Slowing Economy
China in Close Contact With U.S. on Trade, Urges Tariffs Cut
China’s Genetic Research on Ethnic Minorities Sets Off Science Backlash
Could Tax Increases Speed Up the Economy? Democrats Say Yes
U.S. Labor Market Is Helping Trump and Fed Be More Patient
Wall Street’s High-Stake Bets on Calm Less Risky Than They Seem
Gazing Into the Recession Crystal Ball
How Google’s Founders Slowly Stepped Away From Their Company
Huawei Sues the F.C.C., Ramping Up Fight With Critics and Foes
How a Preacher’s Grandson From Rural Georgia Grew Up to Lead Cisco
Delivery Only: The Rise Of Restaurants With No Diners As Apps Take Orders
Cullen Roche: Do Rich People Debunk MMT?
Michael Batnick: The Portfolio Gap
Howard Lindzon: My Poop Prayers Have Been Answered…Now Pray For Google’s Sundar Pichai
Be sure to follow me on Twitter.
-
Stryker Raises Dividend 11%
Eddy Elfenbein, December 4th, 2019 at 3:19 pmHere’s the press release:
Stryker (SYK) announced that its Board of Directors has declared a quarterly dividend of $0.575 per share payable on January 31, 2020 to shareholders of record at the close of business on December 31, 2019, representing an increase of approximately 11% versus the prior year and the previous quarter.
“We continue to deliver strong financial results, and consistent with our stated capital allocation philosophy, are raising our dividend 11%,” said Kevin Lobo, Chairman and Chief Executive Officer.
The old dividend was 52 cents per share. Based on the new dividend, SYK now yields 1.1%.
-
Morning News: December 4, 2019
Eddy Elfenbein, December 4th, 2019 at 7:19 amU.S., China Move Closer to Trade Deal Despite Harsh Rhetoric
Trump Volatility in Markets Is Back
Fighting Climate Change Comes With $2.5 Trillion Price Tag
Google Co-Founders Step Aside as Pichai Takes Helm of Parent Alphabet
Amazon Air Provider Hit With ‘No Confidence’ Vote as Holiday Shipping Ramps Up
Trump Loses Appeal on Deutsche Bank Subpoenas
Ray Dalio Is More Famous Than Ever and Delivering Subpar Returns
Why Cleveland-Cliffs Buying AK Steel Will Hurt the Steel Industry
JP Morgan Expects Bigger OPEC Production Cuts and No More ‘Free Passes’ for U.S. Shale Drillers
How Huawei Lost the Heart of the Chinese Public
An Unusually Cold and Wet Potato Harvest Season May Lead to a French Fry Shortage in the US
Nick Maggiulli: How to Spend Money
Roger Nusbaum: Quantifying Optionality?
Michael Batnick: There’s Always a Bear Market Somewhere
Joshua Brown: The 60/40 Portfolio Wins Again
Be sure to follow me on Twitter.
-
AFLAC Drops After Investors Presentation
Eddy Elfenbein, December 3rd, 2019 at 12:25 pmThe market is down again today thanks to trade tensions with China. Yesterday, the S&P 500 had its worst day in nearly two months. In fact, the loss was twice as much as the second-worst day. Today’s drop could be even larger.
Yesterday’s ISM Manufacturing report was not terribly good. The number came in at 48.1 which was below expectations. Any reading below 50 signals a contraction, so that means that the factory sector of the economy is no longer growing.
Shares of AFLAC (AFL) fell yesterday and today. The company held an investor presentation yesterday. The duck gave its outlook for 2020. AFLAC said it sees earnings of $4.39 to $4.59 if the yen averages 105 for the year. But if the yen averages 110, then AFLAC sees earnings of $4.30 to $4.50. If the yen trades at 115, then AFLAC sees earnings of $4.23 to $4.43 per share.
In simple terms, AFLAC basically sees flat earnings for next year. That’s really about their poor performance but a tougher environment.
-
Morning News: December 3, 2019
Eddy Elfenbein, December 3rd, 2019 at 7:23 amChina’s Schoolchildren Are Now the Smartest in the World
As Climate Warnings Grow Dire, Energy Companies Face A ‘New Frontier Of Threats’
Trump Sees No Deadline for China Deal, Prefers to Wait For 2020 Election
Here’s What Happens to Markets If U.S. Tariffs on China Kick in Dec. 15
French Wine Could Face 100% Tariffs as Trump Confronts France Over Tech Taxes
Trump Says U.S. Will Impose Metal Tariffs on Brazil and Argentina
White House Considered Kicking Huawei Out of U.S. Banking System
Watch 4 Decades of Inequality Drive American Cities Apart
Reduce Stock Market Holdings With The Dow, S&P And Nasdaq In ‘Inflating Parabolic Bubble’
‘Flight Shaming’ Revives the Sleeper Train
PG&E Had Systemic Problems With Power Line Maintenance, California Probe Finds
If You Bought a Smart TV on Black Friday, the FBI has a Warning for You
Joshua Brown: The Big Thing Investors Have Trouble Accepting
Ben Carlson: Talk Your Book: Elimination Alpha – How to XOUT Your Portfolio Losers
Be sure to follow me on Twitter.
-
Archives
- July 2026
- June 2026
- May 2026
- April 2026
- March 2026
- February 2026
- January 2026
- December 2025
- November 2025
- October 2025
- September 2025
- August 2025
- July 2025
- June 2025
- May 2025
- April 2025
- March 2025
- February 2025
- January 2025
- December 2024
- November 2024
- October 2024
- September 2024
- August 2024
- July 2024
- June 2024
- May 2024
- April 2024
- March 2024
- February 2024
- January 2024
- December 2023
- November 2023
- October 2023
- September 2023
- August 2023
- July 2023
- June 2023
- May 2023
- April 2023
- March 2023
- February 2023
- January 2023
- December 2022
- November 2022
- October 2022
- September 2022
- August 2022
- July 2022
- June 2022
- May 2022
- April 2022
- March 2022
- February 2022
- January 2022
- December 2021
- November 2021
- October 2021
- September 2021
- August 2021
- July 2021
- June 2021
- May 2021
- April 2021
- March 2021
- February 2021
- January 2021
- December 2020
- November 2020
- October 2020
- September 2020
- August 2020
- July 2020
- June 2020
- May 2020
- April 2020
- March 2020
- February 2020
- January 2020
- December 2019
- November 2019
- October 2019
- September 2019
- August 2019
- July 2019
- June 2019
- May 2019
- April 2019
- March 2019
- February 2019
- January 2019
- December 2018
- November 2018
- October 2018
- September 2018
- August 2018
- July 2018
- June 2018
- May 2018
- April 2018
- March 2018
- February 2018
- January 2018
- December 2017
- November 2017
- October 2017
- September 2017
- August 2017
- July 2017
- June 2017
- May 2017
- April 2017
- March 2017
- February 2017
- January 2017
- December 2016
- November 2016
- October 2016
- September 2016
- August 2016
- July 2016
- June 2016
- May 2016
- April 2016
- March 2016
- February 2016
- January 2016
- December 2015
- November 2015
- October 2015
- September 2015
- August 2015
- July 2015
- June 2015
- May 2015
- April 2015
- March 2015
- February 2015
- January 2015
- December 2014
- November 2014
- October 2014
- September 2014
- August 2014
- July 2014
- June 2014
- May 2014
- April 2014
- March 2014
- February 2014
- January 2014
- December 2013
- November 2013
- October 2013
- September 2013
- August 2013
- July 2013
- June 2013
- May 2013
- April 2013
- March 2013
- February 2013
- January 2013
- December 2012
- November 2012
- October 2012
- September 2012
- August 2012
- July 2012
- June 2012
- May 2012
- April 2012
- March 2012
- February 2012
- January 2012
- December 2011
- November 2011
- October 2011
- September 2011
- August 2011
- July 2011
- June 2011
- May 2011
- April 2011
- March 2011
- February 2011
- January 2011
- December 2010
- November 2010
- October 2010
- September 2010
- August 2010
- July 2010
- June 2010
- May 2010
- April 2010
- March 2010
- February 2010
- January 2010
- December 2009
- November 2009
- October 2009
- September 2009
- August 2009
- July 2009
- June 2009
- May 2009
- April 2009
- March 2009
- February 2009
- January 2009
- December 2008
- November 2008
- October 2008
- September 2008
- August 2008
- July 2008
- June 2008
- May 2008
- April 2008
- March 2008
- February 2008
- January 2008
- December 2007
- November 2007
- October 2007
- September 2007
- August 2007
- July 2007
- June 2007
- May 2007
- April 2007
- March 2007
- February 2007
- January 2007
- December 2006
- November 2006
- October 2006
- September 2006
- August 2006
- July 2006
- June 2006
- May 2006
- April 2006
- March 2006
- February 2006
- January 2006
- December 2005
- November 2005
- October 2005
- September 2005
- August 2005
- July 2005
 Eddy Elfenbein is a Washington, DC-based speaker, portfolio manager and editor of the blog Crossing Wall Street. His