Author Archive
-
JM Keynes: Currency Trader
Eddy Elfenbein, January 13th, 2016 at 8:40 amFrom Neil Irwin at the NYT:
But winning big in currencies is harder than it looks — even if you happen to be one of history’s greatest economic thinkers.
That’s the conclusion two scholars reached after scouring the records of John Maynard Keynes, the British economist who, when he wasn’t advancing economic thought in the 1920s and 1930s, spent a great deal of time investing in stocks and currencies. At the peak in 1936, Keynes had more than 250,000 pounds invested, the equivalent of $23 million today.
But even while writing a treatise that would be one of the foundational texts of 20th-century economics (“The General Theory of Employment, Interest and Money,” published in 1936) and hobnobbing at the highest levels of global finance, his returns were pretty, well, mediocre. He had an average annual return of 8.9 percent from 1920 to 1927, and a mere 2.5 percent from 1932 to 1939, according to research by Olivier Accominotti of the London School of Economics and David Chambers of the Cambridge Judge Business School newly published in The Journal of Economic History.
(…)
Keynes bet that the United States dollar would appreciate — just before Franklin Delano Roosevelt abandoned the gold standard in 1933, a move that caused the dollar to lose value. Keynes did correctly predict that France and the Netherlands would eventually abandon the gold standard in the 1930s, leading to declines in the franc and guilder. But he was early, and so incurred years of losses on the trade before his economic foresight paid off.
“In many cases he called currencies right in terms of direction,” Mr. Chambers said. “But his great frustration was how to time a trading position. That was the thing he found most difficult.”
This is a good point about investing: even if you’re right on the big picture, you still need to get the timing right. In The Big Short, the guys were right but they had to wait and wait and suffer big losses until they hit their payday.
From the final day of trading in 1986 until April 12, 1988, the Dow gained 11.3%. True, it wasn’t in a straight line.
-
Morning News: January 13, 2016
Eddy Elfenbein, January 13th, 2016 at 6:33 amGundlach Paints Bearish Outlook for 2016 Investing, Economy
Oil Rebounds From Below $30 as Threat of Further Drop Persists
Chinese Exports Post First Annual Decline Since 2009
China Trade Surprise Brings Relief
Russia Mulls Budget Cuts and Bank Stake Sales
Nigeria State Oil Company Holds First IPO by 2018
MetLife Unit’s SIFI Off-Ramp Seen Pressuring AIG as Icahn Looms
Yum Shares Rise After December Gain in China Same-Store Sales
PC Sales Drop To Historic Lows
Qualcomm, TDK Join Forces in $3 Billion Radio-Chip Venture
Big Beer’s Plan to Sell to Consumers Who Hate Them
’Bellwether’ G.M. Trial Opens Over Defect Claim
Cullen Roche: The Bear Market Playbook
Jeff Carter: What Skills Will People Need In The Future?
Be sure to follow me on Twitter.
-
Our Buy List Nearly Doubled the Market Today
Eddy Elfenbein, January 12th, 2016 at 5:02 pmToday was an excellent day for our Buy List. Of course, I stress the benefits of looking at the long-term so we shouldn’t get too excited about one good day. But it was a very good day. Our Buy List gained 1.54% today which nearly doubled the S&P 500’s gain of 0.78%.
Seven trading days into the year, we’ve opened up a small lead against the overall market. Or more accurately, we’re down but not by quite as much. Through today, our Buy List is down 4.02% YTD compared with a loss of 5.14% for the S&P 500.
Cognizant Technology Solutions (CTSH) was our top performer today. The stock gained 6.28% in today’s session. There’s been some horrible flooding in India and Cognizant wanted to update investors on their status. The good news is that Cognizant won’t be financially impacted by the floods. The company reiterated their 2015 full-year guidance for earnings of at least $3.03 per share. That means they expect Q4 earnings of at least 77 cents per share.
“Cognizant extends its gratitude to its employees, business partners, government agencies, and others involved in recovery efforts that helped in quickly bringing our business operations back to normal,” said Gordon Coburn, President of Cognizant. “We are also grateful to our clients for their understanding of the circumstances, and their support of our Business Continuity Plan actions taken during the flood to successfully ensure continued delivery of services.”
After the closing bell, Ford Motor (F) announced a special 25 cent dividend. This is on top of their regular 15 cent quarterly dividend. The dividend will be paid on March 1 to shareholders of record on January 29. The automaker also said it expects record profits for 2015 and equal or better profits for 2016. The stock is down about 3% in the after-hours market.
Also after the bell, Stryker (SYK) narrowed its full-year range for 2015. The previous range was $5.07 to $5.12 per share. Now it’s $5.09 to $5.12 per share. This is the third revision to their full-year range. The initial guidance was for $4.90 to $5.10 per share, then it went to $5.06 to $5.12 per share. Earnings are due out on January 26.
-
High Yielding Dividend Aristocrats
Eddy Elfenbein, January 12th, 2016 at 2:06 pmThanks to the recent market selloff, many good stocks are going for decent prices. Here’s a list of Dividend Aristocrats that are currently yielding over 3%. To become a Dividend Aristocrat, a company needs to have raised its dividend for the past 25 years in a row.
AbbVie ABBV 4.23% Archer-Daniels-Midland ADM 3.28% AT&T T 5.66% Chevron CVX 5.30% Cincinnati Financial CINF 3.29% Coca-Cola KO 3.17% Consolidated Edison ED 3.92% Emerson Electric EMR 4.34% Exxon Mobil XOM 3.96% Genuine Parts GPC 3.11% HCP, Inc. HCP 6.11% Johnson & Johnson JNJ 3.07% Leggett & Platt LEG 3.23% McDonald’s MCD 3.05% Nucor NUE 4.15% Procter & Gamble PG 3.46% Sysco SYY 3.09% T. Rowe Price TROW 3.20% Target TGT 3.09% Wal-Mart Stores WMT 3.05% Also on our Buy List, Ford and Wells Fargo both yield over 3%, while Microsoft and AFLAC aren’t far away.
Biogen’s CEO on CNBC
Eddy Elfenbein, January 12th, 2016 at 12:57 pmMorning News: January 12, 2016
Eddy Elfenbein, January 12th, 2016 at 7:09 amEuropean Stocks Rise as Commodities Pare Drop, China Stabilizes
`Murderous’ Yuan Rate Jolts Hong Kong as Top Currency Hub
Following The U.S Shale And Saudi Arabian Chess Match, Saudi Arabia Just Yelled ‘Checkmate’
China Car Sales Growth Slows Further
African Sunshine Can Now Be Bought and Sold on the Bond Market
Arch Coal Files for Bankruptcy in Latest Blow to U.S. Miners
Ford Chairman: ‘We Are In An Experimental Stage’
Airbus Beats Boeing in 2015 Order Race, Lags On Deliveries
Starbucks Plans Thousands of New Stores in China
The New Republic Is For Sale Again
China Tech Billionaire Buys Gay Dating App Grindr
Tinder Is Internally Ranking Its Users Based on ‘Desirability’
Why Corporate America Should Ditch the Script During Quarterly Earnings Calls
Joshua Brown: The Death of a Brokerage Firm
Roger Nusbaum: 2016 Opens With a Kick to the Throat
Be sure to follow me on Twitter.
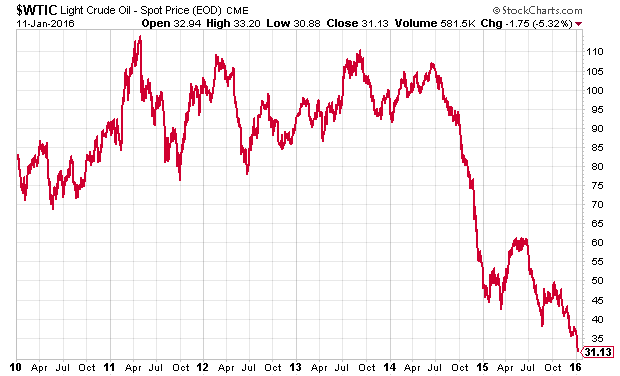
Oil at $31.13 per Barrel
Eddy Elfenbein, January 11th, 2016 at 6:21 pmIt’s not that oil is down — we know that. It’s that it keeps dropping. Today was another down day. Spot crude closed at $31.13.
The decline is simply remarkable. Some on Wall Street are talking about $20 oil.
New Small-Cap Low
Eddy Elfenbein, January 11th, 2016 at 12:04 pmThe Russell 2000 just dipped below its low from October 15, 2014. The index is at its lowest point since October 9, 2013.
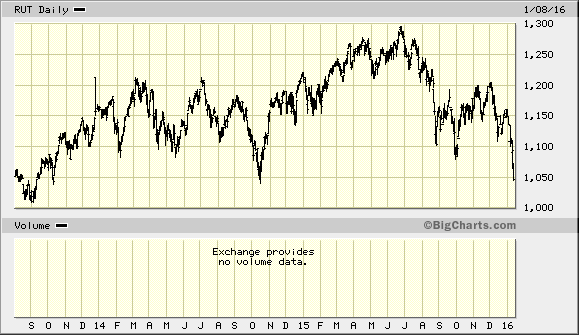
The Russell 2000’s relative performance against the S&P 500 peaked on March 4, 2014. It’s been downhill ever since.
Buy List Updates
Eddy Elfenbein, January 11th, 2016 at 9:46 amHere are a few news items from the past week about our Buy List stocks that I wanted to pass along:
Undervalued Pick of the Day: Stericycle
Alliance Data Announces New Stock Repurchase Program
Cerner Upgraded by RBC Capital Mkts
Wells Fargo Upgraded by Citigroup
Microsoft Stock Poised For Yet Another Winning Year
Is Microsoft CEO Nadella’s Turnaround Strategy Working?
Ford Changes Pension Reporting, Sees Rise in 2015 Profit
Looking at Market Correlations
Eddy Elfenbein, January 11th, 2016 at 8:35 amHere’s some data I’ve been working on that I thought I’d share with you. Below is a table showing the correlations of the daily changes of the 10 S&P 500 sectors. (I apologize for the crowded data.) I’ve also included the daily changes for the S&P 500 and for our Buy List. The data only covers calendar year 2015.
Date Ene Disc Spl Fin HC Ind Tech Mats Tele Utes S&P 500 BL Energy 60.3% 56.8% 65.2% 53.8% 69.1% 59.0% 79.2% 57.0% 38.6% 73.1% 65.0% Discretion. 60.3% 81.8% 86.6% 80.3% 85.7% 84.3% 74.4% 70.8% 49.7% 92.9% 91.6% Staples 56.8% 81.8% 80.8% 75.3% 83.9% 78.0% 70.4% 73.0% 63.8% 88.3% 85.7% Financials 65.2% 86.6% 80.8% 76.1% 87.7% 83.2% 77.3% 75.2% 46.5% 93.3% 91.9% Healthcare 53.8% 80.3% 75.3% 76.1% 76.4% 76.8% 67.2% 58.1% 47.9% 87.0% 84.0% Industrials 69.1% 85.7% 83.9% 87.7% 76.4% 86.0% 84.8% 76.0% 54.3% 94.2% 91.3% Tech 59.0% 84.3% 78.0% 83.2% 76.8% 86.0% 74.7% 71.2% 45.8% 92.6% 90.0% Materials 79.2% 74.4% 70.4% 77.3% 67.2% 84.8% 74.7% 67.0% 44.9% 84.8% 79.3% Telecom 57.0% 70.8% 73.0% 75.2% 58.1% 76.0% 71.2% 67.0% 52.2% 78.2% 74.7% Utilities 38.6% 49.7% 63.8% 46.5% 47.9% 54.3% 45.8% 44.9% 52.2% 56.6% 52.3% S&P 500 73.1% 92.9% 88.3% 93.3% 87.0% 94.2% 92.6% 84.8% 78.2% 56.6% 96.5% Buy List 65.0% 91.6% 85.7% 91.9% 84.0% 91.3% 90.0% 79.3% 74.7% 52.3% 96.5% A few things to note.
First is how strongly stocks are correlated with one another. At least in the near-term. Even a low daily correlation is around 60% or 70%. This means that just by being a stock, you’ll get tossed around with whatever the market’s doing that day. This is actually good news for stock-pickers because it means that good stocks can get knocked down with everything else, thereby creating good bargains. The shorter the time period, the greater the impact of the overall market.
I also think it’s interesting how the Industrials have the highest correlation with the broader S&P 500. I’ve noticed this in previous years as well. In other words, the Industrials stand out by being the most similar to everyone else.
Oddly, I find that this makes sense yet I’m not sure why. Perhaps it’s that the Industrials lie at the middle C of the economy. While sectors like Energy or Finance can diverge from the broader economy, the Industrials are unlikely to because…well, that is the economy. I’m not exactly sure, but it’s not due to size. Industrials are big but not the biggest.
But this also means that if you wanted to build a cheap-but-somewhat-decent index, you could probably use as few as five major industrial stocks. By this, I mean companies like DuPont or 3M. Sure, it would be far from perfect, but considering how small it is, it would be pretty darn good.
Naturally, over the short term, a stock will reflect the broader market and its sector. But as time goes on, the value specific to each company would gradually move to the surface and the higher categories would lose importance. On the table, you can see how strongly correlated the Buy List is with the S&P 500 on a daily basis, yet after 12 months, we had no trouble separating ourselves from the market last year.
It’s interesting to see sector relationships in the market. For example, Energy and Materials are often closely related, yet Materials are usually closer to Industrials than Energy is. Staples and Healthcare are often close, but not so much last year. Tech is often a lone wolf, not much correlated with anyone. In that regard, it’s the opposite of Industrials.
I suspect that the numbers on the table for Utilities are unusually low. Last year was probably an aberration for the Ute sector. Typically, I’d expect a higher correlation with defensive sectors like Staples and Healthcare.
Finally, don’t overthink this table. I think it’s interesting but only in the sense that it gives us a glimpse at how the market behaves. None of these correlations is stable. The major lesson is that a powerful market trend can carry off any stock.
-
Archives
- July 2026
- June 2026
- May 2026
- April 2026
- March 2026
- February 2026
- January 2026
- December 2025
- November 2025
- October 2025
- September 2025
- August 2025
- July 2025
- June 2025
- May 2025
- April 2025
- March 2025
- February 2025
- January 2025
- December 2024
- November 2024
- October 2024
- September 2024
- August 2024
- July 2024
- June 2024
- May 2024
- April 2024
- March 2024
- February 2024
- January 2024
- December 2023
- November 2023
- October 2023
- September 2023
- August 2023
- July 2023
- June 2023
- May 2023
- April 2023
- March 2023
- February 2023
- January 2023
- December 2022
- November 2022
- October 2022
- September 2022
- August 2022
- July 2022
- June 2022
- May 2022
- April 2022
- March 2022
- February 2022
- January 2022
- December 2021
- November 2021
- October 2021
- September 2021
- August 2021
- July 2021
- June 2021
- May 2021
- April 2021
- March 2021
- February 2021
- January 2021
- December 2020
- November 2020
- October 2020
- September 2020
- August 2020
- July 2020
- June 2020
- May 2020
- April 2020
- March 2020
- February 2020
- January 2020
- December 2019
- November 2019
- October 2019
- September 2019
- August 2019
- July 2019
- June 2019
- May 2019
- April 2019
- March 2019
- February 2019
- January 2019
- December 2018
- November 2018
- October 2018
- September 2018
- August 2018
- July 2018
- June 2018
- May 2018
- April 2018
- March 2018
- February 2018
- January 2018
- December 2017
- November 2017
- October 2017
- September 2017
- August 2017
- July 2017
- June 2017
- May 2017
- April 2017
- March 2017
- February 2017
- January 2017
- December 2016
- November 2016
- October 2016
- September 2016
- August 2016
- July 2016
- June 2016
- May 2016
- April 2016
- March 2016
- February 2016
- January 2016
- December 2015
- November 2015
- October 2015
- September 2015
- August 2015
- July 2015
- June 2015
- May 2015
- April 2015
- March 2015
- February 2015
- January 2015
- December 2014
- November 2014
- October 2014
- September 2014
- August 2014
- July 2014
- June 2014
- May 2014
- April 2014
- March 2014
- February 2014
- January 2014
- December 2013
- November 2013
- October 2013
- September 2013
- August 2013
- July 2013
- June 2013
- May 2013
- April 2013
- March 2013
- February 2013
- January 2013
- December 2012
- November 2012
- October 2012
- September 2012
- August 2012
- July 2012
- June 2012
- May 2012
- April 2012
- March 2012
- February 2012
- January 2012
- December 2011
- November 2011
- October 2011
- September 2011
- August 2011
- July 2011
- June 2011
- May 2011
- April 2011
- March 2011
- February 2011
- January 2011
- December 2010
- November 2010
- October 2010
- September 2010
- August 2010
- July 2010
- June 2010
- May 2010
- April 2010
- March 2010
- February 2010
- January 2010
- December 2009
- November 2009
- October 2009
- September 2009
- August 2009
- July 2009
- June 2009
- May 2009
- April 2009
- March 2009
- February 2009
- January 2009
- December 2008
- November 2008
- October 2008
- September 2008
- August 2008
- July 2008
- June 2008
- May 2008
- April 2008
- March 2008
- February 2008
- January 2008
- December 2007
- November 2007
- October 2007
- September 2007
- August 2007
- July 2007
- June 2007
- May 2007
- April 2007
- March 2007
- February 2007
- January 2007
- December 2006
- November 2006
- October 2006
- September 2006
- August 2006
- July 2006
- June 2006
- May 2006
- April 2006
- March 2006
- February 2006
- January 2006
- December 2005
- November 2005
- October 2005
- September 2005
- August 2005
- July 2005
 Eddy Elfenbein is a Washington, DC-based speaker, portfolio manager and editor of the blog Crossing Wall Street. His