Author Archive
-
Jose de la Vega’s Investing Rules
Eddy Elfenbein, June 7th, 2013 at 1:57 pmIn this week’s CWS Market Review, I used a quote from Jose de la Vega. Though he’s not well-known today, in 1688 he wrote the first important book on investing, Confusion of Confusions. In it, he outlined four basic rules on investing.
The first rule in speculation is: Never advise anyone to buy or sell shares. Where guessing correctly is a form of witchcraft, counsel cannot be put on airs.
The second rule: Accept both your profits and regrets. It is best to seize what comes to hand when it comes, and not expect that your good fortune and the favorable circumstances will last.
The third rule: Profit in the share market is goblin treasure: at one moment, it is carbuncles, the next it is coal; one moment diamonds, and the next pebbles. Sometimes, they are the tears that Aurora leaves on the sweet morning’s grass, at other times, they are just tears.
The fourth rule: He who wishes to become rich from this game must have both money and patience.
-
CA Technologies Breaks Out
Eddy Elfenbein, June 7th, 2013 at 12:00 pmCA Technologies ($CA), one of our quieter stocks, is breaking out today:
The stock cracked $28 yesterday and suddenly ran as high as $29.83 today.
-
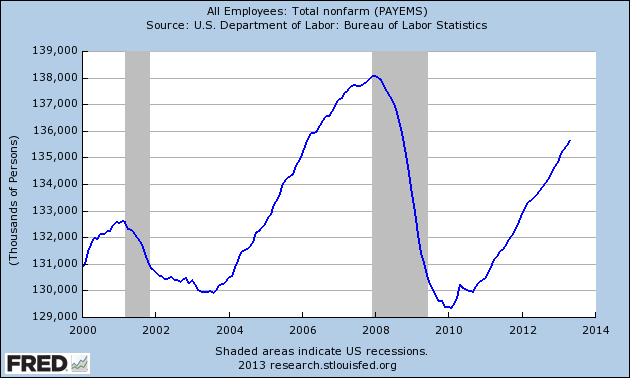
May NFP = +175K, Unemployment Rate = 7.6%
Eddy Elfenbein, June 7th, 2013 at 10:47 amThis morning’s jobs report showed that the U.S. economy created 175,000 jobs last month. The figure for March was revised higher by 4,000 while April was revised down by 12,000.
Despite signs of optimism from consumers, other indicators of the health of the job market have been mixed. Average weekly hours and average hourly earnings, for example, have shown little improvement in recent months, according to the Labor Department.
Job gains in May were concentrated in service sectors like professional and business services, retail, and food services and drinking places. That last category has added 337,000 jobs over the past year.
The federal government, on the other hand, lost 14,000 jobs in May, presumably a result of the across-the-board spending cuts, known as the sequester, implemented by Congress in March.
The only thing remotely interesting about this report is how close it is to the established trend. Over the last 32 months, NFP has averaged a gain of 178,000. The standard deviation has been just 67,000. In other words, we’re locked in a trend.
Officially, the unemployment rate rose from 7.5% in April to 7.6% for May. If you work out the decimals, it rose from 7.510% to 7.555%.
This is a pretty dull report. Still, the stock market is very pleased. So far, the S&P 500 is up about 1% to 1,640.
-
CWS Market Review – June 7, 2013
Eddy Elfenbein, June 7th, 2013 at 7:43 am“The expectation of an event creates a much deeper impression
on the exchange than the event itself.” – Jose de la Vega, 1688After countless predictions of its imminent demise, this year’s bull market is finally starting to show some cracks. On Thursday, the S&P 500 not only fell below its 50-day moving average, but also fell below 1,600 for the first time in a month. Fortunately, a strong afternoon push-back rally brought us back over 1,622, but traders are clearly getting nervous. The Volatility Index ($VIX) jumped 40% in just 12 trading days.
In this week’s CWS Market Review, we’ll take a closer look at what’s going on. I also want to preview some of our upcoming Buy List earnings reports. The turmoil in the broader market has actually been good for our Buy List which has outpaced the S&P 500 for nine of the last ten days, and we’re once again beating the index for the year. This would be our seventh year in a row of beating the market. Before I get to our portfolio, let’s look at what’s been causing the market so much grief lately.
Don’t Expect the Bond Selloff to Continue
What’s been unusual about 2013, at least until now, is that the stock market hasn’t had any major reversals. That’s not how previous years have played out. Despite the historic bull market, the S&P 500 had major drops in 2010, 2011 and 2012. Now we have a modest one: Measuring from the intra-day peak on May 22nd to Thursday’s low, the S&P 500 lost 5.27%. That’s the biggest break all year.
Here’s what’s happening. Since May 2nd, long-term interest rates have gapped up significantly. But what’s interesting is that shorter-term rates (inside of one year) haven’t moved much at all. The yield curve is essentially flat out to one year. If anything, short rates have edged slightly downward in the past three months.
One reason for the higher long-term rates is that the economy seems to be improving. The housing market, for example, is much better, and consumer confidence is on the upswing. With the improved economy, traders believe that Ben Bernanke and his pals at the Fed will ratchet down their bond-buying spree. “Taper” is the new buzzword on the Street.
I have to explain that moves in the bond market often foreshadow moves in the stock market. Usually, it’s by a few months, but sometimes it’s only a matter of weeks. Think of the two markets, stocks and bonds, as being in constant competition with each other for investors’ dollars. In just a few days, the yield on the 30-year Treasury has climbed from 2.8% to 3.3%, so that’s tempting to some folks who are getting a measly 2% yield out of the S&P 500.
Simultaneously, we’ve seen a gigantic boom in the Japanese stock market as the yen has plummeted against the dollar. The authorities in Japan are determined to boost their economy by getting some inflation going. I can’t judge if this will work, but their stock market responded. From November 13th to May 22nd, the Japanese Nikkei soared 80%. That’s an astounding gain. Since then, however, the Nikkei has given back 17%. The extreme volatility of the Japanese market seems to be causing some unease in the U.S. market.
After getting crushed by the dollar for several months, the Japanese yen finally struck back in a big way on Thursday. I suspect that this is traders anticipating a weak jobs report on Friday and therefore more aid from the Fed. The stronger yen is good news for AFLAC ($AFL), but I’ll stress that I like AFLAC because of its business and low valuation, not as a backdoor play on the yen. AFLAC remains a good buy up to $57 per share.
Despite the downturn in the bond market, I don’t believe it will last very long. While the economy is better, it’s still far from strong, and all the talk of the Fed’s tapering is premature. Frankly, I don’t see the Fed taking its foot off the pedal for the rest of this year. Expect to see bond yields go back down, although not to the mega-lows from last summer. In fact, bond yields have already dropped since their peak last Friday. I think the 10-year yield will soon drop below 2% again.
My advice to investors is to ignore any short-term market fluctuations. The next big event for us will be Q2 earnings season. We’ve now passed the first-quarter earnings season, and there are only three weeks left in the second quarter. If the analysts are right, we’re going to see even better earnings growth for Q2. Now let’s take a look at three of our off-cycle stocks that are due to report soon.
Oracle Is a Buy up to $38 per Share
Most of the Buy List stocks are on the March-June-September-December reporting cycle, but we have three stocks—Oracle, Bed Bath & Beyond and FactSet Research—that follow the February-May-August-November cycle. As a result, they’ll be reporting earnings later this month.
Oracle ($ORCL) wrapped up its fiscal year at the end of May, and the company is due to report its fiscal fourth-quarter earnings on June 20th. Frankly, the Q3 earnings report was a dud, and Oracle doesn’t do that very often. It seemed like half the analysts on Wall Street slashed their ratings on Oracle.
But the times when investors start to doubt Oracle are when the company’s at its best. To be fair, their results were weighed down by weakness in Europe. Oracle has said they expect Q4 earnings to range between 85 and 91 cents per share. Look for a big earnings beat here. Yes, their hardware business is not in a happy place, but I’m expecting software-license growth of 10%. Last week, I raised my Buy Below price to $38 per share. Oracle remains a very solid buy.
Buy Bed Bath & Beyond up to $73
Last month, I was excited to see Bed Bath & Beyond ($BBBY) crack $70 per share. That was a very nice turnaround for us, especially considering BBBY had been bouncing around the $55 mark earlier this year.
But over the past few weeks, BBBY has mostly flat-lined. On Wednesday, the stock got a nice bump from an upgrade by an analyst at Nomura. Aram Rubinson raised BBBY to “buy” from “neutral,” and lifted his price target to $82 from $72 per share. I detest the idea of price targets, but if he’s right, that’s a very nice rally from here.
Bed Bath & Beyond will report earnings again on June 26th. On the April conference call, the company told us to expect Q1 earnings to range between 88 and 94 cents per share. I expect the results to be at the high end of that range. I’m also expecting full-year earnings of $5 per share. Bed Bath & Beyond remains an excellent buy up to $73 per share.
FactSet Is a Very Good Buy Below $108
Last month, FactSet Research Systems ($FDS) boosted its quarterly dividend by 13% to 35 cents per share. I was pleased to see that, but FDS pays a very small amount of its profit out as dividends. On June 18th, the company will report earnings for the fiscal third quarter. FactSet has already said that earnings should be between $1.14 and $1.16 per share. Since that’s such a narrow range, I’ll take that as a strong hint they know what the results are.
I’m a little concerned that cost-cutting on Wall Street may take some growth off FDS, but they seem to be managing this well. Bear in mind that FactSet has increased its earnings for the last 16 years in a row. Not many companies can make that claim. FactSet is an excellent buy up to $108 per share.
Before I go, I have a few other comments. I expect to see a dividend increase soon from CR Bard ($BCR) and Medtronic ($MDT). The latter has raised its dividend every year for the last 35 years in a row. I also want to highlight that Microsoft ($MSFT) broke out to another five-year high this week. But don’t chase it. MSFT is a good buy up to $35 per share.
That’s all for now. Next week will be a slow news week for economic reports. On Thursday, we’ll get the report on retail sales. This is a good gauge for consumer strength. The most important report will come on Friday when the Federal Reserve releases its report on Industrial Production for May. The IP report for April was pretty weak, so it will be interesting to see if there was a rebound last month. Be sure to keep checking the blog for daily updates. I’ll have more market analysis for you in the next issue of CWS Market Review!
– Eddy
-
Morning News: June 7, 2013
Eddy Elfenbein, June 7th, 2013 at 7:03 amEurope Continues Wrestling With Online Privacy Rules
German Industrial Production Increases Most in a Year
Japan Public Pension Cuts Government Bond Weighting, Lifts Stocks
Hiring Seen Pointing To Economy In Need Of Fed’s Help
Feeling Like Gatsby? Net Worth Hits Another Record
Is an FHA Loan Still a Good Idea?
Is Big Data Turning Government Into ‘Big Brother’?
In Drive To Simplify, Facebook Will Ditch Half Its Ad Formats
Wal-Mart Board Seen at Risk of Losing Independent Voices
Apple to Yahoo Deny Providing Direct Access to Spy Agency
McDonald’s Testing New Late-Night Value Menu
Dimon, Other Wall St. Titans Make Time for Ma Ahead of Alibaba IPO
Forest Braces For Third Bout With Icahn
Cullen Roche: The One Chart That Bodes Very Poorly For Job Growth
Stone Street: Quick Observations on JOSB, GPS
Be sure to follow me on Twitter.
-
The S&P 500 Nears Its 50-DMA
Eddy Elfenbein, June 6th, 2013 at 12:10 pmThe S&P 500 has moved very close to its 50-day moving average. The 50-DMA is currently at 1,604.
-
Morning News: June 6, 2013
Eddy Elfenbein, June 6th, 2013 at 6:59 amEuro Rises to Four-Week High Before ECB Decision; Pound Advances
London Should Hand Libor Supervision to EU, Says Brussels
IMF Says Greece May Need Faster Debt Relief, Cites Own Mistakes
Yen Strengthens as Fed Easing Debate Intensifies; Aussie Slides
Financial Fears Gain Credence as Unrest Shakes Turkey
Fed Grants Foreign Banks Leeway in Dodd-Frank Swap Pushout Rule
SEC Unites Opponents on Money Fund Rule With Floating-Share Plan
How Rising Mortgage Rates Could Affect the Housing Recovery
ADP Report Shows 135,000 New Private-Sector Jobs
Entitlement Changes to Put Seniors at Financial Risk
PepsiCo in Talks to Buy SodaStream for $2 Billion
Microsoft And The FBI Are Teaming Up To Take Down A Global Cyber Crime Ring
Jeff Miller: The Most Expensive Investment Research is Free
Joshua Brown: Defending 15,000
Be sure to follow me on Twitter.
-
Biggest Selloff of the Year
Eddy Elfenbein, June 5th, 2013 at 12:23 pmSee that little spot of trouble in mid-April?
The recent drop just surpassed that as our biggest drop of the year. Measuring from the intra-day high to intra-day low, the S&P 500 lost 3.84% between April 12 and April 18.
On May 22, the S&P 500 reached a high of 1,687.18. So to have a larger drop than the one in April, the S&P 500 had to break below 1,622.41. We hovered just above that mark earlier this week. The Monday intra-day low was 1,622.72 and on Tuesday it was 1,623.62.
Today, however, is a different story. So far, the S&P 500 has been as low as 1,612.29. This is the the biggest drop of the year.
-
The Graham Number
Eddy Elfenbein, June 5th, 2013 at 11:25 amEver heard of the Graham Number? This was a formula developed by Ben Graham, the father of securities analysis, to determine the fair value for a stock.
The Graham Number is:
The square root of [earnings-per-share * book-value-per-share * 22.5]
(Take note that earnings-per-share divided by book-value-per-share is our good friend return on equity.)
Let’s run an example: Nicholas Financial ($NICK) earned $1.63 per share in the four quarters ending March 31, 2013. The book value per share is $10.46.
So…if we multiply $1.63 * $10.46 * $22.5, that gives us $383.62.
The square root of $383.62 gives us $19.59. So by the Graham Number, NICK is going for a hefty 25% discount to its fair value.
-
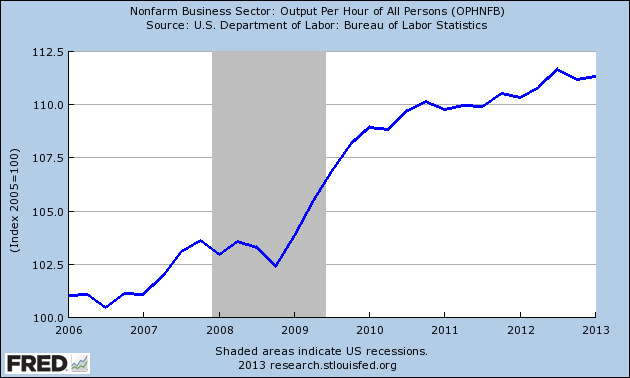
Q1 Productivity Revised Down to 0.5%
Eddy Elfenbein, June 5th, 2013 at 10:38 amThe productivity report for Q4 was terrible. Fortunately, productivity improved in Q1. The government’s initial report said that productivity rose by 0.7% for the first three months of the year. Today that was revised down to 0.5% growth.
-
Archives
- June 2026
- May 2026
- April 2026
- March 2026
- February 2026
- January 2026
- December 2025
- November 2025
- October 2025
- September 2025
- August 2025
- July 2025
- June 2025
- May 2025
- April 2025
- March 2025
- February 2025
- January 2025
- December 2024
- November 2024
- October 2024
- September 2024
- August 2024
- July 2024
- June 2024
- May 2024
- April 2024
- March 2024
- February 2024
- January 2024
- December 2023
- November 2023
- October 2023
- September 2023
- August 2023
- July 2023
- June 2023
- May 2023
- April 2023
- March 2023
- February 2023
- January 2023
- December 2022
- November 2022
- October 2022
- September 2022
- August 2022
- July 2022
- June 2022
- May 2022
- April 2022
- March 2022
- February 2022
- January 2022
- December 2021
- November 2021
- October 2021
- September 2021
- August 2021
- July 2021
- June 2021
- May 2021
- April 2021
- March 2021
- February 2021
- January 2021
- December 2020
- November 2020
- October 2020
- September 2020
- August 2020
- July 2020
- June 2020
- May 2020
- April 2020
- March 2020
- February 2020
- January 2020
- December 2019
- November 2019
- October 2019
- September 2019
- August 2019
- July 2019
- June 2019
- May 2019
- April 2019
- March 2019
- February 2019
- January 2019
- December 2018
- November 2018
- October 2018
- September 2018
- August 2018
- July 2018
- June 2018
- May 2018
- April 2018
- March 2018
- February 2018
- January 2018
- December 2017
- November 2017
- October 2017
- September 2017
- August 2017
- July 2017
- June 2017
- May 2017
- April 2017
- March 2017
- February 2017
- January 2017
- December 2016
- November 2016
- October 2016
- September 2016
- August 2016
- July 2016
- June 2016
- May 2016
- April 2016
- March 2016
- February 2016
- January 2016
- December 2015
- November 2015
- October 2015
- September 2015
- August 2015
- July 2015
- June 2015
- May 2015
- April 2015
- March 2015
- February 2015
- January 2015
- December 2014
- November 2014
- October 2014
- September 2014
- August 2014
- July 2014
- June 2014
- May 2014
- April 2014
- March 2014
- February 2014
- January 2014
- December 2013
- November 2013
- October 2013
- September 2013
- August 2013
- July 2013
- June 2013
- May 2013
- April 2013
- March 2013
- February 2013
- January 2013
- December 2012
- November 2012
- October 2012
- September 2012
- August 2012
- July 2012
- June 2012
- May 2012
- April 2012
- March 2012
- February 2012
- January 2012
- December 2011
- November 2011
- October 2011
- September 2011
- August 2011
- July 2011
- June 2011
- May 2011
- April 2011
- March 2011
- February 2011
- January 2011
- December 2010
- November 2010
- October 2010
- September 2010
- August 2010
- July 2010
- June 2010
- May 2010
- April 2010
- March 2010
- February 2010
- January 2010
- December 2009
- November 2009
- October 2009
- September 2009
- August 2009
- July 2009
- June 2009
- May 2009
- April 2009
- March 2009
- February 2009
- January 2009
- December 2008
- November 2008
- October 2008
- September 2008
- August 2008
- July 2008
- June 2008
- May 2008
- April 2008
- March 2008
- February 2008
- January 2008
- December 2007
- November 2007
- October 2007
- September 2007
- August 2007
- July 2007
- June 2007
- May 2007
- April 2007
- March 2007
- February 2007
- January 2007
- December 2006
- November 2006
- October 2006
- September 2006
- August 2006
- July 2006
- June 2006
- May 2006
- April 2006
- March 2006
- February 2006
- January 2006
- December 2005
- November 2005
- October 2005
- September 2005
- August 2005
- July 2005
 Eddy Elfenbein is a Washington, DC-based speaker, portfolio manager and editor of the blog Crossing Wall Street. His