Author Archive
-
The Dow By Presidential Election Cycle
Eddy Elfenbein, April 17th, 2013 at 11:32 amI recently downloaded all of the historical closing prices for the Dow Jones Industrial Average going back to 1896. That’s over 30,000 data points.
Today let’s take a look at how the Dow has performed over four-year presidential cycles. Below is what the average cycle looks like. I set the index to start at 100 at the beginning of the post-election year.
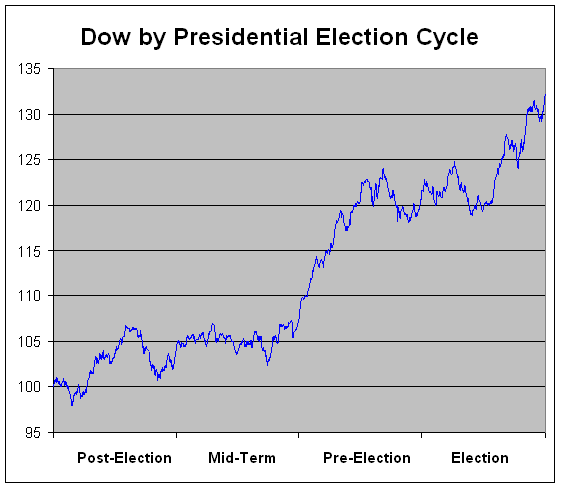
The cycle hits a rough patch beginning on August 4th of the post-election year (not too far away for us) and continues to September 30th of the mid-term. Over that span, the Dow loses an average of 4.1%.
But then things get much better. From September 30th of the mid-term until September 7th of the pre-election year, the Dow has rallied for an average gain of 21.2%. That means that nearly two-thirds of the Dow’s entire gain over four years has come in a little less than one year.
After that, the Dow slumps again. From September 7th of the pre-election year until July 24th of the election year, the Dow drops an average of 3.2%. Then things get better again. From July 24th to the end of the year, the Dow gains an average of 10.2%. If we stretch that rally until August 4th of the post-election, back to where we started, the Dow gains 17.7% in a little over one year.
After that, the Dow historically hasn’t done much of anything during the election year until July 24th. From September 7th of the pres-election year until July 24th of the election year, the Dow has lost an average of 3.2%. After that, the Dow races for a 10% rally by the end of the year (that’s a little over four months). If we stretch that rally until August 4th of the pre-election year, where we started, the Dow jumps 17.7% in a little over one year.
So we have four nearly equal periods of one year each—two bull runs and two bears.
-
Morning News: April 17, 2013
Eddy Elfenbein, April 17th, 2013 at 7:41 amThe Market Is Flashing Signs Of ‘Deep Instability’
Cyprus Finance Minister Sees Gold Sale Within Next Months
Tesco to Exit U.S. After First Profit Drop in About 20 Years
Gold Wipes $560 Billion From Central Banks as Equities Rally
Harvard Duo Defend Case For Austerity
Bank of America Earnings Rise, but Fall Short of Forecasts
Intel’s Profit Falls 25%; Outlook Less Dire
Goldman CFO: 1st-Quarter Activity Levels Mixed as Quarter Progressed
In Dell Deal, Curbing One Skewed Incentive Creates Another
J&J Earnings Beat Analyst Estimates on Sales of New Drugs
Mattel Profit Soars on Strong American Girl Sales
Macy’s Wins Temporary Bar on Some Penney Stewart Sales
Thermo Fisher to Pay $13.6b For Calif. Firm
Cullen Roche: Bernstein: The Fed Will be Behind the Curve When It’s Time to Tighten
John Hempton: Mt Gox, Bitcoin, Hordes of Chaos, Demons and Armies of Orcs…
Be sure to follow me on Twitter.
-
The Attraction of Gold
Eddy Elfenbein, April 16th, 2013 at 9:25 pmI wanted to say a few things about people who invest in gold. There are some people, not all, who are quite simply unreasonably attracted to gold. They make Goldfinger look like an amateur.
Maybe one day some cognitive scientist will find a connection between our brains and gold. For whatever reason, gold has dazzled men for millennia.
For example, gold NEVER rusts. I mean never! You can take the gold out of an Egyptian pyramid and stick it in your cavity (though you might want to clean it first). It’s also non-toxic which helps.
Gold is incredibly soft. One ounce can be stretched for 50 miles. It can be pounded down to a few MILLIONTHS of an inch thickness.
Gold is very heavy. Despite what you see in the Treasure of the Sierra Madre (“Badges? We ain’t got no badges!”), gold dust wouldn’t have blown away.
Gold has been found on every continent on earth. Gold has also had strong religious connections. It’s mentioned in the Bible more than 400 times. Marx writes of commodity fetishism, which is meant to have a religious connotation. And I won’t even get into Freud’s talk of the psychological connection of gold to feces (no, I’m not making this up).
When Moses came down from Sinai with the Ten Suggestions, the Jews were making a golden calf to worship. God instructed Moses to overlay a sanctuary for him in pure gold. In other words, gold had its bases covered—it was on both sides!
Plato mentions the gold/silver ratio to be 12. Recent historical evidence suggests that Isaac Newton was mainly an alchemist. The other stuff he did was just playing around on the side, and was probably an offshoot of his efforts to makes gold. Pieces of his hair have traces of lead and mercury.
Newton was also Master of the Mint and inadvertently put England in the gold standard. This means that one of the greatest geniuses in human history was also a civil servant who made economic policy based on a forecast. A forecast that was dead wrong.
There’s more gold at the New York Fed, waaaay below 33 Liberty Street, than in Fort Knox. Gold is also a really good conductor. So despite its high prices, it’s used in many electronics.
Earlier I mentioned Goldfinger. The Ian Fleming book was published in 1959. The plot (made into a classic 1964 movie) featured a crazy idea -– to blow up all of the U.S. gold at Fort Knox, making it radioactive and worthless. That would make Auric Goldfinger’s gold worth more. But here’s the odd part — he didn’t need to stage all that drama to make money. If he had just held on to his gold for 20 years, it would have been worth 25 times as much.
I highly recommend Peter Bernstein’s The Power of Gold: The History of an Obsession
-
The First Black Friday
Eddy Elfenbein, April 16th, 2013 at 12:48 pm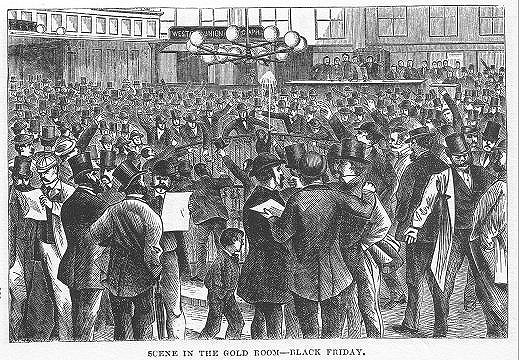
If you got slammed by gold’s sudden drop over the past couple of days, take comfort in the fact that things have been worse. Much worse.
In 1869, Ulysses Grant was in the White House. The government was struggling with massive domestic debt, incurred by four years of civil war and subsequent efforts at Southern reconstruction. To raise money for these expenditures, the Treasury had issued vast quantities of “greenbacks” (paper currency), which Grant promised to redeem for gold as soon as was practical. This he then proceeded to do: over the course of some six months at the start of his administration, the government paid out its gold reserves little by little, thus easing the debt while keeping the price of the precious metal under tight control. If the government wanted the price of gold to go down, it released more of its holdings; if it wanted it to go up, it paid out less.
Enter two unscrupulous speculators, Jay Gould and James Fisk. Their scheme was to corner the gold market by means of insider information. They reasoned that if they could find out beforehand exactly what the Treasury was planning to do as regards the gold supply, they would be able to buy up the yellow metal when the price was low and then sell when it was high. This would not only net them huge profits but also drive up the rate of traffic by wheat farmers on the Erie Railroad, of which Gould was president. Both men were well versed in incestuous economic dealings; both were very much in league with Boss Tweed’s Tammany Hall, and Gould would later post bond when Tweed was indicted.
But to pull it all off, they needed a hook. This was provided in the form of Abel Corbin, Grant’s brother-in-law. It’s not clear whether Corbin fully knew what the pair was up to, but he nonetheless served as their point of entry to the Oval Office, where they tried to persuade Grant to tip his hand regarding the government’s gold policy. This Grant, to his credit, refused to do. But Gould and Fisk now seemed, in the eyes of the financial community, to have the president’s ear. Thus when they started buying up large quantities of gold in early September 1869, prices spiked.
The one to put a stop to these shenanigans was George Boutwell, Grant’s Secretary of the Treasury. Honest and intelligent, he quickly saw through Fisk and Gould’s scam and approved the sale of $4 million worth of government gold to lower prices. Grant, too, realized what was up and told his brother-in-law to cut ties with his sketchy partners. But thieves’ honor prevailed, and Corbin tipped off Gould, who then was able to sell off his gold before the market crashed. Fisk, too, escaped serious economic damage, even though Gould omitted to tell him the news. The only one screwed was Corbin—together with grain farmers (whose prices fell 50%), stockholders (the market lost 20% in a single week), and countless ordinary Americans (who found themselves out of work in the ensuing economic turmoil). On Black Friday, September 24, 1869, gold prices went from a high of $162 to a low of $133 in a matter of hours.
What became of Gould and Fisk? Neither was prosecuted, thanks to a good lawyer and support from Tammany Hall. Gould went on to a glorious career as a railroad and communications magnate; Fisk was shot dead in an argument over a prostitute a few years later. As for Grant, his name was permanently besmirched: the years of his administration were branded ¨The Era of Good Stealings.¨
-
The Dow’s Average Return by Day of Year
Eddy Elfenbein, April 16th, 2013 at 12:06 pmAs I mentioned before, I crunched all of the Dow’s daily closings for the last 117 years. Today, let’s take a look at the Dow’s return by Day of the Year.
This chart shows what the Dow does, on average, throughout the year. To make things clearer, I began the chart at 100 as the start of the year.
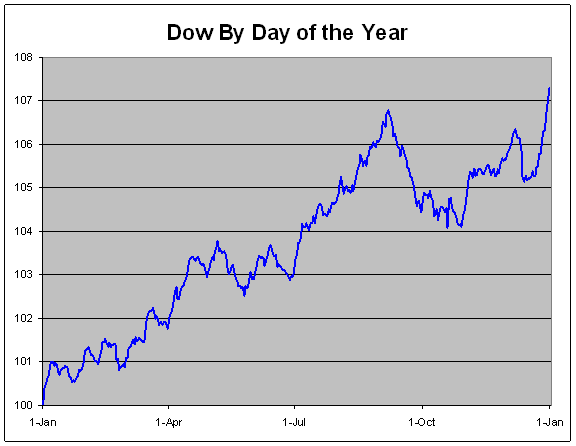
There’s an old Wall Street saying that investors ought to “sell in May and go away.” Well, there does appear to be some truth to that. From May 6th to October 29th, the Dow has gained, on average, only 0.3%. That’s just shy of half the year. For the other half, the Dow has gained an average of 6.96%.
For the worst part of the year for the Dow, we can zero in the stretch from September 6th to October 29th. Over that span, the Dow has lost an average of 2.51%. I re-ran the numbers to see where the market’s early September peak was in relation to Labor Day. The answer is that it comes on the Wednesday immediately following Labor Day. After that, the market has had a tendency to slide for the next seven weeks.
The best brief period of the year for the Dow has been the famous Santa Claus rally. From December 21st to January 7th, the Dow has gained an average of 2.91%. That’s pretty impressive when you consider that makes up 40% of the Dow’s annual gain, yet it comes in just half a month, and that includes two holidays.
Just to be clear, these numbers don’t include dividends. Also, I don’t believe there’s any advantage for investors in trading around these events. I just think it’s fascinating that after 117 years, some definite patterns have evolved.
-
This Is What Gold’s Been Saying
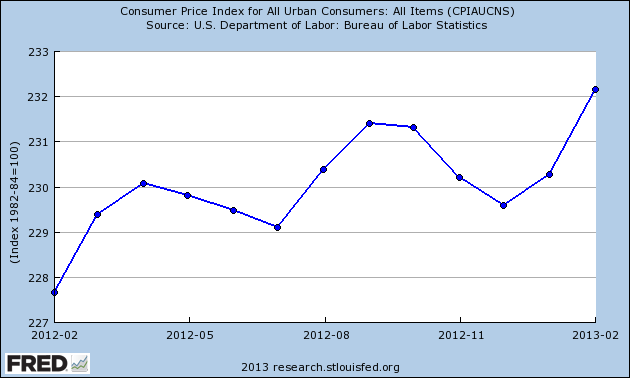
Eddy Elfenbein, April 16th, 2013 at 11:08 amToday’s inflation report confirms what the gold market has been saying — there are deflationary pressures in the economy. After a blip up in February, consumer prices fell in March.
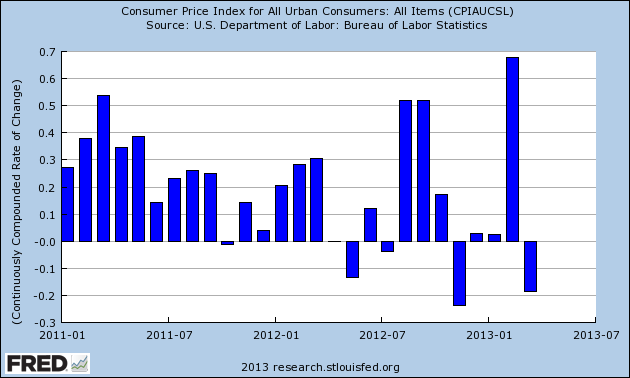
The message is that real interest rates are too high.
The stock market is gaining back some ground today after yesterday’s plunge. Gold is also making up some lost ground, but it’s still around $1,390 an ounce.
Of the major stocks, Coke ($KO) is doing especially well after a good earnings report. Shares of Microsoft ($MSFT) have been very steady at $28.60 or so since the stock dropped last Thursday. The company will report earnings later this week.
-
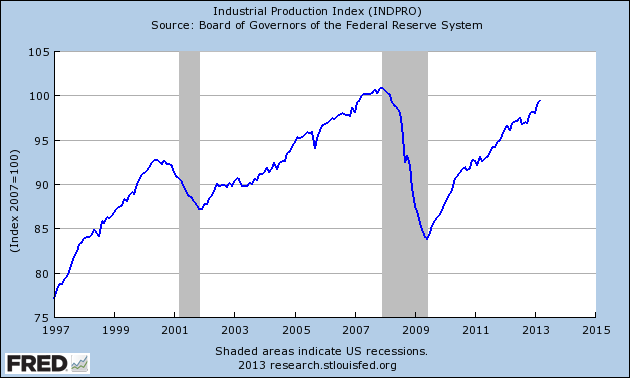
March Industrial Production Rose 0.4%%
Eddy Elfenbein, April 16th, 2013 at 10:46 amWe got more promising economic news this morning. The government reported that industrial production rose by 0.4% last month. While total production was up, factory production unexpectedly dropped by 0.1%.
The median estimate for total industrial production of the 82 economists surveyed by Bloomberg called for a 0.2 percent gain. Projections ranged from a drop of 0.5 percent to an increase of 0.7 percent. The prior month was revised up to a 1.1 percent increase from a previously reported 0.8 percent advance.
Manufacturing, which makes up 75 percent of total production and accounts for about 12 percent of the economy, was restrained by declines in production last month of metals, computers, electrical equipment and furniture.
One of the bright spots in March was auto making. The output of motor vehicles and parts increased 2.9 percent after a 2 percent gain a month earlier, today’s report showed. Excluding autos and parts, manufacturing production dropped 0.3 percent, the biggest decline since October, after a 0.8 percent rise.
Cars and light trucks sold at a 15.2 million annual pace in March, capping the strongest three months for purchases since early 2008, data from Ward’s Automotive Group showed.
Here’s the chart on industrial production. There are two things to notice: the index hasn’t yet reached a new peak, and the index correlates very well with the economic cycle.
-
Morning News: April 16, 2013
Eddy Elfenbein, April 16th, 2013 at 7:44 amItaly Seizes Nomura Assets Linked to Siena Bank Inquiry
ZEW April Investor Confidence Dropped More Than Forecast
In Surprise, Recovery in China Loses Steam
South Korea Unveils Fiscal Package to Support Growth
Carbon Falls Most Ever After EU Parliament Rejects Surplus Fix
Emerging-Market Stocks Slide Most Since July on China
Homebuilder Confidence in U.S. Unexpectedly Dropped in April
Central Banks at Ease Limit Risk Political Backlash
Dish Network announces $25.5 billion bid for Sprint Nextel
Intel Pressure Grows As CEO Question Looms
U.S. Bancorp First-Quarter Profit Rises 6.7%, Matches Estimates
Penney Has Some Persuading to Do
Drug Makers Use Safety Rule to Block Generics
Credit Writedown: A Reality Check On German Household Wealth
Howard Lindzon: Financial Tragedies Are Always Telegraphed…Gold, Apple and The Next Crash
Be sure to follow me on Twitter.
-
Why Is Gold Falling?
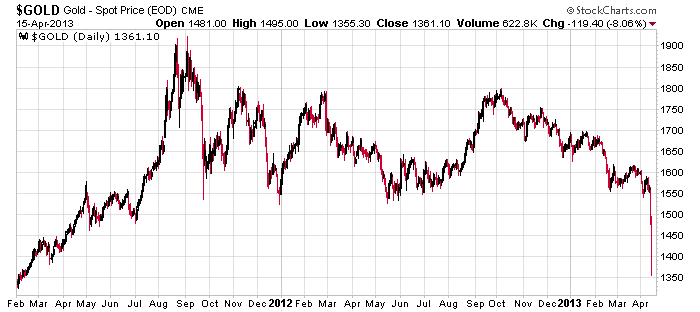
Eddy Elfenbein, April 15th, 2013 at 6:39 pmThe price of gold was smashed on Friday and again today. Gold for June delivery fell 9.3% today to close at $1,361.10 per ounce. That was gold’s biggest fall since March 27, 1980. Silver, often called “poor man’s gold,” fell 11% to $23.36 an ounce, it’s lowest price in two-and-a-half years.
So what’s behind the dramatic plunge? My view is that gold responds to real short-term interest rates. In this case, I don’t believe traders expect a Fed rate increase soon. Instead, I think they’re hinting that deflation is acting up, and that’s causing real rates to rise.
So real rates are rising in that nominal rates are stable but prices are falling. Gasoline prices, for example, have been falling recently and it’s possible they’ll soon hit a two-year low.
Tomorrow the government will release the CPI report for March. Consumer prices were unexpectedly strong in February. Prior to that, prices had been pretty flat, and there was even a downtrend late last year.
-
Ugly Day In Many Ways
Eddy Elfenbein, April 15th, 2013 at 5:12 pmThe S&P 500 closed down 2.3% today. This was the biggest drop in five months. The Morgan Stanley Cylical Index fell 3.91% to 1,117.76.
There was a big split today between large- and small-cap stocks. The Russell 2000 fell 3.78%, while the S&P 100 dropped 2.06%. There was a 51 basis point difference between the Dow and S&P 500 today. The Dow was down 1.79%.
Gold was absolutely demolished today. This charts shows you how bad the damage was:
-
Archives
- June 2026
- May 2026
- April 2026
- March 2026
- February 2026
- January 2026
- December 2025
- November 2025
- October 2025
- September 2025
- August 2025
- July 2025
- June 2025
- May 2025
- April 2025
- March 2025
- February 2025
- January 2025
- December 2024
- November 2024
- October 2024
- September 2024
- August 2024
- July 2024
- June 2024
- May 2024
- April 2024
- March 2024
- February 2024
- January 2024
- December 2023
- November 2023
- October 2023
- September 2023
- August 2023
- July 2023
- June 2023
- May 2023
- April 2023
- March 2023
- February 2023
- January 2023
- December 2022
- November 2022
- October 2022
- September 2022
- August 2022
- July 2022
- June 2022
- May 2022
- April 2022
- March 2022
- February 2022
- January 2022
- December 2021
- November 2021
- October 2021
- September 2021
- August 2021
- July 2021
- June 2021
- May 2021
- April 2021
- March 2021
- February 2021
- January 2021
- December 2020
- November 2020
- October 2020
- September 2020
- August 2020
- July 2020
- June 2020
- May 2020
- April 2020
- March 2020
- February 2020
- January 2020
- December 2019
- November 2019
- October 2019
- September 2019
- August 2019
- July 2019
- June 2019
- May 2019
- April 2019
- March 2019
- February 2019
- January 2019
- December 2018
- November 2018
- October 2018
- September 2018
- August 2018
- July 2018
- June 2018
- May 2018
- April 2018
- March 2018
- February 2018
- January 2018
- December 2017
- November 2017
- October 2017
- September 2017
- August 2017
- July 2017
- June 2017
- May 2017
- April 2017
- March 2017
- February 2017
- January 2017
- December 2016
- November 2016
- October 2016
- September 2016
- August 2016
- July 2016
- June 2016
- May 2016
- April 2016
- March 2016
- February 2016
- January 2016
- December 2015
- November 2015
- October 2015
- September 2015
- August 2015
- July 2015
- June 2015
- May 2015
- April 2015
- March 2015
- February 2015
- January 2015
- December 2014
- November 2014
- October 2014
- September 2014
- August 2014
- July 2014
- June 2014
- May 2014
- April 2014
- March 2014
- February 2014
- January 2014
- December 2013
- November 2013
- October 2013
- September 2013
- August 2013
- July 2013
- June 2013
- May 2013
- April 2013
- March 2013
- February 2013
- January 2013
- December 2012
- November 2012
- October 2012
- September 2012
- August 2012
- July 2012
- June 2012
- May 2012
- April 2012
- March 2012
- February 2012
- January 2012
- December 2011
- November 2011
- October 2011
- September 2011
- August 2011
- July 2011
- June 2011
- May 2011
- April 2011
- March 2011
- February 2011
- January 2011
- December 2010
- November 2010
- October 2010
- September 2010
- August 2010
- July 2010
- June 2010
- May 2010
- April 2010
- March 2010
- February 2010
- January 2010
- December 2009
- November 2009
- October 2009
- September 2009
- August 2009
- July 2009
- June 2009
- May 2009
- April 2009
- March 2009
- February 2009
- January 2009
- December 2008
- November 2008
- October 2008
- September 2008
- August 2008
- July 2008
- June 2008
- May 2008
- April 2008
- March 2008
- February 2008
- January 2008
- December 2007
- November 2007
- October 2007
- September 2007
- August 2007
- July 2007
- June 2007
- May 2007
- April 2007
- March 2007
- February 2007
- January 2007
- December 2006
- November 2006
- October 2006
- September 2006
- August 2006
- July 2006
- June 2006
- May 2006
- April 2006
- March 2006
- February 2006
- January 2006
- December 2005
- November 2005
- October 2005
- September 2005
- August 2005
- July 2005
 Eddy Elfenbein is a Washington, DC-based speaker, portfolio manager and editor of the blog Crossing Wall Street. His