Author Archive
-
Morning News: April 2, 2013
Eddy Elfenbein, April 2nd, 2013 at 6:31 amUnemployment in Euro Zone Reaches a Record High of 12 Percent
Cypriots Feel Betrayed by European Union
Chinese Factories Rise But U.S. Manufacturing Slows
Abe Says BOJ May Miss Price Target If Global Economy Changes
Low-Cost Drugs in Poor Nations Get a Lift in Indian Court
Stockman Sundown Belied by Stocks Showing Morning for Investors
Nasdaq to Buy Treasurys Platform for Up to $1.23 Billion
Raw-Material Bull Market Fading as Supply Expands
Airlines Rejected by Top Court on Price Advertising Rules
Apple CEO Cook Apologizes for China IPhone Warranties
A $25 Million Question Over a Bid for Dell
Glencore Pushes Back Xstrata Deal Due To China Probe
Wal-Mart Customers Complain Bare Shelves Are Widespread
Roger Nusbaum: Barron’s Picks Up A Random Roger Theme?
John Hempton: Cupid PLC’s Strange Balance Sheet
Be sure to follow me on Twitter.
-
The Stock Market Since 1925
Eddy Elfenbein, April 1st, 2013 at 1:37 pmI just got the latest edition of the Ibbotson SBBI Yearbook. This is a well-known resource for investors which covers the long-term data on stocks, bonds, bills and inflation. Over the next few days, I’ll post some of the charts from the updated yearbook.
I’m always a bit leery of studies of long-term market returns, especially when the study goes into the 19th century. The idea of a stock market that the average consumer can participate in is a relatively recent phenomenon.
Here’s a chart of the stock market’s return since 1825. The red line is capital gains, the blue is dividends and the black is both together. After 188 years, one dollar turned into more than $4.2 million; annualized, that comes to 8.45%. Of that, 5.02% is from dividends and 3.27% is from capital gains.
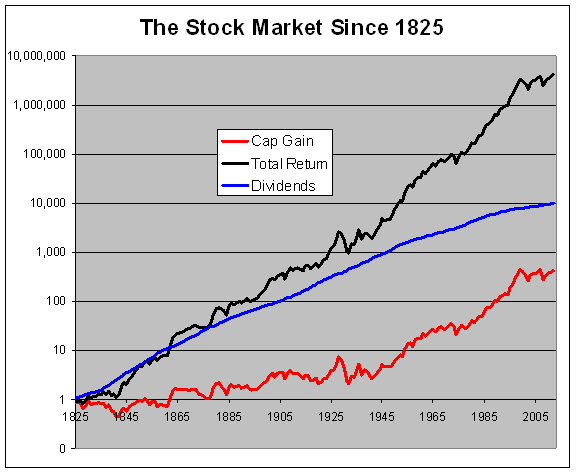
Before the bull market of the 1920s, the stock market was almost entirely one of dividends. You’d buy a stock near its par value (usually $100) and wait for the board of directors to declare the dividend each year—and that was the stock market.
Think of it this way: during the last third of the 19th century, inflation fell by about 2% per year on average. If you were getting a stock that paid 5% per year in dividends and had zero capital appreciation, you were basically matching long-term real returns. That idea is very foreign to modern investors, but that’s how things worked back then. The idea of steadily rising capital gains is not a constant.
The phrase “this time is different” is often mocked but the bull market of the 1920s really did permanently change the market from one that focused on dividends to one that focused on capital gains.
Another concern I have is that using this long-term data creates overly optimistic expectations. I doubt that the extraordinary success of the United States over the past 180 years is easily repeatable. Even in the more recent past, I think the era of post-World War II prosperity was a one-off deal.
-
Dividends Continue to Rise
Eddy Elfenbein, April 1st, 2013 at 11:25 amThe dividend numbers are in for the first quarter and the S&P 500 paid out $7.954 per share (that’s an index-adjusted figure). This was a 12.2% increase over the first quarter of 2012 and it marks the ninth-straight quarter that dividends have grown by double digits.
Due to tax reasons, there was a surge of dividends in Q4. Dividends rose more than 22.7% over the fourth-quarter of 2011, but I’m glad to see that the dividend trend still continues. For the last four quarters, the S&P 500 has paid out $32.112. At 2%, that comes to 1,605.60.
Here’s a look at the S&P 500 (in blue, left scale) and its dividend (in black, right scale). The two lines are scaled at a ratio of 50-to-1 so whenever the lines cross, the market’s dividend yield is exactly 2%.

What I find interesting is that this latest bull market seems much more solid than the previous two, especially the tech boom of the late 1990s. Dividends have been rising quite steadily. Except for the worst part of the financial crisis, the S&P 500 has mostly had a dividend yield of about 2% for the last 10 years.
-
Weak ISM Leads the Market Lower
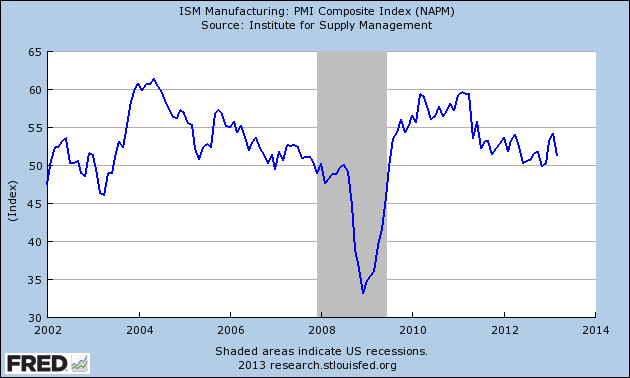
Eddy Elfenbein, April 1st, 2013 at 11:01 amThe market is down so far this morning (and month and quarter). The March ISM came in at 51.3 which is down from February’s surprisingly strong 54.2.
Any reading above 50 indicates that the manufacturing sector is expanding. Below 50 means it’s shrinking. Forty-three of the last 44 months have been above 50.0. Although today’s ISM is weaker than expected, today’s report is still well above the danger zone.
-
Morning News: April 1, 2013
Eddy Elfenbein, April 1st, 2013 at 6:08 amAs Banks in Cyprus Falter, Other Tax Havens Step In
Russia Won’t Help Out Cyprus Depositors, Says Minister
Lira Bonds Worst Performer as Policy Confuses: Turkey Credit
Pessimism Declines Among Japan’s Big Manufacturers, Survey Shows
China Manufacturing Expands at Faster Pace, PMI Gauges Show
China’s Urbanization Drive Leaves Migrant Workers Out In The Cold
Michael Dell Said to Consider Blackstone LBO Only With CEO Guarantee
Drug Maker Novartis Loses India Patent Battle
E-Commerce Companies Bypass the Middlemen
What The Rise Of Bitcoin Teaches Us About Money
Discovery Expands Its Reach Overseas
Insider Case Against SAC Manager May Be Tough To Prove
Edward Harrison: Buiter: ‘It Was Clear That Cyprus Was A Laboratory’
Jeff Miller: Weighing The Week Ahead: Signs Of Another Economic Soft Patch?
Be sure to follow me on Twitter.
-
The Howling Fat Men of the Coen Brothers
Eddy Elfenbein, March 29th, 2013 at 3:41 pm -
First-Quarter Market Performance
Eddy Elfenbein, March 29th, 2013 at 2:31 pmHere’s how different sectors performed during the first quarter of 2013. I also included the S&P 500 Total Return.
Sector Market Cap (bil) Index Q1 Gain Energy $1,526 583.98 9.57% Materials $480 247.52 4.17% Industrials $1,413 361.89 10.08% Cons Disc $1,625 420.27 11.76% Cons Staples $1,532 410.47 13.77% Health Care $1,752 533.42 15.22% Financials $2,226 245.41 10.92% Info Tech $2,519 483.34 4.21% Telecom Svc $415 158.01 8.20% Utilities $490 198.69 11.84% S&P 500 $13,979 1,569.19 10.03% S&P 500 Total Return 2,770.05 10.61% CWS Market Review – March 29, 2013
Eddy Elfenbein, March 29th, 2013 at 7:42 am“See, the stock market only deals in facts, in reality, in reason, and the
stock market is never wrong. Traders are wrong.” – Jesse LivermoreLadies and gentlemen, it finally happened. Write down this date: Thursday, March 28, 2013, A.D. That’s the day the S&P 500 finally (finally!) closed at a new all-time high. The official close was 1,569.19, which breaks the old record of 1,565.15 set on October 9, 2007. That was 1,997 days ago. It’s hard to believe that it took us five-and-a-half years to get back to the peak of the bubble. Of course, maybe we’re lucky. The Dow didn’t break its 1929 peak for more than a quarter of a century.
Now that the first quarter is on the books, our Buy List gained 8.01%, which trails the S&P 500’s gain of 10.02% (dividends not included). I’m happy with the gain, but my competitive spirit doesn’t like losing to the market. We’ve beaten the market for six years in a row, and I’m confident we will do so again in 2013. As always, patience and discipline are our keys. Speaking of which, later on I’ll talk about DirecTV ($DTV), which suddenly sprang to life after traders ignored a blow-out earnings report.
Measured from its low close on March 9th, 2009, the S&P 500 has now gained an amazing 131.95%. If we include dividends, investors have made 152.96%, and our Buy List has done ever better. Over the last two weeks, the index had a heck of a frustrating time lurching past the goal line. On seven of the ten days before Thursday, the S&P 500 had gotten above 1,560 during the day but had never broken 1,565. Early in the day on Thursday, the S&P 500 even went up to 1,565.14, just a measly 0.01 away from the previous high, before retreating. We didn’t break though the magic market number until about 30 minutes before the close. I should add that trading volume has been pretty tame this week. I think a lot of traders are getting a head start on the three-day weekend.
In this week’s CWS Market Review, I want to take a look at the upcoming first-quarter earnings season. For several months, analysts have been paring back on their forecasts for Q1, but we’ll get to see the results soon. Investors need to understand that earnings season is Judgment Day for Wall Street, and that’s when we learn who’s been performing well and who hasn’t.
What to Expect This Earnings Season
The market is closed on Friday for Good Friday, so that means that Thursday was the final trading day of the first quarter. Overall, it was a very good quarter for the stock market. I’m pleased to say that T.S. Eliot had it wrong. Far from being the cruelest month, April has been pretty good for investors. The Dow has risen for the last seven Aprils in a row. Let’s hope we can make it eight, but that will depend on earnings season.
According to the numbers from S&P, Wall Street expects the S&P 500 to report earnings of $25.51 for the first quarter. Just to be clear, that’s the index-adjusted number (every point in the S&P 500 is worth about $8.9 billion).
Nine months ago, Wall Street was expecting earnings of $27.71 for Q1. It’s interesting that the market has climbed more than 15% since then, even though earnings estimates are 7% lower. I think this is less due to the market’s overvaluation of today and more because of the big undervaluation of last summer. If you recall, traders were extremely nervous about events in Europe. You can really see how much Mr. Draghi’s famous promise to “do whatever it takes to preserve the euro” comment changed the market’s sentiment.
If Wall Street’s forecast is correct, then Q1 earnings will represent an increase of 5.2% from the first quarter of 2012. It will also break the two-quarter streak of profit declines. Lakshman Achuthan of the Economic Cycle Research Institute got a lot of attention recently when he made a bold forecast that the U.S. is in a recession. Achuthan was criticized by most sensible analysts and I, too, think he’s way off base. But one of his reasons was that back-to-back quarters of earnings decline often line up with recessions. Well, it looks like this time will be an exception.
The earnings outlook appears to be changing. Wall Street currently expects earnings to accelerate for the rest of this year, meaning the rate of growth will itself increase. I continue to be a bit skeptical of exactly how strong this re-acceleration will be. A lot of this depends on our friends from Europe. Some areas are already showing improvement. Right now, the analyst community expects full-year earnings for the S&P 500 of $111.16. That would be a healthy 14.80% increase over 2012. Furthermore, the Street expects the S&P 500 to rake in $124.77 for 2014, which would be a 12.24% increase over this year. Breaking out some math, this means that the S&P 500 is going for just over 12.5 times next year’s earnings. That’s quite attractive, compared with a 10-year Treasury that fetches you a puny 1.85%.
This favorable math isn’t exactly a secret. Over the past few days, some of the big-name firms on Wall Street have been raising their year-end targets for the S&P 500. Bull markets tend to do that. Morgan Stanley just raised their target from 1,434 to 1,600. Goldman raised their target by 50 points to 1,625. Deutsche Bank increased theirs from 1,600 to 1,625.
Of the ten S&P 500 sectors, the largest growth is expected to come from the financials. Profits for the financials are expected to rise by 19.08%, which is more than double their closest rival (consumer discretionary at 6.52%). This is good news for our financial stocks like JPMorgan ($JPM) and Wells Fargo ($WFC). Wall Street expects JPM to report earnings of $1.38 per share, which is a 16% increase over last year’s Q1. Remember, of course, that JPMorgan has made a nice habit of trouncing Wall Street’s forecasts. For last year’s Q2, they beat analysts by more than 70%! The Street expects 88 cents per share from Wells, which would be a 17.3% increase over last year. Both WFC and JPM remain very good buys.
Buy DirecTV up to $59 per Share
In mid-February, DirecTV ($DTV) had a great earnings report. The satellite TV company crushed earnings by 42 cents per share. Unfortunately, traders were spooked by an earnings charge due to the currency devaluation in Venezuela. I thought that was pretty minor stuff, but it was enough to bring the stock down below $48 per share. I’ll never understand traders. DTV’s earnings report was about as good as it could be. Sure enough, once all the suckers got cleared out, the stock started to rally. The shares also got a bump after the company wisely pulled out of the bidding for Vivendi’s Brazilian division. Now we’re sitting on a rather nice gain. On Thursday, DTV got as high as $57.64. DirecTV continues to be an excellent stock. I’m raising my Buy Below to $59 per share.
Before I go, I want to name some of the stocks that look especially good on our Buy List. First is Harris ($HRS). Its solid dividend is ideal for conservative investors. HRS is a buy up to $53. Bed Bath & Beyond ($BBBY) continues to look very good. The home-furnishings store will report earnings on April 9th. That will be for their important fourth quarter, which ends in February. I’m raising my Buy Below on BBBY to $65. There’s no news on Nicholas Financial ($NICK). Don’t be alarmed by the volatility here. Traders are going on absolutely nothing. I’ll let you know once there’s real news. Let me put in a final word for boring old Microsoft ($MSFT). Business is improving, and the 3.2% yield ain’t bad. MSFT is a solid buy up to $30.
That’s all for now. Remember, the stock market is closed on Good Friday, and Monday is the start of Q2. Next week, we’ll get a look at the ISM report for March. The report for February was surprisingly good. The ADP jobs report will come out on Wednesday. Then, next Friday, the government releases its big jobs report. Wall Street forecasts that 185,000 jobs were created in March. Be sure to keep checking the blog for daily updates. I’ll have more market analysis for you in the next issue of CWS Market Review!
– Eddy
Morning News: March 29, 2013
Eddy Elfenbein, March 29th, 2013 at 7:20 amCyprus President Confident Crisis ‘Is Contained’
Norms on Baguette Size to Windows Choking France, Report Says
Japan’s Jobless Rate Up To 4.3%; Prices, Manufacturing Fall
Cyberattacks Seem Meant to Destroy, Not Just Disrupt
Economy Up 0.4% in Fourth Quarter
Jobless Claims Rise, But GDP Data Shows More Growth
U.S. Clean-Gasoline Rule Opposed by Oil Group Said Near
Amazon Buys Book-Recommendation Site Goodreads
Sprint Nears a U.S. Deal to Restrict China Gear
Amazon, Overstock Lose Challenge to N.Y. Web Sales Tax
Underappreciated Consumer Stars In S&P 500 Rally
Should the Government Finance New-Energy Technologies?
Is Steven A. Cohen Buying Off The U.S. Government?
Joshua Brown: The Lurkers of Wall Street
Phil Pearlman: 2nd Quarter Outlook: Waiting for Godot…
Be sure to follow me on Twitter.
We’re an All-Time High
Eddy Elfenbein, March 28th, 2013 at 4:01 pm1,569.02.
-
Archives
- June 2026
- May 2026
- April 2026
- March 2026
- February 2026
- January 2026
- December 2025
- November 2025
- October 2025
- September 2025
- August 2025
- July 2025
- June 2025
- May 2025
- April 2025
- March 2025
- February 2025
- January 2025
- December 2024
- November 2024
- October 2024
- September 2024
- August 2024
- July 2024
- June 2024
- May 2024
- April 2024
- March 2024
- February 2024
- January 2024
- December 2023
- November 2023
- October 2023
- September 2023
- August 2023
- July 2023
- June 2023
- May 2023
- April 2023
- March 2023
- February 2023
- January 2023
- December 2022
- November 2022
- October 2022
- September 2022
- August 2022
- July 2022
- June 2022
- May 2022
- April 2022
- March 2022
- February 2022
- January 2022
- December 2021
- November 2021
- October 2021
- September 2021
- August 2021
- July 2021
- June 2021
- May 2021
- April 2021
- March 2021
- February 2021
- January 2021
- December 2020
- November 2020
- October 2020
- September 2020
- August 2020
- July 2020
- June 2020
- May 2020
- April 2020
- March 2020
- February 2020
- January 2020
- December 2019
- November 2019
- October 2019
- September 2019
- August 2019
- July 2019
- June 2019
- May 2019
- April 2019
- March 2019
- February 2019
- January 2019
- December 2018
- November 2018
- October 2018
- September 2018
- August 2018
- July 2018
- June 2018
- May 2018
- April 2018
- March 2018
- February 2018
- January 2018
- December 2017
- November 2017
- October 2017
- September 2017
- August 2017
- July 2017
- June 2017
- May 2017
- April 2017
- March 2017
- February 2017
- January 2017
- December 2016
- November 2016
- October 2016
- September 2016
- August 2016
- July 2016
- June 2016
- May 2016
- April 2016
- March 2016
- February 2016
- January 2016
- December 2015
- November 2015
- October 2015
- September 2015
- August 2015
- July 2015
- June 2015
- May 2015
- April 2015
- March 2015
- February 2015
- January 2015
- December 2014
- November 2014
- October 2014
- September 2014
- August 2014
- July 2014
- June 2014
- May 2014
- April 2014
- March 2014
- February 2014
- January 2014
- December 2013
- November 2013
- October 2013
- September 2013
- August 2013
- July 2013
- June 2013
- May 2013
- April 2013
- March 2013
- February 2013
- January 2013
- December 2012
- November 2012
- October 2012
- September 2012
- August 2012
- July 2012
- June 2012
- May 2012
- April 2012
- March 2012
- February 2012
- January 2012
- December 2011
- November 2011
- October 2011
- September 2011
- August 2011
- July 2011
- June 2011
- May 2011
- April 2011
- March 2011
- February 2011
- January 2011
- December 2010
- November 2010
- October 2010
- September 2010
- August 2010
- July 2010
- June 2010
- May 2010
- April 2010
- March 2010
- February 2010
- January 2010
- December 2009
- November 2009
- October 2009
- September 2009
- August 2009
- July 2009
- June 2009
- May 2009
- April 2009
- March 2009
- February 2009
- January 2009
- December 2008
- November 2008
- October 2008
- September 2008
- August 2008
- July 2008
- June 2008
- May 2008
- April 2008
- March 2008
- February 2008
- January 2008
- December 2007
- November 2007
- October 2007
- September 2007
- August 2007
- July 2007
- June 2007
- May 2007
- April 2007
- March 2007
- February 2007
- January 2007
- December 2006
- November 2006
- October 2006
- September 2006
- August 2006
- July 2006
- June 2006
- May 2006
- April 2006
- March 2006
- February 2006
- January 2006
- December 2005
- November 2005
- October 2005
- September 2005
- August 2005
- July 2005
 Eddy Elfenbein is a Washington, DC-based speaker, portfolio manager and editor of the blog Crossing Wall Street. His