-
Bed Bath & Beyond Earned $1.12 in Q4
Posted by Eddy Elfenbein on April 6th, 2011 at 4:25 pmWow! Bed Bath & Beyond ($BBBY) had an outstanding earnings report for the fourth quarter. The company earned $1.12 per share which was much higher than their earlier guidance of 91 cents to 95 cents per share. It was also much higher than I had been expecting. Sales rose 11.6% to $2.505 billion.
For the fiscal year ended February 26, 2011, the Company reported net earnings of $3.07 per diluted share ($791.3 million), an increase of approximately 33% over net earnings of $2.30 per diluted share ($600.0 million) a year ago. Net sales for fiscal 2010 were approximately $8.759 billion, an increase of approximately 11.9% from net sales of approximately $7.829 billion in the prior fiscal year. Comparable store sales for fiscal 2010 increased by approximately 7.8%, compared with an increase of approximately 4.4% last year.
For fiscal 2011, the Company is modeling net earnings per diluted share to be approximately $.58 to $.61 for the fiscal first quarter and to increase by approximately 10% to 15% for the full year.
Bed Bath & Beyond earned 52 cents per share in last year’s Q1, so today’s forecast translates to a growth rate of 11.5% to 17.3%.
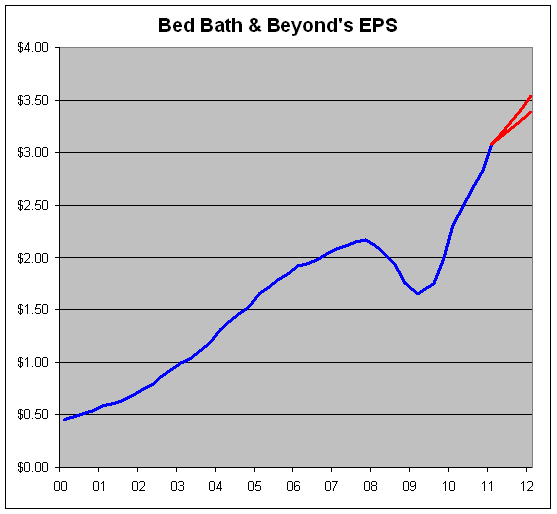
If earnings grow this year at a 10% to 15% rate, that comes out to a full-year forecast of $3.38 to $3.53 per share. Wall Street had been expecting $3.33 per share.
Year-over-year operating margins and net margins have increased for eight straight quarters. Here’s BBBY’s trailing four-quarter EPS, with the company’s forecast in red.
Here’s a look at BBBY’s quarterly numbers for the past few years:
Quarter Sales Gross Profit Operating Profit Net Profit EPS May-99 $356,633 $146,214 $28,015 $17,883 $0.06 Aug-99 $451,715 $185,570 $53,580 $33,247 $0.12 Nov-00 $480,145 $196,784 $50,607 $31,707 $0.11 Feb-00 $569,012 $238,233 $77,138 $48,392 $0.17 May-00 $459,163 $187,293 $36,339 $23,364 $0.08 Aug-00 $589,381 $241,284 $70,009 $43,578 $0.15 Nov-01 $602,004 $246,080 $64,592 $40,665 $0.14 Feb-01 $746,107 $311,802 $101,898 $64,315 $0.22 May-01 $575,833 $234,959 $45,602 $30,007 $0.10 Aug-01 $713,636 $291,342 $84,672 $53,954 $0.18 Nov-02 $759,438 $311,030 $83,749 $52,964 $0.18 Feb-02 $879,055 $370,235 $132,077 $82,674 $0.28 May-02 $776,798 $318,362 $72,701 $46,299 $0.15 Aug-02 $903,044 $370,335 $119,687 $75,459 $0.25 Nov-03 $936,030 $386,224 $119,228 $75,112 $0.25 Feb-03 $1,049,292 $443,626 $168,441 $105,309 $0.35 May-03 $893,868 $367,180 $90,450 $57,508 $0.19 Aug-03 $1,111,445 $459,145 $155,867 $97,208 $0.32 Nov-04 $1,174,740 $486,987 $161,459 $100,506 $0.33 Feb-04 $1,297,928 $563,352 $231,567 $144,248 $0.47 May-04 $1,100,917 $456,774 $128,707 $82,049 $0.27 Aug-04 $1,273,960 $530,829 $189,108 $120,008 $0.39 Nov-05 $1,305,155 $548,152 $190,978 $121,927 $0.40 Feb-05 $1,467,646 $650,546 $283,621 $180,980 $0.59 May-05 $1,244,421 $520,781 $150,884 $98,903 $0.33 Aug-05 $1,431,182 $601,784 $217,877 $141,402 $0.47 Nov-06 $1,448,680 $615,363 $205,493 $134,620 $0.45 Feb-06 $1,685,279 $747,820 $304,917 $197,922 $0.67 May-06 $1,395,963 $590,098 $148,750 $100,431 $0.35 Aug-06 $1,607,239 $678,249 $219,622 $145,535 $0.51 Nov-07 $1,619,240 $704,073 $211,134 $142,436 $0.50 Feb-07 $1,994,987 $862,982 $309,895 $205,842 $0.72 May-07 $1,553,293 $646,109 $154,391 $104,647 $0.38 Aug-07 $1,767,716 $732,158 $211,037 $147,008 $0.55 Nov-08 $1,794,747 $747,866 $203,152 $138,232 $0.52 Feb-08 $1,933,186 $799,098 $259,442 $172,921 $0.66 May-08 $1,648,491 $656,000 $118,819 $76,777 $0.30 Aug-08 $1,853,892 $739,321 $187,421 $119,268 $0.46 Nov-08 $1,782,683 $692,857 $136,374 $87,700 $0.34 Feb-09 $1,923,274 $785,058 $231,282 $141,378 $0.55 May-09 $1,694,340 $666,818 $142,304 $87,172 $0.34 Aug-09 $1,914,909 $773,393 $222,031 $135,531 $0.52 Nov-09 $1,975,465 $812,412 $245,611 $151,288 $0.58 Feb-10 $2,244,079 $955,496 $370,741 $226,042 $0.86 May-10 $1,923,051 $775,036 $225,394 $137,553 $0.52 Aug-10 $2,136,730 $874,918 $296,902 $181,755 $0.70 Nov-10 $2,193,755 $896,508 $305,110 $188,574 $0.74 Feb-10 $2,504,967 $1,076,467 $461,052 $283,451 $1.12 -
The Middies Rule!
Posted by Eddy Elfenbein on April 6th, 2011 at 12:48 pmHere’s something odd. The top-performing size category has been the mid-caps.
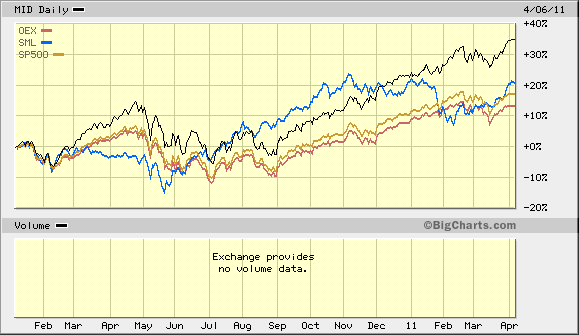
On the chart below, the black line is the S&P 400 Mid-Cap Index ($MID). The middies have outpaced the blue line which is the S&P 600 Small-Cap Index ($SML). The monster-cap S&P 100 ($OEX) in red trails everyone.
I say that this is odd because the middies are rarely at the extreme. They can usually been found mid-way between whatever the large-caps and small-caps are doing.
-
Trading Volume at Citigroup
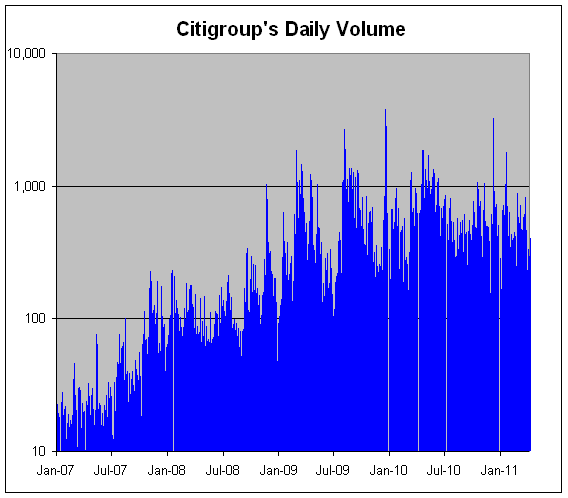
Posted by Eddy Elfenbein on April 6th, 2011 at 11:17 amIf you ever want to check some insane numbers on Wall Street, look at trading volume for Citigroup ($C). This is the usually the most-traded stock each day. The trading volume isn’t just high, it’s amazingly high.
There are two main reasons for Citi’s huge volume. One is that the share price is low (currently $4.51, though it once was $57) and the other is that Citi has 29 billion shares outstanding. This makes Citi a favorite for day traders and high-frequency traders.
Average daily volume for Citi usually runs around 500 million shares. Since the financial crisis broke, Citi’s volume has topped one billion shares in a single day 60 times. Last December, when the government said it was ditching the last of its Citi stock, the total volume topped 3.2 billion in a single day. Over a trading day, that’s an average of 140,000 shares per second.
The trading bonanza must come to a close soon as Citi said it will have a 1-for-10 reverse stock split. This means that shareholders will have one-tenth as many shares but the price will increase by ten-fold.
I’ll be curious to see if trading volume drops by far more than one-tenth. I bet it will.
-
Rising Inflation Expectations
Posted by Eddy Elfenbein on April 6th, 2011 at 10:29 amOne of the criticisms we hear from bearish investors is that the Federal Reserve has set us up for massive inflation. Personally, I tend to be pragmatic on these issues. If there is inflation coming, it’s certainly hiding itself well. While commodity prices are on the rise, we have yet to see a large surge in consumer prices. That may change soon.
But I’m not concerned with the political implications of inflation — hyper or not. I’m much more concerned with inflation’s impact on equity prices.
The danger of inflation is that it hurts bond prices and that, in turn, hurts stock valuations. Generally speaking, inflation doesn’t impact the stock market until it reaches a 5% annualized rate.
Once inflation passes 5%, stocks have historically been lousy investments. The only thing worse than inflation is deflation. What the market likes best is a low, boring rate of inflation.
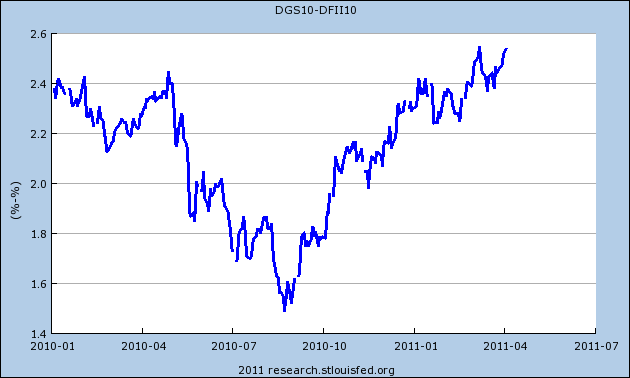
One of the goals of the Fed’s policies has been to increase the market’s inflation expectations. The chart below shows the spread between the yield on the 10-year Treasury bond and the yield on the 10-year TIPs. In other words, this is the market’s view on the inflation premium.Since last summer when the Fed announced QE2, the inflation premium has risen about 100 basis points. That’s a big rise. According to the market, however, inflation is far from being problem. For now.
I’m not always willing to accept the market’s judgment as correct. I find it very curious that the market doesn’t see much acceleration in the inflation premium.
While the spread between the 10-year Treasury and the 10-year TIPs is about 256 basis points, at five years, it’s only 232 basis points. That means the market expects inflation of 2.32% for the next five years and then 2.8% for the five years after that. That seems very optimistic.
-
Morning News: April 6, 2011
Posted by Eddy Elfenbein on April 6th, 2011 at 7:26 amEuro Appreciates Before ECB Rates Meeting; Yen Falls on BOJ Stimulus Bets
Basel Develops Method to Identify Banks Posing Systemic Risk
European Central Bank: This Time, Politicians Content With Rate Rise
Toyota May Be Downgraded by Moody’s After Japan Earthquake
Contrarian Adding Bets in Mideast
Gold Climbs to Record in ‘Flight to Safety’ as Silver Reaches 31-Year Peak
Bernanke Faces Possible Fed Split on Maintaining Stimulus
Treasurys Rise Amid Debate On Fed; FDIC Rule Adds To Buying
Global Miner Rio Tinto Secures 49.49% Stake in $4 Billion Bid for Riversdale Mining
Pringles: Once a Great Flop, Now Sold for Billions
Dish Network Wins Blockbuster Auction With $320 Million Bid
Commerzbank to Repay $20.4 Billion of German Bailout
Chambers Vows ‘Fix’ as Cisco Stumbles
Sbarro Files for Chapter 11 Protection
Joshua Brown: So Many Black Swans that Only the White Ones are Rare
-
Nicholas Financial Opens Two New Branches
Posted by Eddy Elfenbein on April 5th, 2011 at 11:05 amHere’s the latest press release:
Nicholas Financial, Inc. today announced the opening of two (2) new branch offices located in St. Louis, Missouri and Villa Park, IL, a Chicago area suburb. The new offices are Nicholas Financial’s first entries in both major metropolitan areas and continues the Company’s planned expansion of its branch office network, which now includes, fifty-six (56) offices in Florida, Alabama, Georgia, Kentucky, Indiana, Maryland, Michigan, North Carolina, Ohio, South Carolina, Tennessee, Virginia, Illinois and Missouri.
Nicholas employees have been working to develop business in each area for several months prior to the opening of the new locations. Each of the offices is a full-service lending and collection facility. Nicholas Financial acquires and services automobile and light truck installment sales finance contracts that it purchases from new and used car dealers.
According to Douglas Marohn, Senior Vice President, “We are reaping rewards from the performance of our branch business model in the Midwest. We intend to add additional branches in our new Missouri and Illinois markets as soon as they can be developed. Our success in Ohio, Michigan and Indiana has convinced us that the opportunity for successful growth in these markets is excellent.”
NICK’s business is traditionally heavily weighted towards Florida. The company is somewhat limited in its ability to expand since state laws vary on permissible chargeable interest.
-
Oracle’s Weighting Will Double in Nasdaq 100
Posted by Eddy Elfenbein on April 5th, 2011 at 10:27 amThe Nasdaq 100 Index ($QQQ) is one of the most important indexes for tech investors. The index represents the 100 largest non-financial stocks on the Nasdaq. One of the problems with the Nasdaq 100 is that Apple ($AAPL), which I believe is some sort of fruit company, currently represents more than one-fifth of the entire index.
Such a heavy weighting isn’t good for any index and it’s greatly disproportionate to Apple’s market value. As a result, the Nasdaq has announced that it’s rebalancing the Nasdaq 100.
This rebalancing will shift Apple’s weighting from 20.49% to 12.33%. This will have a big impact on the market since tons of ETFs own Apple, and the $QQQ ETF is one of the most popular investments on Wall Street.
While Apple will be a big loser in the rebalancing, one of the big winners will be our very own Oracle ($ORCL). The Nasdaq 100’s weighting for Oracle will more than double from 3.3% to 6.7%. You can see the full details of the rebalancing here.
-
Morning News: April 5, 2011
Posted by Eddy Elfenbein on April 5th, 2011 at 7:14 amWhat’s Next for Singapore and the ASX?
China Raises Interest Rates to Counter Inflation Pressure
Moody’s Cuts Portugal, Says Bailout Needed Urgently
The Bank of Japan Answers The Trillion Dollar Question: What Is Causing The Commodity Rally?
Oil Declines for First Day in Four on Qaddafi Ouster Plan Report, Supplies
Silver Hits Fresh Peak In Asia; Gold Edges Higher
Dollar Strengthens Versus Euro on Bernanke Inflation Preparedness Comment
Geithner Sees ‘Severe Hardships’ If Debt Limit Isn’t Raised
Nasdaq Rebalance to Cut Apple’s Weighting
Texas Instruments Bets $6.5 Billion That Sales Force Can Stoke National Semiconductor’s Growth
The Antitrust Noose Is Tightening Around Google’s Neck
Buffett’s Ruthlessness Is Oddly Absent on Sokol
In Race With Groupon, LivingSocial Raises $400 Million
-
Buy List +9.19% YTD
Posted by Eddy Elfenbein on April 4th, 2011 at 10:53 pmToday was another outstanding day for our Buy List. We gained 0.71% today compared with just 0.03% for the S&P 500. We’re now up 9.19% for the year to the S&P 500’s 5.98%. This is a pretty impressive run we’ve been on: we’ve beaten the S&P 500 for eight of the last nine days.
Ford ($F) got a big lift today thanks to an analyst upgrade from Credit Suisse. Bespoke notes that the stock is back above its 50-day moving average. Ford got as high as $15.74 today which is the highest level since February 18th. The next earnings report should be out in about three weeks.
Shares of Oracle ($ORCL), Deluxe ($DLX) and Leucadia (LUK) hit new 52-week highs today. Oracle got as high as $34.43 today. The stock seems to be experiencing a delayed positive surge from its recent earnings report.
I was happy to see Reynolds American ($RAI) briefly get over $36 per share. AFLAC ($AFL) closed today at $54.35 which is a post-quake high.
Remember that on Wednesday, the Bed Bath & Beyond ($BBBY) earnings report comes out. I’m not looking for spectacular earnings, but I’ll be very curious to hear what guidance they offer.
-
The Small-Cap Surge
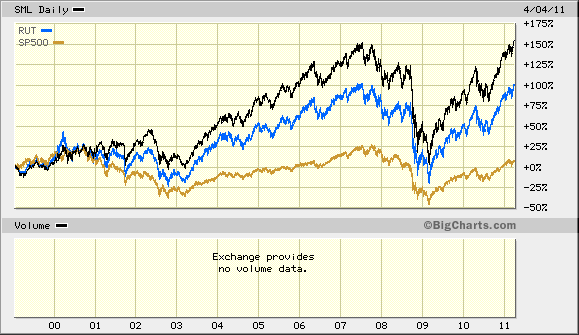
Posted by Eddy Elfenbein on April 4th, 2011 at 10:42 amI said that one of the effects of the Fed’s QE2 program is that it would cause investors to favor riskier assets. For example, they would favor stocks over bonds; and within stocks, they would favor riskier sectors like small-caps.
On Friday, the S&P Small-Cap 600 ($SML) broke 450 for the first time ever. In July 2007, the index reach an all-time intra-day high of 445.82.
The Russell 2000 ($RUT) broke above 850 which is just shy of its July 2007 high of 856.48. If the Nasdaq had kept pace with the Russell 2000, it would be over 7,300 today.
-
Archives
- October 2026
- September 2026
- August 2026
- July 2026
- June 2026
- May 2026
- April 2026
- March 2026
- February 2026
- January 2026
- December 2025
- November 2025
- October 2025
- September 2025
- August 2025
- July 2025
- June 2025
- May 2025
- April 2025
- March 2025
- February 2025
- January 2025
- December 2024
- November 2024
- October 2024
- September 2024
- August 2024
- July 2024
- June 2024
- May 2024
- April 2024
- March 2024
- February 2024
- January 2024
- December 2023
- November 2023
- October 2023
- September 2023
- August 2023
- July 2023
- June 2023
- May 2023
- April 2023
- March 2023
- February 2023
- January 2023
- December 2022
- November 2022
- October 2022
- September 2022
- August 2022
- July 2022
- June 2022
- May 2022
- April 2022
- March 2022
- February 2022
- January 2022
- December 2021
- November 2021
- October 2021
- September 2021
- August 2021
- July 2021
- June 2021
- May 2021
- April 2021
- March 2021
- February 2021
- January 2021
- December 2020
- November 2020
- October 2020
- September 2020
- August 2020
- July 2020
- June 2020
- May 2020
- April 2020
- March 2020
- February 2020
- January 2020
- December 2019
- November 2019
- October 2019
- September 2019
- August 2019
- July 2019
- June 2019
- May 2019
- April 2019
- March 2019
- February 2019
- January 2019
- December 2018
- November 2018
- October 2018
- September 2018
- August 2018
- July 2018
- June 2018
- May 2018
- April 2018
- March 2018
- February 2018
- January 2018
- December 2017
- November 2017
- October 2017
- September 2017
- August 2017
- July 2017
- June 2017
- May 2017
- April 2017
- March 2017
- February 2017
- January 2017
- December 2016
- November 2016
- October 2016
- September 2016
- August 2016
- July 2016
- June 2016
- May 2016
- April 2016
- March 2016
- February 2016
- January 2016
- December 2015
- November 2015
- October 2015
- September 2015
- August 2015
- July 2015
- June 2015
- May 2015
- April 2015
- March 2015
- February 2015
- January 2015
- December 2014
- November 2014
- October 2014
- September 2014
- August 2014
- July 2014
- June 2014
- May 2014
- April 2014
- March 2014
- February 2014
- January 2014
- December 2013
- November 2013
- October 2013
- September 2013
- August 2013
- July 2013
- June 2013
- May 2013
- April 2013
- March 2013
- February 2013
- January 2013
- December 2012
- November 2012
- October 2012
- September 2012
- August 2012
- July 2012
- June 2012
- May 2012
- April 2012
- March 2012
- February 2012
- January 2012
- December 2011
- November 2011
- October 2011
- September 2011
- August 2011
- July 2011
- June 2011
- May 2011
- April 2011
- March 2011
- February 2011
- January 2011
- December 2010
- November 2010
- October 2010
- September 2010
- August 2010
- July 2010
- June 2010
- May 2010
- April 2010
- March 2010
- February 2010
- January 2010
- December 2009
- November 2009
- October 2009
- September 2009
- August 2009
- July 2009
- June 2009
- May 2009
- April 2009
- March 2009
- February 2009
- January 2009
- December 2008
- November 2008
- October 2008
- September 2008
- August 2008
- July 2008
- June 2008
- May 2008
- April 2008
- March 2008
- February 2008
- January 2008
- December 2007
- November 2007
- October 2007
- September 2007
- August 2007
- July 2007
- June 2007
- May 2007
- April 2007
- March 2007
- February 2007
- January 2007
- December 2006
- November 2006
- October 2006
- September 2006
- August 2006
- July 2006
- June 2006
- May 2006
- April 2006
- March 2006
- February 2006
- January 2006
- December 2005
- November 2005
- October 2005
- September 2005
- August 2005
- July 2005
 Eddy Elfenbein is a Washington, DC-based speaker, portfolio manager and editor of the blog Crossing Wall Street. His