-
Good Day for Us and New High for Oracle
Posted by Eddy Elfenbein on January 20th, 2011 at 7:46 pmAlthough the market was down today, it was another good day for us. The Buy List rose 0.47% compared with a loss of 0.13% for the S&P 500. The weakness in cyclicals definitely helped us as sectors like healthcare were strong.
For the year, we’re up 3.57% which is nearly twice the 1.80% for the S&P 500.
Oracle (ORCL), JPMorgan Chase (JPM) and Jos. A. Banks (JOSB) all climbed by more than 2% today. Oracle reached a new 52-week high.
Yesterday, JPM seemed to be hurt by Goldman’s earnings report which makes little sense since they already reported earnings. Today, JPM was helped by Goldman’s earnings which again, makes very little sense.
-
The Streak Ends
Posted by Eddy Elfenbein on January 20th, 2011 at 5:01 pmIt was very close, but the S&P 500 finally closed below its 10-DMA. The index closed the day at 1,280.26. The average for the last 10 day is 1,280.97. That ends a run of 34-straight sessions of closing above the 10-DMA.

-
The Cyclical Trade Breaks Down
Posted by Eddy Elfenbein on January 20th, 2011 at 12:40 pmAfter having a tremendous run, the cyclical trade is breaking down in a big way. This will most likely be the seventh day in a row that cyclical stocks have underperformed the S&P 500.
Smaller stocks have a semi-strong relationship to cyclical stocks and we saw that the Russell 2000 Index got creamed yesterday, falling by more than 2.5%.
Here’s a look at the Morgan Stanley Cyclical Index (^CYC) divided by the S&P 500 (blue line, left scale), along with the Russell 2000 (^RUT) divided by the S&P 500 (black line, right scale):

The cyclicals have had a great rally for nearly two years, so taking some time to rest is to be expected. I don’t know yet if this is merely a pause or if it’s the beginning of a long-term downtrend. The thing about cyclicals is that the market itself is cyclical. This means that cyclicals generally outperform a rising market and underperform a falling one. It’s a double-whammy effect.
Our Buy List doesn’t have a strong cyclical component. In fact, one of the reasons why I added Ford (F) was to beef up our exposure to cyclicals. Although Ford has gotten hit the past two days, I’m still glad I added it.
-
The Economist Looks at Momentum
Posted by Eddy Elfenbein on January 20th, 2011 at 9:05 amThe Economist highlights one of my favorite topics—momentum investing. Many studies have shown that once a stock gets going in one direction, the chances are very good that it will keep going. This is something that any practitioner can tell you is obviously true, yet it conflicts with how academics prefer to see the market:
What goes up must come down. It is natural to assume that the law of gravity should also apply in financial markets. After all, isn’t the oldest piece of investment advice to buy low and sell high? But in 2010 European investors would have prospered by following a different rule. Anyone who bought the best-performing stocks of the previous year would have enjoyed returns more than 12 percentage points higher than someone who bought 2009’s worst performers.
This was not unusual. Since the 1980s academic studies have repeatedly shown that, on average, shares that have performed well in the recent past continue to do so for some time. Longer-term studies have confirmed that this “momentum” effect has been observable for much of the past century. Nor is the phenomenon confined to the stockmarket. Commodity prices and currencies are remarkably persistent, rising or falling for long periods.
The momentum effect drives a juggernaut through one of the tenets of finance theory, the efficient-market hypothesis. In its strongest form this states that past price movements should give no useful information about the future. Investors should have no logical reason to have preferred the winners of 2009 to the losers; both should be fairly priced already.
Actually, it doesn’t necessarily drive a juggernaut through the efficient-market hypothesis. Believers in EMH can aver that it’s not the stock that’s following momentum but rather it’s positive news. This is precisely why EMH is hard to knock down–it can be very slippery.
Markets do throw up occasional anomalies—for instance, the outperformance of shares in January or their poor performance in the summer months—that may be too small or unreliable to exploit. But the momentum effect is huge. Elroy Dimson, Paul Marsh and Mike Staunton of the London Business School (LBS) looked at the largest 100 stocks in the British market since 1900. They calculated the return from buying the 20 best performers over the past 12 months and then holding them, rebalancing the portfolio every month.
This produced an annual average of 10.3 percentage points more than a strategy of buying the previous 12 months’ worst performers. An investment of £1 in 1900 would have grown into £2.3m by the end of 2009; the same sum invested in the losers would have turned into just £49 (see chart 1).
Messrs Dimson, Marsh and Staunton applied a similar approach to 19 markets across the world and found a significant momentum effect in 18 of them, dating back to 1926 in America and 1975 in larger European markets. A study by AQR Capital Management, a hedge fund, found that the American stocks with the best momentum outperformed those with the worst by more than ten percentage points a year between 1927 and 2010 (see chart 2). AQR has set up a series of funds that attempt to exploit the momentum anomaly.
With any strategy like this, we need to be reminded that even if it works, any positive effects are difficult to capture due to trading costs, turnover and taxes. However, even adjusted for this, momentum still holds up.
What I find interesting is that momentum seems to conflict with the other major hole in EMH — value investing. Studies have also shown that stocks with lower valuations outperform the market. So stocks ignored by the market do well and stocks madly embraced by the market do well. Or does it mean that the outperforming value stocks are the momentum stocks? I’ve never been able to reconcile these two phenomena.
More from The Economist:
Once a trend is established, a share may benefit from a bandwagon effect. Professional fund managers have to prepare regular reports for clients on the progress of their portfolios. They will naturally want to demonstrate their skills by owning shares that have been rising in price and selling those that have been falling. This “window-dressing” may add to momentum. Paul Woolley of the London School of Economics has suggested that momentum might result from an agency problem. Investors reward fund managers who have recently beaten the market; such fund managers will inevitably own the most popular shares. As they get more money from clients, such managers will put more money into their favoured stocks, giving momentum an extra boost.
It is hardly a surprise that the momentum effect has been exploited by some professionals for decades. Commodity trading advisers (CTAs), also known as managed futures funds, exist to exploit the phenomenon. They take advantage of trends across a wide range of asset classes, including equities and currencies as well as raw materials. Martin Lueck was one of the three founders of AHL, one of the more successful CTAs, and now works for another trend-follower, Aspect Capital. “Trends occur because there is a disequilibrium between supply and demand,” he says. “The asset is trying to get from equilibrium price A to equilibrium price B.”
Many of the trend-following models were developed in the late 1970s and early 1980s. They were exploited by investors such as John Henry, best known outside the financial world for owning a baseball team, the Boston Red Sox, and a football club, Liverpool (which is on a downward trend of its own). One of the simplest was to buy an asset when the 20-day moving average of its price rose above its 200-day average. In a recent study Joëlle Miffre and Georgios Rallis of the Cass Business School in London found 13 profitable momentum strategies in commodity markets with an average annual return of 9.4% between 1979 and 2004.
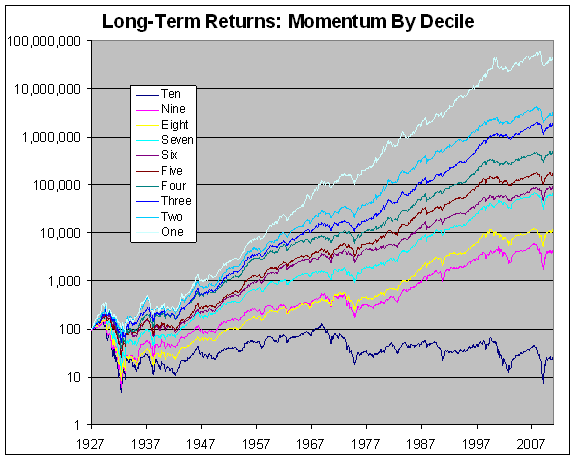
Here’s a look at long-term momentum returns by decile (10% slice). The data is from Ken French’s data library.
Notice that the market’s rally over the past two years has been strongly counter-momentum. Stocks that had been doing the worst gained over 265% in just seven months.
-
Morning News: January 20, 2011
Posted by Eddy Elfenbein on January 20th, 2011 at 8:13 amWorld Economic Forum in Davos to Focus on Global Power Shifts
Brazil Real Opens Stronger On New Cycle Of Interest Rate Hikes
China Overtakes Japan as World’s No. 2 Economy
Shadow Inventory Threatens Housing Recovery
Goldman Sachs Profit Slide Sends Asia-Pacific Bond Risk Higher
Morgan Stanley Quarterly Profit Rises 60% to $600 Million
Amazon Acquires Lovefilm in £200 Million Deal
Wendy’s/Arby’s to Sell Arby’s Sandwich Chain
American Airlines CFO Defends Rosy Outlook
-
This Could be the Worst Day in Two Months
Posted by Eddy Elfenbein on January 19th, 2011 at 4:33 pmAt Barry’s site, Peter Boockvar notes:
To put this decline in stocks into perspective and to highlight how relentless and extended the rally has been of late, a .7%+ closing decline in the S&P 500 today would be the biggest one day fall since late Nov.
He’s right. The S&P 500 fell 1.43% on November 23rd. It fell 0.75% on November 26th. The biggest pullback since December 15th was a drop of 0.21% on January 6th.
As I write this, the S&P 500 is at 1,280.13 which is a loss of 1.15%. To keep the 10-DMA streak going, the S&P 500 needs to close above 1,280.46.
Update: Yep, it’s the worst day for the S&P 500 since November 23rd. That was 38 sessions ago. The S&P closed at 1,281.92 today which is a drop of 1.01%.
The S&P 500 closed above its 10-DMA for the 34th day in a row, but we lost a lot of comfort room. The run will be over if the index closes below 1,081.05. That’s a drop of just 0.07%.
-
Goldman’s Earnings Plunge
Posted by Eddy Elfenbein on January 19th, 2011 at 10:14 amGoldman Sachs Group Inc.’s earnings dropped 52 percent, the third straight quarterly decline, as a slowdown in trading and investment banking reduced revenue more than analysts estimated. The shares fell by the most in almost two months.
Fourth-quarter net income decreased to $2.39 billion, or $3.79 a share, from $4.95 billion, or $8.20, a year earlier, the New York-based company said today in a statement. Estimates of 22 analysts surveyed by Bloomberg averaged $3.79 a share.
Chief Executive Officer Lloyd C. Blankfein, 56, worked to maintain Goldman Sachs’s profitability and reputation last year as client-trading revenue dropped 33 percent from a record in 2009 and the bank settled a civil fraud lawsuit filed by a U.S. regulator. Last week Goldman Sachs released a set of new business practices and changed financial reports to separate client-trading revenue from gains and losses generated by bets with its own money.
“We would see this as a disappointing performance and remain concerned that fixed-income revenues will remain weak into 2011,” Richard Staite, an analyst at Atlantic Equities in London, said in a note to clients after earnings were released.
The stock has rallied impressively since early July. Goldman has regained almost everything it lost since the SEC case broke.
I think Goldman is fairly cheap, as are many financial stocks, but I think stocks like JPMorgan Chase (JPM) are better values.
-
Morning News: January 19, 2011
Posted by Eddy Elfenbein on January 19th, 2011 at 7:58 amU.S. Futures Flat as Investors Await Banks’ Earnings
Germany Lifts 2011 Growth Forecast to 2.3%
Cheapest Stocks Get Cheaper as 10% Global Rally Discounts Movil
Don’t Get Carried Away by the Market Rally
Vietnam Must Erase Balance-of-Payments Deficit, Moody’s Says
Apple’s Cult Factor Emerges as Drawback
Comcast Wins Regulatory Approval for NBC Deal
IBM Rises as Profit Tops Estimates on Mainframe Sales
BNY Mellon Profit Rises 15% as Stock Rally Lifts Fees
Joshua Brown: Apple Beats: Most Importantest Quarter Ever, I Guess
Paul Kedrosky: Goldman is a Rogue Force in Finance, Part XXIV
-
Asset Pricing Theory….Kind Of
Posted by Eddy Elfenbein on January 18th, 2011 at 11:03 pmEric Falkenstein takes to Xtranormal:
-
10-DMA Streaks
Posted by Eddy Elfenbein on January 18th, 2011 at 12:56 pmUnless something very dramatic happens, this will be the 33rd-straight trading day that the S&P 500 closes above its 10-day moving average. Part of this streak is due to the market’s huge falloff in volatility.
Here’s a look at the longest streaks going back to 1932:
 Eddy Elfenbein is a Washington, DC-based speaker, portfolio manager and editor of the blog Crossing Wall Street. His