-
1% Per Week for Eight Years
Posted by Eddy Elfenbein on January 3rd, 2011 at 12:48 pmApple (AAPL) reached a new all-time high today of $330.20 per share.
On April 21, 2003, Apple was going for $6.57 per share (adjusted for a split).
This means the stock is up 50.26-fold in exactly 402 weeks. That works out to an average weekly gain of 0.979%.
In other words, Apple has gained an average of 1% per week for nearly eight years.
-
The Ever-Collapsing Dollar
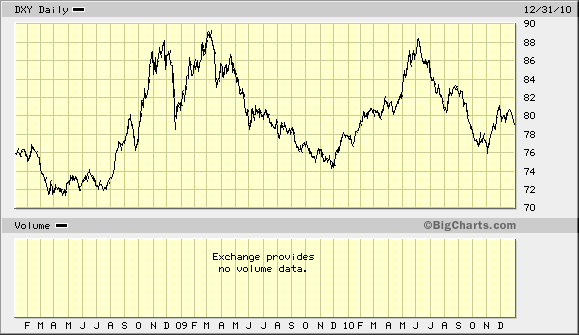
Posted by Eddy Elfenbein on January 3rd, 2011 at 11:56 amOn Google, “collapse of the dollar” currently returns over 1.5 million items. Funny, for something that’s about to happen — or I should say, always has been about to happen — it hasn’t happened yet.
If a person only followed market commentary but not prices, would they have any clue that the dollar rose last year?
-
So Far, So Good
Posted by Eddy Elfenbein on January 3rd, 2011 at 11:08 amThe market is off to a good start for 2011.
We’re still in the Santa Claus Rally period which runs from December 22 to January 7. Historically, the market has made 40% of its gains during this period.
Some of the market’s best days on average come during this stretch. For example, January 2 is the market’s second-best day (the best is October 20 which has often done well due to the market snapping back after big falls). December 31 is the seventh-best day and January 6 is the twelfth-best day. This is, indeed, the most wonderful time of the year.
Compounded with the new year is the turn-of-the-month effect. Historically, if you had been in the market for just a seven-day run each month—the last four trading days plus the first three trading days—you would have outperformed the market. For the rest of the month, the market is down. Also, the December-to-January turn has been the top-performer. Obviously, taxes and trading costs would have eaten your gains if you really had gone in and out of the market so frequently.
Another simple idea has worked well over the past 11 years — just invest on the first day of the month:
An S&P report recently found that someone who invested $10,000 in the S&P 500 on Dec. 31, 1999, and left the money there until Dec. 1, 2010, would have just $8,209. An investor who was in the market only on the first day of every month over the same time — for example, buying at the close on Dec. 31 and selling at the close of the first trading day in January — would have $13,816.
That’s nearly 70 percent more than buying and holding the whole time. S&P didn’t include reinvesting dividends in either scenario because of the complications of figuring out which companies paid dividends on the first trading day of the month for 11 years. But even if you include all possible dividends for the buy-and-holders, the first-day trade strategy came out 33 percentage points ahead.
-
December ISM = 57.0
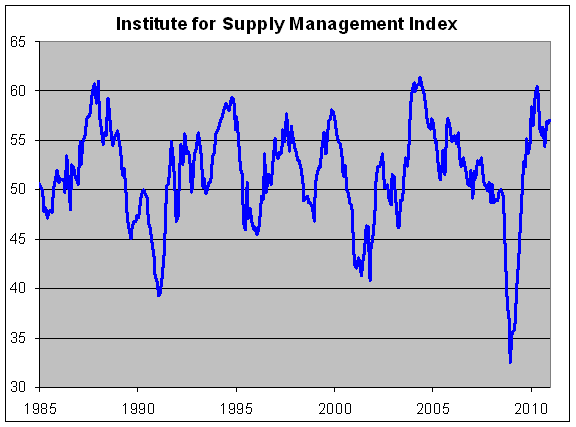
Posted by Eddy Elfenbein on January 3rd, 2011 at 10:08 amMoe good news for the economy. The December ISM Index came in at 57.0. Last month, it was 56.6.
The ISM is a good economic indicator to follow. I like that it comes out at the beginning of the month and that it’s not endlessly revised like GDP and employment numbers are.
It’s also very simple: If the ISM is over 50, the economy is growing. If it’s below 50, the economy is contracting. The ISM also has a decent track record of dating recession. Whenever the ISM is below 45, there’s a very good chance that the official recession dating committee will call that a recession.
-
“Yet Groner Felt No Urge To Keep Up With The Neighbors
Posted by Eddy Elfenbein on January 3rd, 2011 at 9:43 amI originally posted this back in March, but since Abbott Labs (ABT) is now on the Buy List, I thought it a good time to revisit the story of Grace Groner.
In 1935, she invested $180 in ABT. She died last year at the age of 100. That ABT position had grown to $7 million.
Groner was born in a small Lake County farming community, but by the time she was 12 both of her parents had died. She was taken in by George Anderson, a member of one of Lake Forest’s leading families and an apparent friend to Groner’s parents.
The Andersons raised her and her twin sister, Gladys, and paid for them to attend Lake Forest College. After Groner graduated in 1931, she took a job at nearby Abbott Laboratories, where she would work as a secretary for 43 years.
It was early in her time there that she made a decision that would secure her financial future.
In 1935, she bought three $60 shares of specially issued Abbott stock and never sold them. The shares split many times over the next seven decades, Marlatt said, and Groner reinvested the dividends. Long before she died, her initial outlay had become a fortune.
Marlatt was one of the few who knew about it. Lake Forest is one of America’s richest towns, filled with grand estates and teeming with luxury cars, yet Groner felt no urge to keep up with the neighbors.
-
Morning News: January 3, 2011
Posted by Eddy Elfenbein on January 3rd, 2011 at 7:58 amStocks Rally, Dollar Strengthens on Economic Outlook
European Manufacturing Expands Faster Than Estimated, Led by German Gains
China and Spain: A Brighter Future Through Win-Win Cooperation
Hong Kong Share Trading at Record on China Policy Concern, IPOs
Commodities Beat Stocks, Bonds, Dollar in 2010
The New Speed of Money, Reshaping Markets
Wheat Advances on Flooding in Australia, Dry Weather in U.S.
Exits Lag in the Fourth Quarter, but IPO Hype Boils for 2011
Facebook Worth $50 Billion After Goldman Investment
Bank of America to Take $3 Billion Mortgage Settlement Charge
Fiat May Increase Chrysler Stake to 51% Before IPO
The Social Web Index … All-Time Highs in Pressure and Price and Shame on Facebook
-
The S&P 500 Total Return Index
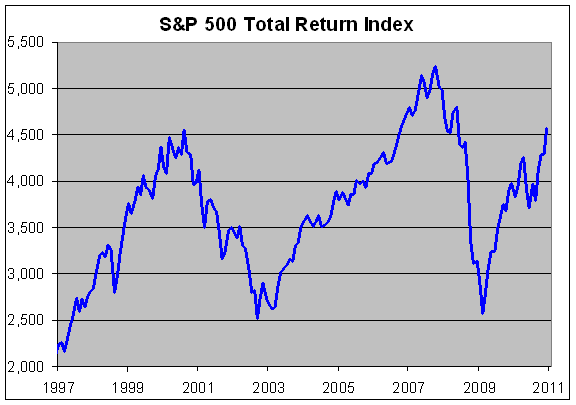
Posted by Eddy Elfenbein on January 2nd, 2011 at 11:21 amFor 2010, the S&P 500 gained 12.78%. The Total Return Index, which includes dividends, gained 15.06%. Over the last five years, the Total Return Index gained 11.99% and over the last ten years, it’s up by 15.07%.
Even after an explosive rally, the index is still more than 12% below its all-time high from 2007.
Measured from August 2000, the S&P 500 Total Return Index is up by 0.47%.
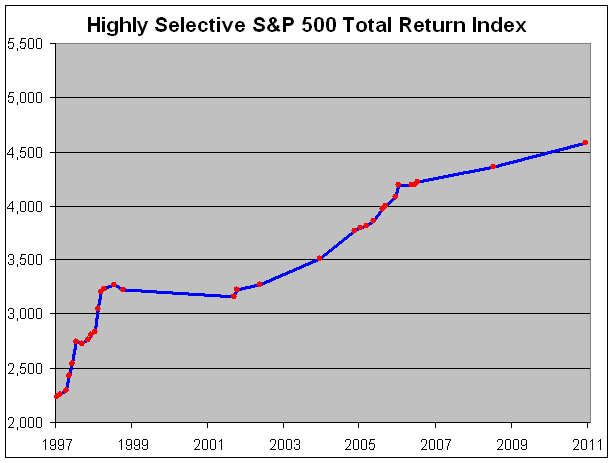
I prefer to follow my own invention, what I call the Highly Selective S&P 500 Total Return Index. See, things don’t look so bad now:
-
Wait ‘Til the Sun Shines, Nellie
Posted by Eddy Elfenbein on January 1st, 2011 at 1:07 amHappy New Year! One of Wall Street’s very old traditions is to sing “Wait ‘Til the Sun Shines, Nellie” on the final day of trading of the year. Here’s a clip from last year.
-
The 2011 Buy List
Posted by Eddy Elfenbein on December 31st, 2010 at 9:11 pmHere’s my 2011 Buy List. For tracking purposes, I assume it’s a $1,000,000 portfolio and that each position is worth $50,000. When I discuss how well the Buy List is doing, I’m referring to this list. Here’s each stock, ticker, starting price and number of shares:
Company Ticker Dec. 31 Price Number of Shares Abbott Laboratories ABT $47.91 1,043.6235 AFLAC AFL $56.43 886.0535 Becton, Dickinson & Co. BDX $84.52 591.5760 Bed Bath & Beyond BBBY $49.15 1,017.2940 Deluxe Corp. DLX $23.02 2,172.0243 Fiserv FISV $58.56 853.8251 Ford Motor Company F $16.79 2,977.9631 Gilead Sciences GILD $36.24 1,379.6909 Johnson & Johnson JNJ $61.85 808.4074 Jos. A. Bank Clothiers JOSB $40.32 1,240.0794 JPMorgan Chase JPM $42.42 1,178.6893 Leucadia National LUK $29.18 1,713.5024 Medtronic MDT $37.09 1,348.0723 Moog MOG-A $39.80 1,256.2814 Nicholas Financial NICK $10.24 4,882.8125 Oracle ORCL $31.30 1,597.4441 Reynolds American RAI $32.62 1,532.8020 Stryker SYK $53.70 931.0987 Sysco SYY $29.40 1,700.6803 Wright Express WXS $46.00 1,086.9565 The five new stocks are Abbott Laboratories (ABT), Deluxe Corp. (DLX), Ford (F), Oracle (ORCL) and JPMorgan Chase (JPM).
The five 2010 Buy List stocks I’m deleting for this year are Baxter International (BAX), Eaton Vance (EV), Eli Lilly (LLY), Intel (INTC) and SEI Investments (SEIC).
The average market value of the Buy List is $41.7 billion. The biggest is Johnson & Johnson (JNJ) at $170 billion. JPMorgan (JPM) and Oracle (ORCL) aren’t far behind at $166 billion and $158 billion respectively. The smallest by far is Nicholas Financial (NICK) at $168 million. The second smallest is Jos. A. Banks (JOSB) which is more than nine times larger than NICK.
The average forward P/E Ratio is 11.5 which is about 13% less than the S&P 500. Twelve of the 20 stocks pay a dividend. The average yield of the dividend-payers is close to 2.6%. Spread over 20 stocks, the Buy List yields 1.54%.
Only five stocks have remained on the Buy List for all five years: AFLAC (AFL), Bed Bath & Beyond (BBBY), Fiserv (FISV), Medtronic (MDT) and Sysco (SYY).
That’s it. The list is now “locked and sealed” and I can’t touch it until next year.
-
The 2010 Buy List
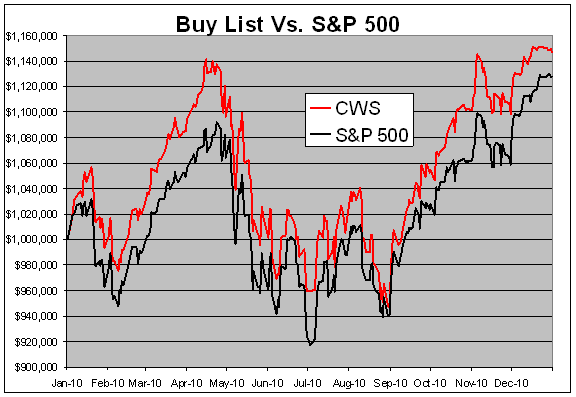
Posted by Eddy Elfenbein on December 31st, 2010 at 7:10 pmThe 2010 trading year has come to a close. I’m happy to report that our Buy List had another good year. The 20 stocks on the Crossing Wall Street Buy List gained an average of 14.71%. In contrast, the S&P 500 was up 12.78%. This is the fourth year in a row that we have beaten the market.
Including dividends, the Buy List gained 16.62% compared with 15.06% for the S&P 500. The dividend yield for the Buy List worked out to 1.67% while it was 2.02% for the S&P 500. For the year, our beta was 0.9479.
Over the five-year history of the Buy List, we’ve gained 34.03% to the S&P 500’s 11.99%. Our annual turnover has been just 25% which means we’ve only changed five stocks per year. The five-year beta is 0.9420.
Now I’ll restate the rules of the Buy List. I choose a portfolio of 20 stocks at the beginning of the year. After that, the Buy List is locked for the year and I can’t make any changes until the following year. For tracking purposes, I assume the Buy List is a $1 million portfolio equally divided among the 20 stocks. You can check the performance of the Buy List anytime at our Buy List page.
My goal is to show investors that by choosing stocks wisely and by sticking with high-quality stocks, they can beat the market—and that’s exactly what we’ve done. I try to beat the market by a few percentage points and to do it with less risk.
We were helped this year by having a well-diversified Buy List. Fourteen of the 20 stocks rose for the year, while six stocks (mostly healthcare) saw losses. We were over-weighted in healthcare which didn’t work to our benefit. Fortunately, some strong performers helped us out.
For the second year in a row, our smallest stock, Nicholas Financial (NICK), was our biggest winner. NICK gained 48.62% for the year. The second-biggest winner was Jos. A. Banks Clothiers (JOSB) which gained 43.35%.
Stock Number of Shares 12/31/2009 Beginning
12/31/2010 Ending
Profit/Loss AFL 1,081.0811 $46.25 $50,000.00 $56.43 $61,005 22.01% BAX 852.0791 $58.68 $50,000.00 $50.62 $43,132 -13.74% BDX 634.0350 $78.86 $50,000.00 $84.52 $53,589 7.18% BBBY 1,295.0013 $38.61 $50,000.00 $49.15 $63,649 27.30% EV 1,644.1960 $30.41 $50,000.00 $30.23 $49,704 -0.59% LLY 1,400.1680 $35.71 $50,000.00 $35.04 $49,062 -1.88% FISV 1,031.3531 $48.48 $50,000.00 $58.56 $60,396 20.79% GILD 1,155.5350 $43.27 $50,000.00 $36.24 $41,877 -16.25% INTC 2,450.9804 $20.40 $50,000.00 $21.03 $51,544 3.09% JNJ 776.2770 $64.41 $50,000.00 $61.85 $48,013 -3.97% JOSB 1,777.6725 $28.13 $50,000.00 $40.32 $71,676 43.35% LUK 2,101.7234 $23.79 $50,000.00 $29.18 $61,328 22.66% MDT 1,136.8804 $43.98 $50,000.00 $37.09 $42,167 -15.67% MOG-A 1,710.5713 $29.23 $50,000.00 $39.80 $68,081 36.16% NICK 7,256.8940 $6.89 $50,000.00 $10.24 $74,311 48.62% RAI 1,887.8610 $26.49 $50,000.00 $32.62 $61,582 23.16% SEIC 2,853.8813 $17.52 $50,000.00 $23.79 $67,894 35.79% SYK 992.6544 $50.37 $50,000.00 $53.70 $53,306 6.61% SYY 1,789.5490 $27.94 $50,000.00 $29.40 $52,613 5.23% WXS 1,569.3660 $31.86 $50,000.00 $46.00 $72,191 44.38% Total $1,000,000 $1,147,118 14.71% Notes:
JOSB split 3:2 on August 19. The original purchase of 1,185.1150 shares at $42.19 became 1,777.6725 shares at $28.126666.
RAI split 2:1 on November 16. The original purchase of 943.9305 shares at $52.97 became 1,887.8610 shares at $26.485.Here’s how the Buy List did throughout the year:
-
Archives
- October 2026
- September 2026
- August 2026
- July 2026
- June 2026
- May 2026
- April 2026
- March 2026
- February 2026
- January 2026
- December 2025
- November 2025
- October 2025
- September 2025
- August 2025
- July 2025
- June 2025
- May 2025
- April 2025
- March 2025
- February 2025
- January 2025
- December 2024
- November 2024
- October 2024
- September 2024
- August 2024
- July 2024
- June 2024
- May 2024
- April 2024
- March 2024
- February 2024
- January 2024
- December 2023
- November 2023
- October 2023
- September 2023
- August 2023
- July 2023
- June 2023
- May 2023
- April 2023
- March 2023
- February 2023
- January 2023
- December 2022
- November 2022
- October 2022
- September 2022
- August 2022
- July 2022
- June 2022
- May 2022
- April 2022
- March 2022
- February 2022
- January 2022
- December 2021
- November 2021
- October 2021
- September 2021
- August 2021
- July 2021
- June 2021
- May 2021
- April 2021
- March 2021
- February 2021
- January 2021
- December 2020
- November 2020
- October 2020
- September 2020
- August 2020
- July 2020
- June 2020
- May 2020
- April 2020
- March 2020
- February 2020
- January 2020
- December 2019
- November 2019
- October 2019
- September 2019
- August 2019
- July 2019
- June 2019
- May 2019
- April 2019
- March 2019
- February 2019
- January 2019
- December 2018
- November 2018
- October 2018
- September 2018
- August 2018
- July 2018
- June 2018
- May 2018
- April 2018
- March 2018
- February 2018
- January 2018
- December 2017
- November 2017
- October 2017
- September 2017
- August 2017
- July 2017
- June 2017
- May 2017
- April 2017
- March 2017
- February 2017
- January 2017
- December 2016
- November 2016
- October 2016
- September 2016
- August 2016
- July 2016
- June 2016
- May 2016
- April 2016
- March 2016
- February 2016
- January 2016
- December 2015
- November 2015
- October 2015
- September 2015
- August 2015
- July 2015
- June 2015
- May 2015
- April 2015
- March 2015
- February 2015
- January 2015
- December 2014
- November 2014
- October 2014
- September 2014
- August 2014
- July 2014
- June 2014
- May 2014
- April 2014
- March 2014
- February 2014
- January 2014
- December 2013
- November 2013
- October 2013
- September 2013
- August 2013
- July 2013
- June 2013
- May 2013
- April 2013
- March 2013
- February 2013
- January 2013
- December 2012
- November 2012
- October 2012
- September 2012
- August 2012
- July 2012
- June 2012
- May 2012
- April 2012
- March 2012
- February 2012
- January 2012
- December 2011
- November 2011
- October 2011
- September 2011
- August 2011
- July 2011
- June 2011
- May 2011
- April 2011
- March 2011
- February 2011
- January 2011
- December 2010
- November 2010
- October 2010
- September 2010
- August 2010
- July 2010
- June 2010
- May 2010
- April 2010
- March 2010
- February 2010
- January 2010
- December 2009
- November 2009
- October 2009
- September 2009
- August 2009
- July 2009
- June 2009
- May 2009
- April 2009
- March 2009
- February 2009
- January 2009
- December 2008
- November 2008
- October 2008
- September 2008
- August 2008
- July 2008
- June 2008
- May 2008
- April 2008
- March 2008
- February 2008
- January 2008
- December 2007
- November 2007
- October 2007
- September 2007
- August 2007
- July 2007
- June 2007
- May 2007
- April 2007
- March 2007
- February 2007
- January 2007
- December 2006
- November 2006
- October 2006
- September 2006
- August 2006
- July 2006
- June 2006
- May 2006
- April 2006
- March 2006
- February 2006
- January 2006
- December 2005
- November 2005
- October 2005
- September 2005
- August 2005
- July 2005
 Eddy Elfenbein is a Washington, DC-based speaker, portfolio manager and editor of the blog Crossing Wall Street. His