-
QOTD
Posted by Eddy Elfenbein on June 29th, 2010 at 9:39 amFrom Ambrose Evans-Pritchard:
As for the Fed, I venture to say that a common jury of 12 American men and women placed on the Federal Open Market Committee would have done a better job of setting monetary policy over the last 20 years than Doctors Bernanke and Greenspan.
-
The Supremes Help Tobacco Stocks
Posted by Eddy Elfenbein on June 28th, 2010 at 2:26 pmThe market is doing very well for us today. AFLAC (AFL) spiked as high as $46.20 before pulling back below $45. It’s still holding on to a nice gain.
Reynolds American (RAI) is getting a nice boost thanks to the Supreme Court’s decision in favor of the tobacco companies. All the major tobacco stocks are doing well today. RAI got as high as $54 a share earlier today.
This is a very split market today. The consumer stocks are doing well while the economically sensitive stocks are down. The Morgan Stanley Consumer Index (^CMR) is up 0.52% while the Morgan Stanley Cyclical Index (^CYC) is down -0.65%. -
First in Business Worldwide
Posted by Eddy Elfenbein on June 28th, 2010 at 10:35 amJump ahead to the 7 minute mark:
(Via: ZeroHedge) -
Stock Buyback Fail
Posted by Eddy Elfenbein on June 28th, 2010 at 9:59 amI loathe stock buybacks, but this one really takes the cake.
Guess what oil company spent $37 billion in buying back its own stock between 2005 and 2008, only to see that investment drop to $15 billion today?
I’ll give you a hint: BP (BP).
That’s about $12 per share that went out the window.
A few weeks ago, several emailers asked if BP was a good buy. I said that a falling stock isn’t a cheap stock. It’s only cheaper compared to where it was. At the time, BP was at $38 a share. On Friday, the stock made a new 52-week low below $27. -
The Duck Ducks Greece
Posted by Eddy Elfenbein on June 28th, 2010 at 9:41 amI haven’t made much of a secret that I think AFLAC’s (AFL) stock is absurdly low. I think the market is very nervous over what’s in AFLAC’s portfolio, especially in Europe, and that’ understandable. The most unnerving aspect of a financial crisis is that you never know who is exposed to what, until too late. The company, however, has made it clear that its portfolio is doing fine.
Today the company reports that it has dumped all of its Greek sovereign bonds. AFLAC got $270 million for the bonds, which is a loss of $67 million, or around 14 cents a share. That’s barely a dent.
AFLAC has also reduced its exposure to perpetual securities (also known as “hybrids”) through two separate transactions. This is how they describe the sales:The company also exchanged a perpetual, Upper Tier II security of a European issuer for a higher-rated, fixed maturity, senior debt instrument. In addition, the company further reduced its perpetual Upper Tier II holdings through a privately negotiated transaction with another European issuer.
Hmmm. A bit murky, no? The important news is that those sales will bring in $80 million in profit to their Q2 GAAP earnings, or about 17 cents per share.
This is very good news and it shows investors how well AFLAC manager risk. Kriss Cloninger III, the president and CFO said:Although these transactions resulted in losses on a statutory accounting basis, we estimate they will add approximately 20 points to our risk-based capital ratio by reducing investment concentrations and reinvesting into higher-rated debt securities. As we have repeatedly discussed, our primary focus is to maintain a strong capital position. That is especially true today, given uncertainty in the global economic environment and the volatility of capital markets. As such, we will continue to assess the creditworthiness of issuers in our portfolio and manage our investments in a way that reflects our risk tolerance and the objectives we’ve set for earnings growth. In that regard, we continue to believe our objectives of increasing operating earnings per diluted share 9% to 12% in 2010 and 8% to 12% in 2011, before the impact of currency translation, are achievable.
Last year, AFL made $4.85 per share. For this year, they said they expect to earn somewhere between $5.24 to $5.56 per share.
-
Lowest Mortgage Rates in 50 Years
Posted by Eddy Elfenbein on June 26th, 2010 at 11:11 amNot that anyone has any money:
Mortgages are cheaper today than they’ve been in a half-century. If only most people had the job security, the credit score and the cash to qualify.
The average rate for a 30-year fixed loan sank to 4.69 percent this week, beating the low set in December and down from 4.75 percent last week, Freddie Mac said Thursday. Rates for 15-year and five-year mortgages also hit lows.
Rates are at their lowest since the mortgage company began keeping records in 1971. The last time they were any cheaper was the 1950s, when most long-term home loans lasted just 20 or 25 years. -
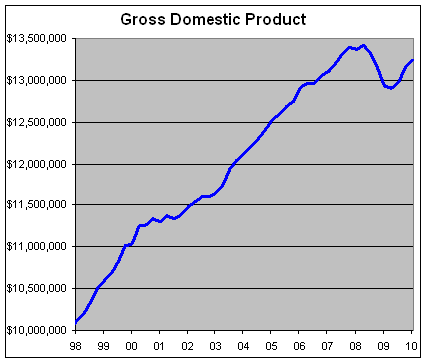
Today’s Ugly GDP Report
Posted by Eddy Elfenbein on June 25th, 2010 at 10:15 amWhen the initial first-quarter GDP report came out two months ago, I said it was pretty bad.
Now here we are two months later and it turns out that GDP growth was worse than we thought. The government said the economy grew by just 2.7% during the first three months of the year.
-
North Korea Says We Owe Them $65 Trillion
Posted by Eddy Elfenbein on June 24th, 2010 at 11:27 pm
$64.96 trillion to be exact due to 60 years of hostility:The official North Korean news agency, KCNA, says the cost of the damage done by the US since the peninsula was divided in 1945 is estimated at $US64.96 trillion.
The compensation call comes on the eve of the 60th anniversary of the start of the 1950-1953 Korean War.
KCNA said the figure includes $US26.1 trillion arising from US “atrocities” which left more than 5 million North Koreans dead, wounded, kidnapped or missing.
The agency also claims 60 years of US sanctions have caused a loss of $US13.7 trillion by 2005, while property losses were estimated at $US16.7 trillion.
The agency said North Koreans have “the justifiable right” to receive the compensation for their blood.
It said the committee’s calculation did not include the damage North Korea had suffered from sanctions after its first nuclear test in 2006. -
Bed Bath & Beyond Earns 52 Cents a Share
Posted by Eddy Elfenbein on June 24th, 2010 at 9:34 amI was somewhat right about Bed Bath & Beyond‘s (BBBY) earnings report. The company earned 52 cents a share for its May quarter. My range of 52 to 54 cents a share was more than Wall Street’s consensus of 48 cents a share.
I was also right that the big news would be the company’s outlook for this quarter. BBBY said to expect earnings for the August quarter to range from 59 to 63 cents a share. Wall Street was expecting 63 cents per share.
For the full-year, BBBY said it expects profit growth of 15%. Last year, the company made $2.30 a share so that translates to earnings of $2.65 per share for this year. That’s five cents below Wall Street’s view. In April, BBBY’s original forecast was for EPS growth of 10% to 15% for this year, so there’s really no downgrade at all. In fact, I think $2.65 is probably on the low side.
The stock was off sharply in the after-hours market yesterday but it seems to have recovered somewhat. This news really isn’t that bad; I’d say it’s closer to fine-tuning than poor guidance. The good news is that profit margins continue to improve. This is the fifth straight quarter that year-over-year net margins are up.
For the last four quarters, BBBY’s net margin is just over 8%. That’s a huge improvement from under 6% just a few quarters ago. To give you some perspective, that kind of margin growth turns a sales increase of 12% into profit growth of close to 50%.
Here’s a look at the trailing four-quarter EPS going back a few years. The red line is the company’s forecast.
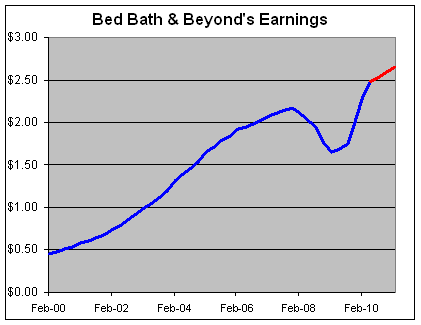
The company has clearly recovered from the recession. To many people make the mistake of lumping BBBY in with housing stocks. Their business is affected by housing but it’s not so heavily dependent on the overall health of that sector.
My view is that if you can get this stock below $40, you’re getting a good deal.
Here are the earnings results going back a few years:Quarter Sales Gross Profit Operating Profit Net Profit EPS $146,214 $28,015 $17,883 $0.06 $451,715 $185,570 $53,580 $33,247 $0.12 $480,145 $196,784 $50,607 $31,707 $0.11 $569,012 $238,233 $77,138 $48,392 $0.17 $459,163 $187,293 $36,339 $23,364 $0.08 $589,381 $241,284 $70,009 $43,578 $0.15 $602,004 $246,080 $64,592 $40,665 $0.14 $746,107 $311,802 $101,898 $64,315 $0.22 $575,833 $234,959 $45,602 $30,007 $0.10 $713,636 $291,342 $84,672 $53,954 $0.18 $759,438 $311,030 $83,749 $52,964 $0.18 $879,055 $370,235 $132,077 $82,674 $0.28 $776,798 $318,362 $72,701 $46,299 $0.15 $903,044 $370,335 $119,687 $75,459 $0.25 $936,030 $386,224 $119,228 $75,112 $0.25 $1,049,292 $443,626 $168,441 $105,309 $0.35 $893,868 $367,180 $90,450 $57,508 $0.19 $1,111,445 $459,145 $155,867 $97,208 $0.32 $1,174,740 $486,987 $161,459 $100,506 $0.33 $1,297,928 $563,352 $231,567 $144,248 $0.47 $1,100,917 $456,774 $128,707 $82,049 $0.27 $1,273,960 $530,829 $189,108 $120,008 $0.39 $1,305,155 $548,152 $190,978 $121,927 $0.40 $1,467,646 $650,546 $283,621 $180,980 $0.59 $1,244,421 $520,781 $150,884 $98,903 $0.33 $1,431,182 $601,784 $217,877 $141,402 $0.47 $1,448,680 $615,363 $205,493 $134,620 $0.45 $1,685,279 $747,820 $304,917 $197,922 $0.67 $1,395,963 $590,098 $148,750 $100,431 $0.35 $1,607,239 $678,249 $219,622 $145,535 $0.51 $1,619,240 $704,073 $211,134 $142,436 $0.50 $1,994,987 $862,982 $309,895 $205,842 $0.72 $1,553,293 $646,109 $154,391 $104,647 $0.38 $1,767,716 $732,158 $211,037 $147,008 $0.55 $1,794,747 $747,866 $203,152 $138,232 $0.52 $1,933,186 $799,098 $259,442 $172,921 $0.66 $1,648,491 $656,000 $118,819 $76,777 $0.30 $1,853,892 $739,321 $187,421 $119,268 $0.46 $1,782,683 $692,857 $136,374 $87,700 $0.34 $1,923,274 $785,058 $231,282 $141,378 $0.55 $1,694,340 $666,818 $142,304 $87,172 $0.34 $1,914,909 $773,393 $222,031 $135,531 $0.52 $1,975,465 $812,412 $245,611 $151,288 $0.58 $2,244,079 $955,496 $370,741 $226,042 $0.86 $1,923,051 $775,036 $225,394 $137,553 $0.52 -
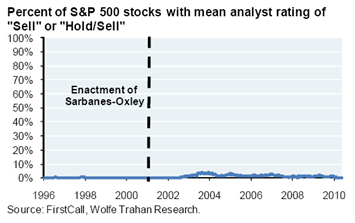
It’s Always Sunning On Wall Street
Posted by Eddy Elfenbein on June 24th, 2010 at 9:05 amVia Paul Kedrosky comes this chart showing how rarely Wall Street tells us to sell.
-
Archives
- June 2026
- May 2026
- April 2026
- March 2026
- February 2026
- January 2026
- December 2025
- November 2025
- October 2025
- September 2025
- August 2025
- July 2025
- June 2025
- May 2025
- April 2025
- March 2025
- February 2025
- January 2025
- December 2024
- November 2024
- October 2024
- September 2024
- August 2024
- July 2024
- June 2024
- May 2024
- April 2024
- March 2024
- February 2024
- January 2024
- December 2023
- November 2023
- October 2023
- September 2023
- August 2023
- July 2023
- June 2023
- May 2023
- April 2023
- March 2023
- February 2023
- January 2023
- December 2022
- November 2022
- October 2022
- September 2022
- August 2022
- July 2022
- June 2022
- May 2022
- April 2022
- March 2022
- February 2022
- January 2022
- December 2021
- November 2021
- October 2021
- September 2021
- August 2021
- July 2021
- June 2021
- May 2021
- April 2021
- March 2021
- February 2021
- January 2021
- December 2020
- November 2020
- October 2020
- September 2020
- August 2020
- July 2020
- June 2020
- May 2020
- April 2020
- March 2020
- February 2020
- January 2020
- December 2019
- November 2019
- October 2019
- September 2019
- August 2019
- July 2019
- June 2019
- May 2019
- April 2019
- March 2019
- February 2019
- January 2019
- December 2018
- November 2018
- October 2018
- September 2018
- August 2018
- July 2018
- June 2018
- May 2018
- April 2018
- March 2018
- February 2018
- January 2018
- December 2017
- November 2017
- October 2017
- September 2017
- August 2017
- July 2017
- June 2017
- May 2017
- April 2017
- March 2017
- February 2017
- January 2017
- December 2016
- November 2016
- October 2016
- September 2016
- August 2016
- July 2016
- June 2016
- May 2016
- April 2016
- March 2016
- February 2016
- January 2016
- December 2015
- November 2015
- October 2015
- September 2015
- August 2015
- July 2015
- June 2015
- May 2015
- April 2015
- March 2015
- February 2015
- January 2015
- December 2014
- November 2014
- October 2014
- September 2014
- August 2014
- July 2014
- June 2014
- May 2014
- April 2014
- March 2014
- February 2014
- January 2014
- December 2013
- November 2013
- October 2013
- September 2013
- August 2013
- July 2013
- June 2013
- May 2013
- April 2013
- March 2013
- February 2013
- January 2013
- December 2012
- November 2012
- October 2012
- September 2012
- August 2012
- July 2012
- June 2012
- May 2012
- April 2012
- March 2012
- February 2012
- January 2012
- December 2011
- November 2011
- October 2011
- September 2011
- August 2011
- July 2011
- June 2011
- May 2011
- April 2011
- March 2011
- February 2011
- January 2011
- December 2010
- November 2010
- October 2010
- September 2010
- August 2010
- July 2010
- June 2010
- May 2010
- April 2010
- March 2010
- February 2010
- January 2010
- December 2009
- November 2009
- October 2009
- September 2009
- August 2009
- July 2009
- June 2009
- May 2009
- April 2009
- March 2009
- February 2009
- January 2009
- December 2008
- November 2008
- October 2008
- September 2008
- August 2008
- July 2008
- June 2008
- May 2008
- April 2008
- March 2008
- February 2008
- January 2008
- December 2007
- November 2007
- October 2007
- September 2007
- August 2007
- July 2007
- June 2007
- May 2007
- April 2007
- March 2007
- February 2007
- January 2007
- December 2006
- November 2006
- October 2006
- September 2006
- August 2006
- July 2006
- June 2006
- May 2006
- April 2006
- March 2006
- February 2006
- January 2006
- December 2005
- November 2005
- October 2005
- September 2005
- August 2005
- July 2005
 Eddy Elfenbein is a Washington, DC-based speaker, portfolio manager and editor of the blog Crossing Wall Street. His