-
The Buy List Is Now Up Over 10% YTD
Posted by Eddy Elfenbein on April 5th, 2010 at 10:23 amThe day is still young, but the CWS Buy List officially crossed the 10% line for the year. This is why I don’t try to time the market. I never would have said that we’d make 10% in a little over one quarter. Joey Banks (JOSB) is at another new high.
-
Vanity Fair’s Awful Interview With Erin Burnett
Posted by Eddy Elfenbein on April 5th, 2010 at 9:52 amVanity Fair just published an awful interview with CNBC’s Erin Burnett. I’m not exaggerating when I say that the interview is most about the interviewer. The interview is apparently about Mr. Eric Spitznagel’s momentous event of interviewing Burnett, and she’s somehow in the way.
Here’s one example:If you watch enough cable news, it starts to seem like if AIG or Citibank goes under, we’re all going to be like Charlton Heston in Planet of the Apes, staring up in disbelief at the disembodied head of the Statue of Liberty and screaming “You blew it up! Damn you! Damn you all to heeeeeelll!” If we don’t save those companies from bankruptcy, are we headed towards an ape-run dystopia?
(Long pause.) I don’t know. I would say no, but banks and availability of credit are the most basic and important things for an economy. What if the banks had failed? Nobody keeps cash anymore. We think society moves forward, generation after generation, ahead and ahead and ahead. We don’t realize maybe how reliant we are on things that are far from hunting and gathering.I counted the words. Erin won but the margin was less than 2-to-1.
(One more thing — it wasn’t the disembodied head, but you can clearly see much of the torso.) -
March ISM = 59.6, Best Since 2004
Posted by Eddy Elfenbein on April 1st, 2010 at 10:02 amMore good news for the economy. The Institute for Supply Management released its index this morning and the reading was 59.6. This was better than economists’ expectations. It’s also the best number in close to six years. Last month’s ISM was 56.5.
As I explained recently, the ISM is one of the best indicators of how well the economy is doing. Anytime the ISM is 44 or less, it’s almost certain that we’re in a recession.
Now the problem is jobs and that report comes out tomorrow. Goldman just lowered its NFP estimates from 275,000 to 200,000. I’ll be happy with any positive number. -
Exactly What Is the Spot Price of Gold?
Posted by Eddy Elfenbein on April 1st, 2010 at 9:09 amJesse’s Cafe American has a good post on how the gold market works:
When you ask even a relatively experienced and sophisticated precious metals trader “what is the spot price of gold or silver?’ you will generally hear a pause, and then they will come back with a price after checking their computer screen for the latest spot price from some ubiquitous and reliable provider of such quotes, or one of the lesser known, diverse providers of this information.
But when you say, “No what I was asking is ‘what is the spot price, where does it come from, who sets it?'” you will most often hear that this is the last physical trade, or the current market price of physical bullion.
Well, is it?
Actually despite what you might think or what you might have heard, it is not.
The reason for this is that there is no centralized and efficient market for the sale of physical bullion in the US at anything resembling a ‘spot price.’ What is their number, where are their prices and trades posted? Who is buying and selling what, TODAY, with the real delivery of bullion as the primary objective?Read the whole thing.
-
What the Steep Yield Curve Means
Posted by Eddy Elfenbein on April 1st, 2010 at 7:38 amPaul Krugman has a confusing post on the steep yield curve, at least it’s confusing to me. My rule is if I can’t follow what a Nobel laureate’s saying, then it’s a pretty good bet that it’s my fault.
Still, as I read Krugman he says that when he earlier discussed the yield curve, people thought it was “proof that the economy would recover soon,” but now people think it’s over “fears of default.” Yet Krugman writes that the reason for the steep curve “has nothing to do with either explanation.” But he essentially says that it’s the first reason—hopes for a recovery.
That’s only mildly confusing but where I really lose Krugman is when he seems to imply that the steep yield curve is the result of nominal short rates being near zero. I have no problem accepting that the curve should be positive but I don’t get how that ought to impact its unusual steepness. After all, the two-ten spread recently hit an all-time record.
I agree with Krugman’s view that we’ve become too inflation-phobic. When you have 15 million people out of work, it’s best to err on the side of higher inflation. I also agree that long-term inflation expectations are nothing to worry about. The ten-year TIPs spread is still mild. But I do believe the very steep yield curve is a result of higher inflation expectations. The hitch is that those expectations don’t say that inflation will go from a normal level to a danger level; they say that inflation will go from a dangerously low level to a normal level. The steep curve doesn’t merely reflect the future—half the variables are the present and the present ain’t normal.
The other issue I wanted to mention is that we shouldn’t focus on the 10-year TIPs spread. We should look at the TIPs curve leading up to ten years. It’s the expected forward inflation rate that I like to follow. Yet even when we do, I’m still in Krugman’s camp—inflation isn’t an important concern right now. (BTW, Krugman was very worried about inflation seven years ago.) -
JOSB Update
Posted by Eddy Elfenbein on March 31st, 2010 at 12:02 pmShares of JOSB have been as high as $54.89 today. On the Buy List, there’s now a close running for top-performer YTD between JOSB, SEIC and MOG-A.
I see that NICK’s ask price fell below $7.40. That’s a great deal. This is the lull period between earnings. The next report isn’t due until early May. I expect a rally then. -
12 Million Percent Profit
Posted by Eddy Elfenbein on March 31st, 2010 at 11:27 amThat’s what micro-caps have done since the Great Depression.
Here’s a breakdown of market performance by size decile. The smallest have done the best and the biggest have done the worst.
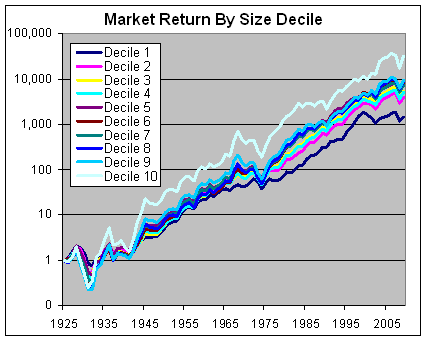
Here’s the annualized return by size decile:Decile 1 9.1% Decile 2 10.4% Decile 3 10.7% Decile 4 10.7% Decile 5 11.3% Decile 6 11.2% Decile 7 11.2% Decile 8 11.4% Decile 9 11.5% Decile 10 13.1% -
Joey Banks – Kicking It
Posted by Eddy Elfenbein on March 31st, 2010 at 7:33 amMore good earnings news for JoS. A. Bank Clothiers (JOSB). FY 2009 earnings-per-share came in at $3.84 up from $3.17 the year before and $2.72 the year before that. That’s very nice growth.
The company didn’t give quarterly results (those come out tomorrow) but by walking back the cat, I figure the fourth-quarter earnings come to $1.91 a share which is 12 cents more than Street expectations.
The odd thing here is that this is for Joe’s fiscal fourth quarter which is November, December and January. In other words, it’s a long time ago. Since companies often take longer with their Q4 report, Joe’s next earnings report will probably be out in just nine weeks or so. Also, since their fourth quarter covers the holiday season, it accounts for about half their annual profit. This is a big deal and JOSB did well.Net sales reached a record of $770.3 million in fiscal year 2009, representing a 10.7% gain as compared with net sales of $695.9 million in fiscal year 2008. Comparable store sales increased 6.3% during fiscal year 2009, while Direct Marketing sales increased 12.2%. The Company ended fiscal year 2009 with $21.9 million in cash, $169.7 million in short-term investments and no debt.
“We are pleased to announce another solid year of sales and earnings growth,” commented R. Neal Black, President and CEO of JoS. A. Bank Clothiers, Inc. “Our core strategy to provide our customers with high quality men’s clothing at a great value and to actively promote this value through a diverse advertising and marketing campaign has again produced favorable results for fiscal year 2009. We have continued to be successful in expanding our market share, growing our profits and controlling our expenses, while further strengthening our balance sheet. Additionally, with this quarter’s results, we have achieved earnings growth in 33 of the past 34 quarters when compared to the respective prior year periods, including 15 quarters in a row,” continued Mr. Black. -
Happy MBS Day!
Posted by Eddy Elfenbein on March 31st, 2010 at 7:10 amToday is the last day of the first quarter, but more importantly, it’s the last day that the Federal Reserve is buying mortgage-backed securities from Freddie and Fannie. The Fed has spent $1.25 trillion on buying this garbage from the GSEs but after today, no more!
It turns out that when you dump huge, gigantic amounts of money at something there tends to be an effect. In this case, mortgage rates have remained very low. Now some people worry that without Ben buying up anything that moves mortgage rates will soar. I doubt that will happen. Sure, rates will probably creep up (a 30-year fixed is around 5% right now) but the market knew this day was coming and it’s had some time to adjust. Also, the Fed still has the ability to jump back in if things quickly head south.
So who will now buy mortgage-backed securities? One answer is that banks, of all people, might do it with all the cash that the Fed has recently injected. Plus, even though the official Fed is going away, its shadow will still be around in the move of Fannie and Freddie buying out delinquent loans. This will be a lot of cash in investors’ hands.
Some people are worried that higher mortgages rates will ruin any gains made by a still-weak housing market, and we might go back exactly where we were. Once again, I’m a doubter. The mortgage market is much healthier that it was. Mortgage spreads have plunged from 18 months ago. For now, it looks like private investors are ready to take the place of the Fed in the mortgage market. -
What If the Stock Market Was an Inflation-Protected Bond?
Posted by Eddy Elfenbein on March 30th, 2010 at 11:40 amWho’s up for a very off-the-wall post? Good, you’re at the right place.
As I mentioned yesterday, I just got the new Ibbotson Yearbook which is a great resource for historical stock market data.
A few years ago, I took the historical performance data of the stock market and wanted to see what it would look like if the stock market were a bond. In order words, what if a bond performed exactly the same way the stock market had? What would its yield-to-maturity look like through the decades?
I took all of the monthly return data going back to the 1920s and assumed we had a bond of infinite maturity that paid a fixed coupon each month.
Let me stress that even though this bond is complete make-believe, the results are what the stock market actually did. I ran this scenario again but this time I changed the bond to an inflation-protected bond. Here’s what it looks like:
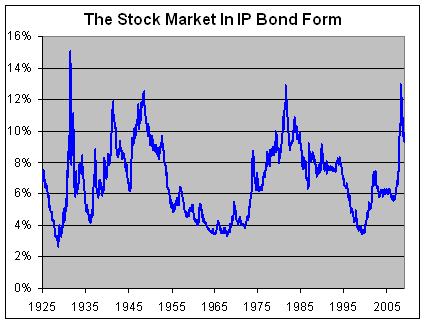
There were three major troughs; 1929 around 2.7%, 1968 at 3.3% and 2000 at 3.5%.
The highest peak came in 1932 at 15%. There were other peaks in 1949 at 12.5%, 1982 at 12.9% and last year at 13%. At the end of 2009, the yield-to-maturity stood 9.3%. Thanks to the rally, that’s come down some since.
There’s one hitch with this study. I have to choose a starting yield-to-maturity for December 1925. So this isn’t a completely kosher experiment because the starting point is based on my guess. If I choose a number that’s too high, then the historical performance won’t be able to keep up, and the yield-to-maturity would grow higher and higher and soon leave orbit. Conversely, if my starting YTM is too low, the yield would gradually get pushed down to microscopic levels.
Based on trial and error, I used 6.76% as a starting point. That made the graph symmetrical with an historical average yield of 6.79%.
-
Archives
- June 2026
- May 2026
- April 2026
- March 2026
- February 2026
- January 2026
- December 2025
- November 2025
- October 2025
- September 2025
- August 2025
- July 2025
- June 2025
- May 2025
- April 2025
- March 2025
- February 2025
- January 2025
- December 2024
- November 2024
- October 2024
- September 2024
- August 2024
- July 2024
- June 2024
- May 2024
- April 2024
- March 2024
- February 2024
- January 2024
- December 2023
- November 2023
- October 2023
- September 2023
- August 2023
- July 2023
- June 2023
- May 2023
- April 2023
- March 2023
- February 2023
- January 2023
- December 2022
- November 2022
- October 2022
- September 2022
- August 2022
- July 2022
- June 2022
- May 2022
- April 2022
- March 2022
- February 2022
- January 2022
- December 2021
- November 2021
- October 2021
- September 2021
- August 2021
- July 2021
- June 2021
- May 2021
- April 2021
- March 2021
- February 2021
- January 2021
- December 2020
- November 2020
- October 2020
- September 2020
- August 2020
- July 2020
- June 2020
- May 2020
- April 2020
- March 2020
- February 2020
- January 2020
- December 2019
- November 2019
- October 2019
- September 2019
- August 2019
- July 2019
- June 2019
- May 2019
- April 2019
- March 2019
- February 2019
- January 2019
- December 2018
- November 2018
- October 2018
- September 2018
- August 2018
- July 2018
- June 2018
- May 2018
- April 2018
- March 2018
- February 2018
- January 2018
- December 2017
- November 2017
- October 2017
- September 2017
- August 2017
- July 2017
- June 2017
- May 2017
- April 2017
- March 2017
- February 2017
- January 2017
- December 2016
- November 2016
- October 2016
- September 2016
- August 2016
- July 2016
- June 2016
- May 2016
- April 2016
- March 2016
- February 2016
- January 2016
- December 2015
- November 2015
- October 2015
- September 2015
- August 2015
- July 2015
- June 2015
- May 2015
- April 2015
- March 2015
- February 2015
- January 2015
- December 2014
- November 2014
- October 2014
- September 2014
- August 2014
- July 2014
- June 2014
- May 2014
- April 2014
- March 2014
- February 2014
- January 2014
- December 2013
- November 2013
- October 2013
- September 2013
- August 2013
- July 2013
- June 2013
- May 2013
- April 2013
- March 2013
- February 2013
- January 2013
- December 2012
- November 2012
- October 2012
- September 2012
- August 2012
- July 2012
- June 2012
- May 2012
- April 2012
- March 2012
- February 2012
- January 2012
- December 2011
- November 2011
- October 2011
- September 2011
- August 2011
- July 2011
- June 2011
- May 2011
- April 2011
- March 2011
- February 2011
- January 2011
- December 2010
- November 2010
- October 2010
- September 2010
- August 2010
- July 2010
- June 2010
- May 2010
- April 2010
- March 2010
- February 2010
- January 2010
- December 2009
- November 2009
- October 2009
- September 2009
- August 2009
- July 2009
- June 2009
- May 2009
- April 2009
- March 2009
- February 2009
- January 2009
- December 2008
- November 2008
- October 2008
- September 2008
- August 2008
- July 2008
- June 2008
- May 2008
- April 2008
- March 2008
- February 2008
- January 2008
- December 2007
- November 2007
- October 2007
- September 2007
- August 2007
- July 2007
- June 2007
- May 2007
- April 2007
- March 2007
- February 2007
- January 2007
- December 2006
- November 2006
- October 2006
- September 2006
- August 2006
- July 2006
- June 2006
- May 2006
- April 2006
- March 2006
- February 2006
- January 2006
- December 2005
- November 2005
- October 2005
- September 2005
- August 2005
- July 2005
 Eddy Elfenbein is a Washington, DC-based speaker, portfolio manager and editor of the blog Crossing Wall Street. His