-
Happy MBS Day!
Posted by Eddy Elfenbein on March 31st, 2010 at 7:10 amToday is the last day of the first quarter, but more importantly, it’s the last day that the Federal Reserve is buying mortgage-backed securities from Freddie and Fannie. The Fed has spent $1.25 trillion on buying this garbage from the GSEs but after today, no more!
It turns out that when you dump huge, gigantic amounts of money at something there tends to be an effect. In this case, mortgage rates have remained very low. Now some people worry that without Ben buying up anything that moves mortgage rates will soar. I doubt that will happen. Sure, rates will probably creep up (a 30-year fixed is around 5% right now) but the market knew this day was coming and it’s had some time to adjust. Also, the Fed still has the ability to jump back in if things quickly head south.
So who will now buy mortgage-backed securities? One answer is that banks, of all people, might do it with all the cash that the Fed has recently injected. Plus, even though the official Fed is going away, its shadow will still be around in the move of Fannie and Freddie buying out delinquent loans. This will be a lot of cash in investors’ hands.
Some people are worried that higher mortgages rates will ruin any gains made by a still-weak housing market, and we might go back exactly where we were. Once again, I’m a doubter. The mortgage market is much healthier that it was. Mortgage spreads have plunged from 18 months ago. For now, it looks like private investors are ready to take the place of the Fed in the mortgage market. -
What If the Stock Market Was an Inflation-Protected Bond?
Posted by Eddy Elfenbein on March 30th, 2010 at 11:40 amWho’s up for a very off-the-wall post? Good, you’re at the right place.
As I mentioned yesterday, I just got the new Ibbotson Yearbook which is a great resource for historical stock market data.
A few years ago, I took the historical performance data of the stock market and wanted to see what it would look like if the stock market were a bond. In order words, what if a bond performed exactly the same way the stock market had? What would its yield-to-maturity look like through the decades?
I took all of the monthly return data going back to the 1920s and assumed we had a bond of infinite maturity that paid a fixed coupon each month.
Let me stress that even though this bond is complete make-believe, the results are what the stock market actually did. I ran this scenario again but this time I changed the bond to an inflation-protected bond. Here’s what it looks like:
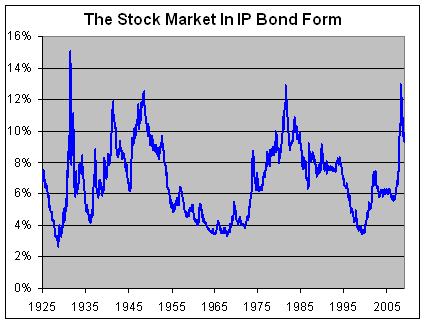
There were three major troughs; 1929 around 2.7%, 1968 at 3.3% and 2000 at 3.5%.
The highest peak came in 1932 at 15%. There were other peaks in 1949 at 12.5%, 1982 at 12.9% and last year at 13%. At the end of 2009, the yield-to-maturity stood 9.3%. Thanks to the rally, that’s come down some since.
There’s one hitch with this study. I have to choose a starting yield-to-maturity for December 1925. So this isn’t a completely kosher experiment because the starting point is based on my guess. If I choose a number that’s too high, then the historical performance won’t be able to keep up, and the yield-to-maturity would grow higher and higher and soon leave orbit. Conversely, if my starting YTM is too low, the yield would gradually get pushed down to microscopic levels.
Based on trial and error, I used 6.76% as a starting point. That made the graph symmetrical with an historical average yield of 6.79%. -
More Historical Stats
Posted by Eddy Elfenbein on March 29th, 2010 at 2:44 pmIn the olden days, investors tended to look at stocks similar to the way we look at bonds today — it was all about yield. Stocks often traded around $100 a share (or whatever the par value was) and you waited to hear from the board what the annual or semi-annual dividend was. Retained earnings were so small as to nearly be irrelevant.
The idea of expecting continuous capital gains is something fairly new. According to data from Ibbotson, the market’s annualized capital gain from 1824 to 1942 was 0.90%. Dividends, however, grew by 5.90%. Since 1942, capital gains have grown by an average of 7.33% while dividends have grown by 3.75%.
Inflation has obviously been much higher since 1942 than before (3.93% to 0.47%), but the distribution of the market’s overall gain is what I find most striking. -
What History Says
Posted by Eddy Elfenbein on March 29th, 2010 at 11:17 amI just got the new Ibbotson Yearbook. It’s a great resource for historical asset performance. Here are a few items that caught my eye.
**Over the last 25 years, long-term Treasuries have slightly outperformed long-term corporate bonds.
**After inflation, T-bills have gone nowhere for nearly ten years.
**Over the last 25 years, long-term Treasuries have fairly consistently outperformed T-bills by about 4.5% a year.
**Over the last 30 years, large-cap stocks have barely outperformed long-term corporates and long-term Treasuries.
The lesson is that long-term T-bonds have been a decent investment especially considering their risk. However, I’m not sure that level of performance will continue. -
So…How’d Ford Do With Volvo?
Posted by Eddy Elfenbein on March 29th, 2010 at 9:12 amNot so well.
The NYT: January 29, 1999:The Ford Motor Company, by agreeing yesterday to buy the car operations of Volvo A.B. of Sweden for $6.45 billion, has taken its biggest step yet toward becoming a large-scale seller of high-profit luxury cars as well as more humble vehicles like the Escort and pickup trucks.
Ford Motor reached an agreement on Sunday to sell its Volvo subsidiary to a Chinese conglomerate, in the clearest confirmation yet of China’s global ambitions in the auto industry.
The Zhejiang Geely Holding Group, based in Hangzhou, agreed to pay $1.8 billion for Volvo, with $1.6 billion in cash and the rest in a note payable to Ford.Actually, dumping Volvo is a smart move on Ford’s part. I continue to reiterate my call that Ford is the Stock of the Decade. (Hey, why wait?)
-
Bed, Bath & Beyond estimates, price target raised
Posted by Eddy Elfenbein on March 29th, 2010 at 8:39 amFrom MarketWatch:
Home-furnishings retailer Bed, Bath & Beyond Inc.’s profit estimates and price target are raised by Bank of America Merrill Lynch on Monday ahead of the company’s fourth-quarter release on April 7. Broad-based improvement in home goods sector and the lack of its former rival Linens ‘n Things’ liquidation sales in December 2008 should both benefit the retailer, analyst Alan Rifkin said. He raised his target price on the stock to $50 from $44 a share. He raised his fourth-quarter profit estimate to 77 cents a share from 71 cents a share previously with same-store sales projected to rise 6%.
-
Now for Some Top-Line Growth
Posted by Eddy Elfenbein on March 25th, 2010 at 2:35 pmThe Pragmatic Capitalist has a good post on what to expect this earnings season. I agree with the overall thesis–the rally to date has been powered by profit margin expansion.
Lots of naysayers somehow think margin-expansion doesn’t count or it’s somehow illegitimate. It counts but the problem is it can only take you so far. I think we’ve reached that point or it’s very close to us. Now we need some revenue growth.
Another key fact is that earnings estimates have been very low. That’s not going to last either. As expectations rise, earnings beats will fade. I’m on the lookout for companies that provide solid guidance for the latter half of 2010. -
Cornell Drains Fun Out Of Cinderella Run By Explaining How On A Long Enough Timeline The Improbable Becomes Probable
Posted by Eddy Elfenbein on March 25th, 2010 at 12:06 pmSYRACUSE, NY—Despite overcoming long odds as the lowest seed remaining in the NCAA Tournament, Cornell’s basketball team had on Wednesday squandered most of its underdog goodwill by using every opportunity to explain that, given a finite set of possible outcomes and a sufficient period of time, the sheer quantity of opportunities available to accomplish an improbable outcome makes its achievement likely if not almost certain. “It’d be foolish to ascribe any of the properties of a pan-dimensional function space to the NCAA Tournament,” said Cornell center Jeff Foote, who has averaged 14 points per game in the first two rounds. “However, bear in mind that we’re not talking about a null probability space. With eight teams in the Ivy League and 65 in the tournament, you eventually run out of possible permutations. One could even make the case for historical inevitability; we won, so we were always going to win. I think my good friend Baron d’Holbach would agree—that’s decidedly nonzero. Decidedly.” Foote excused himself after the interview upon receiving a fifth rejection-of-transfer letter from Harvard.
-
Are We Still in a Recession?
Posted by Eddy Elfenbein on March 25th, 2010 at 9:52 amOne of the easiest and best indicators of how well the economy is doing is the ISM Purchasing Managers Index.
Here’s a look at the index and you can see how well the dips line up with recessions (the shaded areas):
The recession periods are determined by the National Bureau of Economic Research. They’ve already determined that the recession started in December 2007, but they haven’t yet given us an ending date.
The ISM Index is useful to follow for a numbers of reasons. First, it comes out at the beginning of the month so it’s timely. Also, the index is scaled so that a number above 50 indicates the economy is expanding while below 50 indicates it’s contracting.
Historically, the NBER committee’s dating has followed the ISM closely. (Here’s NBER’s official statement on what they look at when dating an economic cycle.)
Here’s the historic odds that the economy is in recession for each ISM reading:
ISM……………………….Recession Odds
<40...............................93.9% 40-44............................62.5% 45-49............................22.8% 50-54.............................5.2% 55-59.............................1.7% 60+................................3.5% The real drop-off point is approximately 44.4. Any ISM reading at that or less has come during a recession over 80% of the time. At 44.5 or more, the number is just 8%. So where do we stand today? The ISM didn't fall below 44 until September 2008 so NBER was clearly persuaded the weakening jobs market. By June 2009, the ISM jumped above 45 and it's been above 50 for the last seven straight months. This, of course, doesn't mean it will stay that way. Predicting exactly what NBER will do is hard and odds are never perfect. However, going by the historical record it seems that the recession ended around the middle of last year. This may not be exactly welcome news to the 15 million people who are still unemployed. -
Yglesias Contra Wagner
Posted by Eddy Elfenbein on March 24th, 2010 at 6:02 pmMatthew Yglesias has a provocative post in which he claims that the progressive effort to expand the welfare state is now mostly done. There are still lots of items on the progressive agenda but they no longer has to due with expanding the size of government.
Here’s Matthew’s post in its entirety.The End of Big Government Liberalism
For the past 65-70 years—and especially for the past 30 years since the end of the civil rights argument—American politics has been dominated by controversy over the size and scope of the welfare state. Today, that argument is largely over with liberals having largely won. The size of the US public sector is still going to look low by international standards, but this will be a bit misleading since the way the structure of the Affordable Care Act works is to use public money and public regulation to leverage a lot of formally private money. In practice, the United States will still be a small government country compared to Sweden or Denmark or France (which combines Danish-style taxes with a below-the-waterline iceberg of hidden state-directed economic activity), but not compared to the United Kingdom or Spain.
Due to the bill’s almost comically delayed implementation, for several years we’re still going to have a lot of political tussling over it. And even once it’s in place, the system will continue to be debated and tweaked for years to come. But over time, I think American politics will come to look quite different and we’ll look back on this day as a turning point.
The crux of the matter is that progressive efforts to expand the size of the welfare state are basically done. There are big items still on the progressive agenda. But they don’t really involve substantial new expenditures. Instead, you’re looking at carbon pricing, financial regulatory reform, and immigration reform as the medium-term agenda. Most broadly, questions about how to boost growth, how to deliver public services effectively, and about the appropriate balance of social investment between children and the elderly will take center stage. This will probably lead to some realigning of political coalitions. Liberal proponents of reduced trade barriers and increased immigration flows will likely feel emboldened about pushing that agenda, since the policy environment is getting substantially more redistributive and does much more to mitigate risk. Advocates of things like more and better preschooling are going to find themselves competing for funds primarily with the claims made by seniors.This is an interesting point and I hope Matthew is right but I have my doubts. Matthew is basically taking on Wagner’s Law which says that the size of government in a modern industrial state will continue to grow as a share of the economy. Perhaps there’s a Scandinavian upper limit of around 60%. If so, then we’ve still got a long way to go.
I’m inclined to think the political push for greater government isn’t over. If healthcare reform is the first step to a single-payer system, and many smart people think it is, then it fundamentally alters the political system. Healthcare isn’t just another program, it’s a major change in attitude of how the citizen relates to the state. It could be the start of a self-reinforcing cycle of people seeing the government as responsible for other areas of their lives (“hey, I trust them with my health so why not this too”).
Plus, my dystopian side can’t escape pondering the internal contradiction of the welfare state—it needs babies to work but ultimately produces smaller families. That often leads to more immigration which further undermines support for the welfare state. On top of that, military spending is out the window.
Not very happy thoughts, but it’s an interesting point to think about. I believe that Matthew’s flavor of progressivism involves separating wealth creation from wealth distribution. I’m not so certain he’s in the majority.
Julian Sanchez has more.
-
Archives
- July 2026
- June 2026
- May 2026
- April 2026
- March 2026
- February 2026
- January 2026
- December 2025
- November 2025
- October 2025
- September 2025
- August 2025
- July 2025
- June 2025
- May 2025
- April 2025
- March 2025
- February 2025
- January 2025
- December 2024
- November 2024
- October 2024
- September 2024
- August 2024
- July 2024
- June 2024
- May 2024
- April 2024
- March 2024
- February 2024
- January 2024
- December 2023
- November 2023
- October 2023
- September 2023
- August 2023
- July 2023
- June 2023
- May 2023
- April 2023
- March 2023
- February 2023
- January 2023
- December 2022
- November 2022
- October 2022
- September 2022
- August 2022
- July 2022
- June 2022
- May 2022
- April 2022
- March 2022
- February 2022
- January 2022
- December 2021
- November 2021
- October 2021
- September 2021
- August 2021
- July 2021
- June 2021
- May 2021
- April 2021
- March 2021
- February 2021
- January 2021
- December 2020
- November 2020
- October 2020
- September 2020
- August 2020
- July 2020
- June 2020
- May 2020
- April 2020
- March 2020
- February 2020
- January 2020
- December 2019
- November 2019
- October 2019
- September 2019
- August 2019
- July 2019
- June 2019
- May 2019
- April 2019
- March 2019
- February 2019
- January 2019
- December 2018
- November 2018
- October 2018
- September 2018
- August 2018
- July 2018
- June 2018
- May 2018
- April 2018
- March 2018
- February 2018
- January 2018
- December 2017
- November 2017
- October 2017
- September 2017
- August 2017
- July 2017
- June 2017
- May 2017
- April 2017
- March 2017
- February 2017
- January 2017
- December 2016
- November 2016
- October 2016
- September 2016
- August 2016
- July 2016
- June 2016
- May 2016
- April 2016
- March 2016
- February 2016
- January 2016
- December 2015
- November 2015
- October 2015
- September 2015
- August 2015
- July 2015
- June 2015
- May 2015
- April 2015
- March 2015
- February 2015
- January 2015
- December 2014
- November 2014
- October 2014
- September 2014
- August 2014
- July 2014
- June 2014
- May 2014
- April 2014
- March 2014
- February 2014
- January 2014
- December 2013
- November 2013
- October 2013
- September 2013
- August 2013
- July 2013
- June 2013
- May 2013
- April 2013
- March 2013
- February 2013
- January 2013
- December 2012
- November 2012
- October 2012
- September 2012
- August 2012
- July 2012
- June 2012
- May 2012
- April 2012
- March 2012
- February 2012
- January 2012
- December 2011
- November 2011
- October 2011
- September 2011
- August 2011
- July 2011
- June 2011
- May 2011
- April 2011
- March 2011
- February 2011
- January 2011
- December 2010
- November 2010
- October 2010
- September 2010
- August 2010
- July 2010
- June 2010
- May 2010
- April 2010
- March 2010
- February 2010
- January 2010
- December 2009
- November 2009
- October 2009
- September 2009
- August 2009
- July 2009
- June 2009
- May 2009
- April 2009
- March 2009
- February 2009
- January 2009
- December 2008
- November 2008
- October 2008
- September 2008
- August 2008
- July 2008
- June 2008
- May 2008
- April 2008
- March 2008
- February 2008
- January 2008
- December 2007
- November 2007
- October 2007
- September 2007
- August 2007
- July 2007
- June 2007
- May 2007
- April 2007
- March 2007
- February 2007
- January 2007
- December 2006
- November 2006
- October 2006
- September 2006
- August 2006
- July 2006
- June 2006
- May 2006
- April 2006
- March 2006
- February 2006
- January 2006
- December 2005
- November 2005
- October 2005
- September 2005
- August 2005
- July 2005
 Eddy Elfenbein is a Washington, DC-based speaker, portfolio manager and editor of the blog Crossing Wall Street. His