-
Sysco’s Earnings Fall
Posted by Eddy Elfenbein on May 4th, 2009 at 10:55 amWhile the rest of the market is higher today, Sysco (SYY) is down modestly on its earnings report. Earnings were in line at 38 cents a share, down from 40 cents a year ago. Revenue declined 4.5% to $8.7 billion.
Overall, I like Sysco a lot. This is one of the most stable companies on the market. I recently pointed out that the stock has been an amazing performer after a Citigroup exec looked down on Sysco’s employees. -
Weekend Poll
Posted by Eddy Elfenbein on May 1st, 2009 at 8:24 pm -
Fiserv’s Earnings Still Growing
Posted by Eddy Elfenbein on May 1st, 2009 at 3:37 pmFiserv Inc. said its earnings from continuing operations increased in the first quarter, reflecting improved operating margins from the growth in sales of more profitable services.
The Brookfield-based provider of services and technology to the financial services industry reported income from continuing operations of $102 million, or 65 cents per share, compared with $99 million, or 60 cents per share, for the same period a year ago.
Continuing operations excludes the results of the firm’s 51-percent investment in the insurance business, which Fiserv (NASDAQ: FISV) sold in July 2008.
Revenue declined in the quarter to $1.04 billion from $1.31 billion. The decline in revenue was attributed in part to declines in the home equity processing business.
“Our results showcase the strength of our business model as we continue to deliver highly valued products and services across the financial services market,” said Jeffery Yabuki, president and CEO of Fiserv. “In spite of the expected revenue weakness in the quarter, we managed the business to optimize margins and grew adjusted earnings per share 10 percent.”
Fiserv continues to expect full-year 2009 adjusted earnings per share from continuing operations to be within a range of $3.61 to $3.75, which represents growth of 10 to 14 percent compared with $3.29 in 2008.Fiserv (FISV) is a good stock going for a good price. The shares got punished way too much during September and October.
Here’s the earnings call from Seeking Alpha. -
Strangest Graph You’ll See All Day
Posted by Eddy Elfenbein on May 1st, 2009 at 2:59 pmBear with me on this one. The long-term evidence suggests that the stock market’s total return outperforms inflation by about 7% a year (or doubling in real terms every ten years). That’s of course an average—the stock market has been dead flat against inflation for 12 years now.
Here’s a look at the stock market’s real total return, meaning with dividends and adjusted for inflation, divided by a line rising at 7% a year. In other words, a flat line is a real increase of 7% a year.
Just to make things even weirder, I used a log scale. The idea is to get the purest measure of the stock market’s performance.
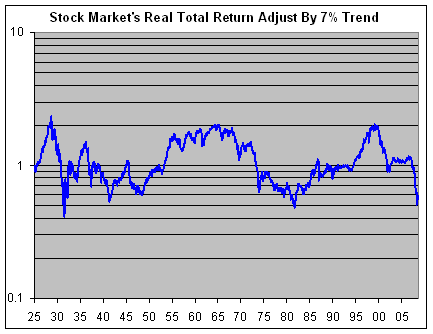
Since earnings growth tends to be fairly consistent, this line is surprisingly similar to a graph of price/earnings ratios. Of course, there’s no guarantee that stocks will continue to outperform inflation by 7% a year.
What I find interesting is that the peaks and valleys seem to line up well. Warning: It’s dangerous to see relationships where none may exist. Still, it’s kind of interesting. I think it’s also interesting to see that there are very long periods of out-performance and under-performance. Stock investing is hardly a game for all seasons. -
The Geography of Jobs
Posted by Eddy Elfenbein on April 30th, 2009 at 12:20 pm -
S&P 500 Heads for Best Month in 17 Years
Posted by Eddy Elfenbein on April 30th, 2009 at 11:07 amSince the March 9th closing low of 676.53, the S&P 500 has tacked on 29% through yesterday and we’ll probably make it to 31% with today’s gain. (BTW, the intra-day low was 666! AH AH AH AH AH!)
This will probably be the best month of the S&P 500 since December 1991. The index is still underwater for the year, but our Buy List is up 8.5% for the year and we’re now running 10% ahead of the market.
Boo-yah! -
AFLAC’s Earnings Jump 20%
Posted by Eddy Elfenbein on April 30th, 2009 at 9:59 amIt’s been a tough year for Aflac’s (AFL) stock, but the company is still delivering on earnings. At one point, the stock was going for about two times this year’s estimate. Now that’s a scared market!
Now we have some results to look at. First-quarter net came in at $1.22 a share, six cents more than consensus. For last year’s Q1, AFL earned 98 cents. So they’re growing, there’s no doubt about that. With Aflac’s cash flow, there’s no need for them to dump any holdings at whatever price they can get.
Wall Street got itself freaked out because Aflac had investments in these “hybrid securities” in a lot of bum European banks. The company has said there’s nothing to worry about. Wall Street, however, is still very clearly worried.Shareholders equity, a measure of assets minus liabilities, fell 21 percent to $5.2 billion as of March 31 from $6.6 billion at the end of 2008 on the declining value of holdings. The net unrealized loss on investments widened to $3 billion compared with $1.2 billion three months earlier. Unrealized losses, which don’t count against earnings, are monitored by ratings firms, regulators and investors as a measure of financial strength.
North American insurers posted more than $190 billion of writedowns and unrealized losses tied to the collapse of the mortgage market since the beginning of 2007, with Aflac accounting for $3.6 billion through the end of last year.
Aflac, whose policies supplement work and government- sponsored health-insurance plans, holds hybrid securities in 38 issuers spread across 15 countries across Europe and in Japan and Australia, Aflac said in February. About 20 percent of the portfolio is in the U.K., Aflac said.
In Japan, Aflac’s biggest market, the company sold new policies worth 27.5 billion yen ($293 million) falling from $264 million in the same period a year earlier. Premium income rose to $3 billion in the quarter from $2.6 billion as the yen strengthened against the dollar a year earlier.
U.S. sales of new policies fell to $351 million from $353 million first quarter of 2008, Aflac said in its statement.As far as future guidance, the company expects 2009 operating EPS to grow at the low end of their 13% to 15% target, which translates to about $4.51 a share. That means the stock is trading at 6.6 times forward earnings. Of course, movements in the yen can affect things a lot. For Q2, Aflac sees operating EPS ranging for $1.11 to $1.14. At the current price, the stock yields 4.1%. As today’s report shows, Aflac is an excellent stock to own.
-
Today’s Fed Statement
Posted by Eddy Elfenbein on April 29th, 2009 at 2:20 pmInformation received since the Federal Open Market Committee met in March indicates that the economy has continued to contract, though the pace of contraction appears to be somewhat slower. Household spending has shown signs of stabilizing but remains constrained by ongoing job losses, lower housing wealth, and tight credit. Weak sales prospects and difficulties in obtaining credit have led businesses to cut back on inventories, fixed investment, and staffing. Although the economic outlook has improved modestly since the March meeting, partly reflecting some easing of financial market conditions, economic activity is likely to remain weak for a time. Nonetheless, the Committee continues to anticipate that policy actions to stabilize financial markets and institutions, fiscal and monetary stimulus, and market forces will contribute to a gradual resumption of sustainable economic growth in a context of price stability.
In light of increasing economic slack here and abroad, the Committee expects that inflation will remain subdued. Moreover, the Committee sees some risk that inflation could persist for a time below rates that best foster economic growth and price stability in the longer term.
In these circumstances, the Federal Reserve will employ all available tools to promote economic recovery and to preserve price stability. The Committee will maintain the target range for the federal funds rate at 0 to 1/4 percent and anticipates that economic conditions are likely to warrant exceptionally low levels of the federal funds rate for an extended period. As previously announced, to provide support to mortgage lending and housing markets and to improve overall conditions in private credit markets, the Federal Reserve will purchase a total of up to $1.25 trillion of agency mortgage-backed securities and up to $200 billion of agency debt by the end of the year. In addition, the Federal Reserve will buy up to $300 billion of Treasury securities by autumn. The Committee will continue to evaluate the timing and overall amounts of its purchases of securities in light of the evolving economic outlook and conditions in financial markets. The Federal Reserve is facilitating the extension of credit to households and businesses and supporting the functioning of financial markets through a range of liquidity programs. The Committee will continue to carefully monitor the size and composition of the Federal Reserve’s balance sheet in light of financial and economic developments.
Voting for the FOMC monetary policy action were: Ben S. Bernanke, Chairman; William C. Dudley, Vice Chairman; Elizabeth A. Duke; Charles L. Evans; Donald L. Kohn; Jeffrey M. Lacker; Dennis P. Lockhart; Daniel K. Tarullo; Kevin M. Warsh; and Janet L. Yellen. -
S&P 500 and Earnings
Posted by Eddy Elfenbein on April 28th, 2009 at 3:28 pmHere’s a look at the S&P 500 (black line, left scale) over the last few years with its earnings (gold line, right scale).
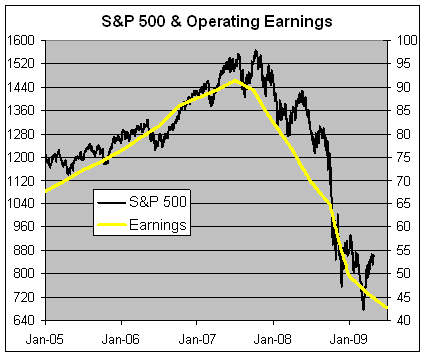
The two lines are scaled at 16 to 1, meaning when the lines cross the market’s P/E ratio is 16. I used 16 because it seems that the market has tracked that fairly well for the past few years. This market top wasn’t marked by outrageous earnings multiples. The values were fine it was the fundamentals that were shaky.
Two points to note. I used to operating earnings. That seems to get some people bent out of shape but it’s a much better tool for looking at the market as a whole. Also, AIG’s massive loss took out $5.13 from earnings in Q4, so that distorts the picture a little. -
Poll Update
Posted by Eddy Elfenbein on April 28th, 2009 at 1:44 pmThanks to everyone who participated in our last poll.
With over 200 votes cast, the median seems to be squarely in the 20% to 25% bracket. There’s almost exactly the same number of votes above as there is below.
I realize that the “framing” of brackets answers probably violates every law of polling. Still, I was curious to see what my readers thought.
I’m surprised by how high the result is. A rate of 22% or 23% is fairly high compared with current law. I would have assumed CWS readers were a strong anti-lot.
-
Archives
- June 2026
- May 2026
- April 2026
- March 2026
- February 2026
- January 2026
- December 2025
- November 2025
- October 2025
- September 2025
- August 2025
- July 2025
- June 2025
- May 2025
- April 2025
- March 2025
- February 2025
- January 2025
- December 2024
- November 2024
- October 2024
- September 2024
- August 2024
- July 2024
- June 2024
- May 2024
- April 2024
- March 2024
- February 2024
- January 2024
- December 2023
- November 2023
- October 2023
- September 2023
- August 2023
- July 2023
- June 2023
- May 2023
- April 2023
- March 2023
- February 2023
- January 2023
- December 2022
- November 2022
- October 2022
- September 2022
- August 2022
- July 2022
- June 2022
- May 2022
- April 2022
- March 2022
- February 2022
- January 2022
- December 2021
- November 2021
- October 2021
- September 2021
- August 2021
- July 2021
- June 2021
- May 2021
- April 2021
- March 2021
- February 2021
- January 2021
- December 2020
- November 2020
- October 2020
- September 2020
- August 2020
- July 2020
- June 2020
- May 2020
- April 2020
- March 2020
- February 2020
- January 2020
- December 2019
- November 2019
- October 2019
- September 2019
- August 2019
- July 2019
- June 2019
- May 2019
- April 2019
- March 2019
- February 2019
- January 2019
- December 2018
- November 2018
- October 2018
- September 2018
- August 2018
- July 2018
- June 2018
- May 2018
- April 2018
- March 2018
- February 2018
- January 2018
- December 2017
- November 2017
- October 2017
- September 2017
- August 2017
- July 2017
- June 2017
- May 2017
- April 2017
- March 2017
- February 2017
- January 2017
- December 2016
- November 2016
- October 2016
- September 2016
- August 2016
- July 2016
- June 2016
- May 2016
- April 2016
- March 2016
- February 2016
- January 2016
- December 2015
- November 2015
- October 2015
- September 2015
- August 2015
- July 2015
- June 2015
- May 2015
- April 2015
- March 2015
- February 2015
- January 2015
- December 2014
- November 2014
- October 2014
- September 2014
- August 2014
- July 2014
- June 2014
- May 2014
- April 2014
- March 2014
- February 2014
- January 2014
- December 2013
- November 2013
- October 2013
- September 2013
- August 2013
- July 2013
- June 2013
- May 2013
- April 2013
- March 2013
- February 2013
- January 2013
- December 2012
- November 2012
- October 2012
- September 2012
- August 2012
- July 2012
- June 2012
- May 2012
- April 2012
- March 2012
- February 2012
- January 2012
- December 2011
- November 2011
- October 2011
- September 2011
- August 2011
- July 2011
- June 2011
- May 2011
- April 2011
- March 2011
- February 2011
- January 2011
- December 2010
- November 2010
- October 2010
- September 2010
- August 2010
- July 2010
- June 2010
- May 2010
- April 2010
- March 2010
- February 2010
- January 2010
- December 2009
- November 2009
- October 2009
- September 2009
- August 2009
- July 2009
- June 2009
- May 2009
- April 2009
- March 2009
- February 2009
- January 2009
- December 2008
- November 2008
- October 2008
- September 2008
- August 2008
- July 2008
- June 2008
- May 2008
- April 2008
- March 2008
- February 2008
- January 2008
- December 2007
- November 2007
- October 2007
- September 2007
- August 2007
- July 2007
- June 2007
- May 2007
- April 2007
- March 2007
- February 2007
- January 2007
- December 2006
- November 2006
- October 2006
- September 2006
- August 2006
- July 2006
- June 2006
- May 2006
- April 2006
- March 2006
- February 2006
- January 2006
- December 2005
- November 2005
- October 2005
- September 2005
- August 2005
- July 2005
 Eddy Elfenbein is a Washington, DC-based speaker, portfolio manager and editor of the blog Crossing Wall Street. His