-
This Just In…
Posted by Eddy Elfenbein on July 1st, 2008 at 3:18 pm -
Worst First Halves Since 1971
Posted by Eddy Elfenbein on July 1st, 2008 at 3:05 pmHere are the ten worst first halves since 1971, going by the S&P 500’s total return:
Year…………………Gain
2002………………-13.16%
2008………………-11.91%
1973………………-10.38%
1974………………-10.17%
1982………………-7.83%
2001………………-6.70%
1984………………-4.90%
1977………………-4.38%
1994………………-3.39%
1981………………-0.95% -
Grasso Wins
Posted by Eddy Elfenbein on July 1st, 2008 at 2:51 pmIt’s hard to see multi-millionaire as victims, but Eliot Spitzer’s (aka Client #9) crusade against Dick Grasso was contemptible and an abuse of the legal system. The case against him was thrown out today. Last week, the court threw out four of the six claims against Grasso. The other two were dismissed today.
The New York Stock Exchange awarded Grasso a pay package worth $190 million. Is that too high? Probably. Is it illegal? Of course not.“My reaction is, I told you so,” Langone said today in a telephone interview. “There was never a case here. What more can we say? The enormous waste was a travesty.”
One final note on Mr. Spitzer. When he checked in the Mayflower Hotel for his meetings with Ms. Dupree, he used the nom de bork, George Fox. That’s one his friend’s names.
Classy guy. -
I Think this Chart Sums It Up Well
Posted by Eddy Elfenbein on July 1st, 2008 at 10:31 am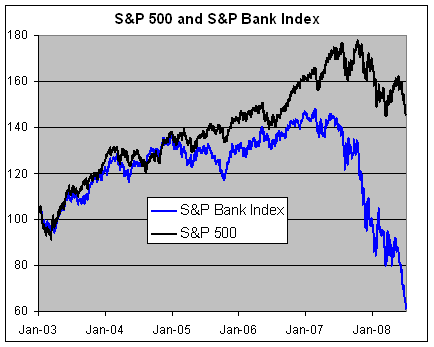
-
Who’s to Blame?
Posted by Eddy Elfenbein on July 1st, 2008 at 9:40 amWho’s responsible for all the problems in the financial sector? Stephen Schwarzman has an novel idea — blame the new accounting rule, FASB 157:
FAS 157 represents the so-called fair value rule put into effect by the Federal Accounting Standards Board, the bookkeeping rule makers. It requires that certain assets held by financial companies, including tricky investments linked to mortgages and other kinds of debt, be marked to market. In other words, you have to value the assets at the price you could get for them if you sold them right now on the open market.
The idea seems noble enough. The rule forces banks to mark to market, rather to some theoretical price calculated by a computer — a system often derided as “mark to make-believe.” (Occasionally, for certain types of assets, the rule allows for using a model — and yes, the potential for manipulation too.)
But here’s the problem: Sometimes, there is no market — not for toxic investments like collateralized debt obligations, or C.D.O.’s, filled with subprime mortgages. No one will touch this stuff. And if there is no market, FAS 157 says, a bank must mark the investment’s value down, possibly all the way to zero.
That partly explains why big banks had to write down countless billions in C.D.O. exposure. The losses are, at least in part, theoretical. Nonetheless, the banks, in response, are bringing down their leverage levels and running to the desert to raise additional capital, often at shareholders’ expense. -
The Buy List’s Mid-Year Report
Posted by Eddy Elfenbein on June 30th, 2008 at 9:53 pmUgh, we choked at the last minute! Going into today, the Crossing Wall Street Buy List had a comfortable lead over the S&P 500. But today, we collapsed. The S&P 500 rose by 0.13%, but our Buy List lost (yuck!) -1.49%.
Today was the worst relative performance for us all year.
For the year, the S&P 500 is off by -12.83% while our Buy List is now down -13.47%. The Buy List’s daily volatility is 6.27% greater than the S&P 500.
Including dividends, the Buy List is down -13.16% while the S&P 500 is down by -11.91%. Roughly, that translates to an annual dividend yield of 2.12% for the S&P 500 and 0.72% for us.
If you recall, the rules of the Buy List let me select 20 stocks at the beginning of the year and I’m not allowed to make any changes throughout the year. Right now, just three of our 20 stocks are in the black. The biggest loser by far is Unitedhealth Group (UNH), which is down by nearly 55%.
Here’s a look at how all 20 stocks have done.
Stock……………………………………Profit
Medtronic………………………………2.94%
FactSet Research Systems……….1.18%
Aflac……………………………………..0.27%
Leucadia……………………………….-0.34%
Amphenol……………………………..-3.21%
Donaldson…………………………….-3.75%
Bed Bath & Beyond…………………-4.39%
Joseph A. Banks……………………..-5.98%
Clarcor………………………………….-7.56%
Sysco……………………………………-11.86%
Danaher………………………………..-11.90%
Stryker………………………………….-15.85%
Fiserv……………………………………-18.24%
Moog…………………………………….-18.71%
WR Berkley……………………………-18.95%
Lincare………………………………….-19.23%
Harley-Davidson………………………-22.37%
SEI Investments………………………-26.89%
Nicholas Financial…………………….-29.60%
UnitedHealth……………………………-54.90% -
Let’s Hear It for Round Numbers
Posted by Eddy Elfenbein on June 30th, 2008 at 4:29 pmThe Dow closed today at 11,350.01 and the S&P 500 closed at 1280.00.
-
The Oil Boom Comes to Beverly Hills
Posted by Eddy Elfenbein on June 30th, 2008 at 1:10 pmThis is news to me. There are oil wells in Beverly Hills!
“In the Middle East you might have 300 barrels of oil per cubic acre, but in the Los Angeles Basin you might have 4,000 barrels per cubic acre,” says Mike Edwards, vice president of Denver-based Venoco Inc., which has 24 active wells in the Beverly Hills area, including one alongside Beverly Hills High School. “In terms of the land that produces oil, the basin is very rich.”
Come to think of it, I really doubt there’s much oil in Appalachia.
-
Worst June Since the Depression
Posted by Eddy Elfenbein on June 30th, 2008 at 12:02 pmWho’s ready for this June to end? Count me in!
This looks to be the worst June for stocks in 78 years. Here are the S&P 500’s total return for the 20 worst Junes since 1928:
Jun-30……..-16.24%
Jun-08……..-8.55% (through Friday)
Jun-62……..-8.03%
Jun-02……..-7.12%
Jun-39……..-6.07%
Jun-50……..-5.49%
Jun-69……..-5.42%
Jun-37……..-5.04%
Jun-70……..-4.82%
Jun-65……..-4.73%
Jun-91……..-4.57%
Jun-28……..-3.85%
Jun-46……..-3.70%
Jun-61……..-2.75%
Jun-94……..-2.47%
Jun-01……..-2.43%
Jun-51……..-2.28%
Jun-72……..-2.06%
Jun-63……..-1.88%
Jun-82……..-1.74% -
Behavioral Economics
Posted by Eddy Elfenbein on June 30th, 2008 at 11:53 amIf you want to read a long (and I mean looong) article on behavioral economics, then I suggest this 10,000-word opus by Alan Wolfe for The New Republic. The article is a look at two books, Happiness: A Revolution in Economics and Predictably Irrational: The Hidden Forces that Shape Our Decisions, but it will tell you a lot of the emergence of behavioral economics. I disagree with some parts and I think he frames the issues in an oversimplified way. Still, it’s an interesting read.
Here’s a sample:Ariely and his colleagues set up a stand and offer Lindt truffles for 15 cents and Hershey’s Kisses for a penny: 73 percent of their customers choose the former, 27 percent the latter. Then they lower the price of the truffle to 14 cents and offer the Hershey Kiss for free, and now 69 percent choose the Kiss and only 31 percent the truffle. Calculating utility cannot explain this result. In both cases, the cost difference is identical. So it seems that we attach an almost mystical meaning to the idea of getting something for nothing. Zero is not just another number. It plays tricks with our rational minds.
-
Archives
- October 2026
- September 2026
- August 2026
- July 2026
- June 2026
- May 2026
- April 2026
- March 2026
- February 2026
- January 2026
- December 2025
- November 2025
- October 2025
- September 2025
- August 2025
- July 2025
- June 2025
- May 2025
- April 2025
- March 2025
- February 2025
- January 2025
- December 2024
- November 2024
- October 2024
- September 2024
- August 2024
- July 2024
- June 2024
- May 2024
- April 2024
- March 2024
- February 2024
- January 2024
- December 2023
- November 2023
- October 2023
- September 2023
- August 2023
- July 2023
- June 2023
- May 2023
- April 2023
- March 2023
- February 2023
- January 2023
- December 2022
- November 2022
- October 2022
- September 2022
- August 2022
- July 2022
- June 2022
- May 2022
- April 2022
- March 2022
- February 2022
- January 2022
- December 2021
- November 2021
- October 2021
- September 2021
- August 2021
- July 2021
- June 2021
- May 2021
- April 2021
- March 2021
- February 2021
- January 2021
- December 2020
- November 2020
- October 2020
- September 2020
- August 2020
- July 2020
- June 2020
- May 2020
- April 2020
- March 2020
- February 2020
- January 2020
- December 2019
- November 2019
- October 2019
- September 2019
- August 2019
- July 2019
- June 2019
- May 2019
- April 2019
- March 2019
- February 2019
- January 2019
- December 2018
- November 2018
- October 2018
- September 2018
- August 2018
- July 2018
- June 2018
- May 2018
- April 2018
- March 2018
- February 2018
- January 2018
- December 2017
- November 2017
- October 2017
- September 2017
- August 2017
- July 2017
- June 2017
- May 2017
- April 2017
- March 2017
- February 2017
- January 2017
- December 2016
- November 2016
- October 2016
- September 2016
- August 2016
- July 2016
- June 2016
- May 2016
- April 2016
- March 2016
- February 2016
- January 2016
- December 2015
- November 2015
- October 2015
- September 2015
- August 2015
- July 2015
- June 2015
- May 2015
- April 2015
- March 2015
- February 2015
- January 2015
- December 2014
- November 2014
- October 2014
- September 2014
- August 2014
- July 2014
- June 2014
- May 2014
- April 2014
- March 2014
- February 2014
- January 2014
- December 2013
- November 2013
- October 2013
- September 2013
- August 2013
- July 2013
- June 2013
- May 2013
- April 2013
- March 2013
- February 2013
- January 2013
- December 2012
- November 2012
- October 2012
- September 2012
- August 2012
- July 2012
- June 2012
- May 2012
- April 2012
- March 2012
- February 2012
- January 2012
- December 2011
- November 2011
- October 2011
- September 2011
- August 2011
- July 2011
- June 2011
- May 2011
- April 2011
- March 2011
- February 2011
- January 2011
- December 2010
- November 2010
- October 2010
- September 2010
- August 2010
- July 2010
- June 2010
- May 2010
- April 2010
- March 2010
- February 2010
- January 2010
- December 2009
- November 2009
- October 2009
- September 2009
- August 2009
- July 2009
- June 2009
- May 2009
- April 2009
- March 2009
- February 2009
- January 2009
- December 2008
- November 2008
- October 2008
- September 2008
- August 2008
- July 2008
- June 2008
- May 2008
- April 2008
- March 2008
- February 2008
- January 2008
- December 2007
- November 2007
- October 2007
- September 2007
- August 2007
- July 2007
- June 2007
- May 2007
- April 2007
- March 2007
- February 2007
- January 2007
- December 2006
- November 2006
- October 2006
- September 2006
- August 2006
- July 2006
- June 2006
- May 2006
- April 2006
- March 2006
- February 2006
- January 2006
- December 2005
- November 2005
- October 2005
- September 2005
- August 2005
- July 2005
 Eddy Elfenbein is a Washington, DC-based speaker, portfolio manager and editor of the blog Crossing Wall Street. His