-
The Dow/Nasdaq Ratio Hits a 3-1/2 Year High
Posted by Eddy Elfenbein on March 4th, 2008 at 3:44 pmThe Dow/Nasdaq ratio closed yesterday at 5.428, which just barely passed the peak from August 8, 2006. The ratio is now at its highest level in 3-1/2 years.
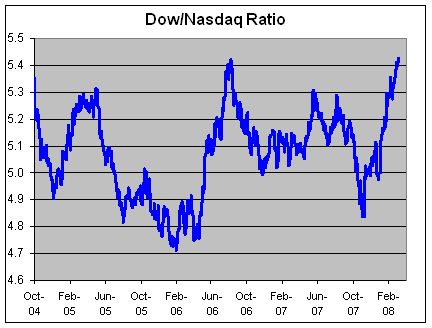
I should add that the ratio has been very steady over the past few years. Here’s a chart of the ratio going back to 1980:
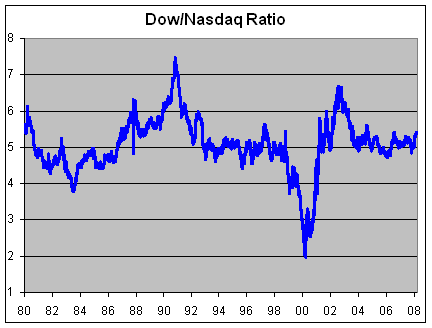
Over the last 15 years, that ratio has been between 4.5 and 5.5 for 74% of the time. -
The S&P 500 Is Close to a New Low
Posted by Eddy Elfenbein on March 4th, 2008 at 2:45 pmAnother rough day has pushed the S&P 500 below 1310. The lowest close since the October 9 high (1,565.15) came on January 22 when the S&P 500 closed at 1310.5. In other words, the bear market may not be over. Of course, it’s hard to tell when it truly is over.
-
The Yield Curve Unravels
Posted by Eddy Elfenbein on March 4th, 2008 at 12:46 pmI ran a chart like this a few weeks ago, but it’s worth revisiting.
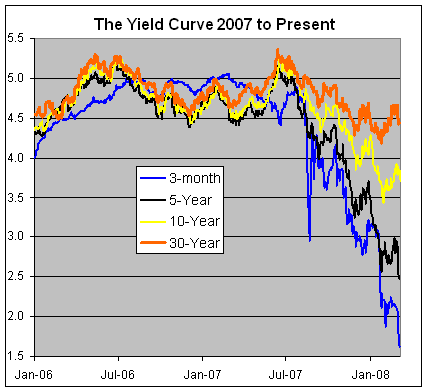
The collapse of the yield curve is simply stunning. Not that long ago, all of the lines were fairly stable. Now, they’re plunging (at least, the blue and black) and there seems to be no end in sight. -
More on Efficient Markets
Posted by Eddy Elfenbein on March 3rd, 2008 at 2:54 pmPeople spend more time on buying a toaster than on buying a house.
Of course, they’re really nice toasters. -
The Bubblephobes
Posted by Eddy Elfenbein on March 3rd, 2008 at 2:32 pmRobert Shiller writes in yesterday’s NYT about the collective failure to see the housing bubble. Obviously, some folks will insist that they saw everything coming, and it was perfectly predictable.
One of the problems I have with this idea, and I’ve mention this before with Shiller’s other work, is the curious idea that a bubble is somehow a problem that needs to be fixed.
Just because prices go up very rapidly doesn’t mean something is a bubble. Oddly, the only time we can be certain that it’s a bubble is when the air deflates and the asset prices go down. In other words, to the bubble-phobes, the problem isn’t the bubble, it’s the downside, and we only know what after the fact.
How can we be sure it’s a bubble when an asset inflates? In the 1950s, stock prices soared and they never really came back down. The phrase “permanently high plateau” hasn’t had a good record since the 1920s, but I think that’s an accurate description of what happened in the 1950s.
Is gold a bubble right now? What about oil? Or the euro? Or could it be that we’re simply adjusting to a new era of commodity prices? I don’t know and for now, I’m happy to consider these open questions. I will note, however, that adjusted for inflation, commodity prices have historically plunged.
For me, the best definition of a bubble is a price that’s going up because it’s going up. The certainly happened with tech stocks in the 1990s. But I’d rather not have Alan Greenspan tell me what the prices of tech stocks ought to be.
There’s also the counter argument that bubbles aren’t merely not bad, but actively good. In his book, Pop!: Why Bubbles Are Great For The Economy, Daniel Gross writes how bubbles and their ugly aftermath have often helped lay the ground work for future prosperity. A bubble creates enormous excess capacity which can later be used to bring down the cost of apply a new technology.
Shiller writes, “The failure to recognize the housing bubble is the core reason for the collapsing house of cards we are seeing in financial markets in the United States and around the world.” Actually, the collapsing house of cards is the recognition of the bubble. After all, the bubble could have gone for another three years. Perhaps free enterprise spot it early and cut it off. Hooray for markets! -
Oil Hits Inflation-Adjusted High
Posted by Eddy Elfenbein on March 3rd, 2008 at 1:00 pmThe WSJ reports that oil is at an all-time high even after adjusting for inflation.
Crude-oil futures have topped the inflation-adjusted high set in April 1980, as the dollar’s descent continues to send investors into the commodities markets.
Light, sweet crude for April delivery traded as high as $103.95 a barrel on the New York Mercantile Exchange, topping a 1980 trade of $103.76 in 2008 dollars. The April contract recently traded at $103.59. Brent crude on the ICE futures exchange was trading up $1.72 at $101.82.
The 1980 record predates the creation of the crude futures market on Nymex, and represents a deal on the cash market.
Oil began to take off Monday morning after the U.S. dollar fell from a stable position overnight against the euro. Shortly after 9 a.m. EST, the dollar hit a new low, and oil began to rise rapidly. A fresh record for crude in real dollars came minutes later, and deals above the 1980 high were completed at about 9:55 a.m. EST.
“It doesn’t look like it’s going to come down anytime soon,” said Phil Flynn, an analyst at Alaron Trading Corp. in Chicago. -
Buffett on the Dream Business
Posted by Eddy Elfenbein on March 3rd, 2008 at 10:50 amMore from the Chairman’s Letter (page 8):
Let’s look at the prototype of a dream business, our own See’s Candy. The boxed-chocolates industry in which it operates is unexciting: Per-capita consumption in the U.S. is extremely low and doesn’t grow. Many once-important brands have disappeared, and only three companies have earned more than token profits over the last forty years. Indeed, I believe that See’s, though it obtains the bulk of its revenues from only a few states, accounts for nearly half of the entire industry’s earnings.
At See’s, annual sales were 16 million pounds of candy when Blue Chip Stamps purchased the company in 1972. (Charlie and I controlled Blue Chip at the time and later merged it into Berkshire.) Last year See’s sold 31 million pounds, a growth rate of only 2% annually. Yet its durable competitive advantage, built by the See’s family over a 50-year period, and strengthened subsequently by Chuck Huggins and Brad Kinstler, has produced extraordinary results for Berkshire.
We bought See’s for $25 million when its sales were $30 million and pre-tax earnings were less than $5 million. The capital then required to conduct the business was $8 million. (Modest seasonal debt was also needed for a few months each year.) Consequently, the company was earning 60% pre-tax on invested capital. Two factors helped to minimize the funds required for operations. First, the product was sold for cash, and that eliminated accounts receivable. Second, the production and distribution cycle was short, which minimized inventories.
Last year See’s sales were $383 million, and pre-tax profits were $82 million. The capital now required to run the business is $40 million. This means we have had to reinvest only $32 million since 1972 to handle the modest physical growth – and somewhat immodest financial growth – of the business. In the meantime pre-tax earnings have totaled $1.35 billion. All of that, except for the $32 million, has been sent to Berkshire (or, in the early years, to Blue Chip). After paying corporate taxes on the profits, we have used the rest to buy other attractive businesses. Just as Adam and Eve kick-started an activity that led to six billion humans, See’s has given birth to multiple new streams of cash for us. (The biblical command to “be fruitful and multiply” is one we take seriously at Berkshire.)
There aren’t many See’s in Corporate America. Typically, companies that increase their earnings from $5 million to $82 million require, say, $400 million or so of capital investment to finance their growth. That’s because growing businesses have both working capital needs that increase in proportion to sales growth and significant requirements for fixed asset investments.
A company that needs large increases in capital to engender its growth may well prove to be a satisfactory investment. There is, to follow through on our example, nothing shabby about earning $82 million pre-tax on $400 million of net tangible assets. But that equation for the owner is vastly different from the See’s situation. It’s far better to have an ever-increasing stream of earnings with virtually no major capital requirements. Ask Microsoft or Google.(Hat Tip: Climateer Investing)
-
Yes, Virginia…I mean No, Virginia…I mean…
Posted by Eddy Elfenbein on March 3rd, 2008 at 10:40 amFrom page 18 of Buffett’s Chairman’s Letter:
(Yes, Virginia, you can occasionally find markets that are ridiculously inefficient – or at least you can find them anywhere except at the finance departments of some leading business schools.)
From Megan McArdle’s Asymmetrical Information:
Yes, Virginia, markets are efficient.
-
Buffett’s Letter
Posted by Eddy Elfenbein on March 1st, 2008 at 12:09 amHere’s the yearly Chairman’s Letter to Berkshire shareholders. It’s always worth a read.
Here are the letters going back 30 years. -
A Look at Government Spending
Posted by Eddy Elfenbein on February 29th, 2008 at 11:52 pmEach year, the Congressional Budget Office releases its report on the federal budget which also includes historical stats. What I find interesting is that over the past 30 year, non-defense spending by the federal government, as a percent of GDP, hasn’t varied that much.
I don’t mean to say that it hasn’t varied at all—it certainly has. But the stats are much more stable than you would think if you went by political rhetoric.
Since 1976, the amount of federal spending, except for defense, has averaged about one-sixth of GDP. The numbers haven’t strayed too far from the average. About two-thirds of the time, spending has been between 15.9% and 17.1%.
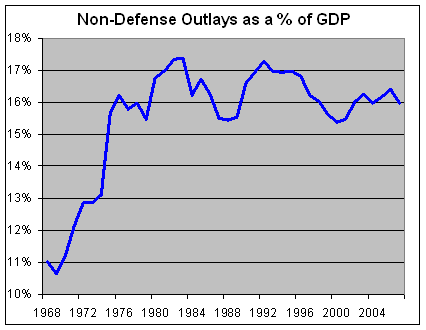
I think it’s worth considering that if we had repealed all the laws regarding our budget process, and instead applied very strict mechanistic rules, the outcome would have been surprisingly similar.
Interestingly, the amount of federal debt held by the public as a percent of GDP has declined slightly over the past two year.
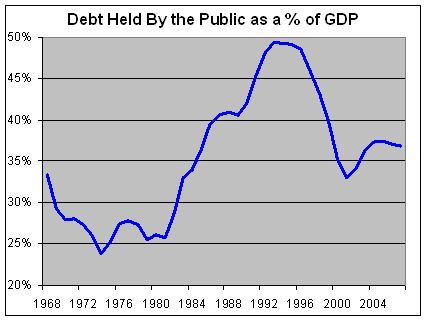
Here’s the data.
-
Archives
- July 2026
- June 2026
- May 2026
- April 2026
- March 2026
- February 2026
- January 2026
- December 2025
- November 2025
- October 2025
- September 2025
- August 2025
- July 2025
- June 2025
- May 2025
- April 2025
- March 2025
- February 2025
- January 2025
- December 2024
- November 2024
- October 2024
- September 2024
- August 2024
- July 2024
- June 2024
- May 2024
- April 2024
- March 2024
- February 2024
- January 2024
- December 2023
- November 2023
- October 2023
- September 2023
- August 2023
- July 2023
- June 2023
- May 2023
- April 2023
- March 2023
- February 2023
- January 2023
- December 2022
- November 2022
- October 2022
- September 2022
- August 2022
- July 2022
- June 2022
- May 2022
- April 2022
- March 2022
- February 2022
- January 2022
- December 2021
- November 2021
- October 2021
- September 2021
- August 2021
- July 2021
- June 2021
- May 2021
- April 2021
- March 2021
- February 2021
- January 2021
- December 2020
- November 2020
- October 2020
- September 2020
- August 2020
- July 2020
- June 2020
- May 2020
- April 2020
- March 2020
- February 2020
- January 2020
- December 2019
- November 2019
- October 2019
- September 2019
- August 2019
- July 2019
- June 2019
- May 2019
- April 2019
- March 2019
- February 2019
- January 2019
- December 2018
- November 2018
- October 2018
- September 2018
- August 2018
- July 2018
- June 2018
- May 2018
- April 2018
- March 2018
- February 2018
- January 2018
- December 2017
- November 2017
- October 2017
- September 2017
- August 2017
- July 2017
- June 2017
- May 2017
- April 2017
- March 2017
- February 2017
- January 2017
- December 2016
- November 2016
- October 2016
- September 2016
- August 2016
- July 2016
- June 2016
- May 2016
- April 2016
- March 2016
- February 2016
- January 2016
- December 2015
- November 2015
- October 2015
- September 2015
- August 2015
- July 2015
- June 2015
- May 2015
- April 2015
- March 2015
- February 2015
- January 2015
- December 2014
- November 2014
- October 2014
- September 2014
- August 2014
- July 2014
- June 2014
- May 2014
- April 2014
- March 2014
- February 2014
- January 2014
- December 2013
- November 2013
- October 2013
- September 2013
- August 2013
- July 2013
- June 2013
- May 2013
- April 2013
- March 2013
- February 2013
- January 2013
- December 2012
- November 2012
- October 2012
- September 2012
- August 2012
- July 2012
- June 2012
- May 2012
- April 2012
- March 2012
- February 2012
- January 2012
- December 2011
- November 2011
- October 2011
- September 2011
- August 2011
- July 2011
- June 2011
- May 2011
- April 2011
- March 2011
- February 2011
- January 2011
- December 2010
- November 2010
- October 2010
- September 2010
- August 2010
- July 2010
- June 2010
- May 2010
- April 2010
- March 2010
- February 2010
- January 2010
- December 2009
- November 2009
- October 2009
- September 2009
- August 2009
- July 2009
- June 2009
- May 2009
- April 2009
- March 2009
- February 2009
- January 2009
- December 2008
- November 2008
- October 2008
- September 2008
- August 2008
- July 2008
- June 2008
- May 2008
- April 2008
- March 2008
- February 2008
- January 2008
- December 2007
- November 2007
- October 2007
- September 2007
- August 2007
- July 2007
- June 2007
- May 2007
- April 2007
- March 2007
- February 2007
- January 2007
- December 2006
- November 2006
- October 2006
- September 2006
- August 2006
- July 2006
- June 2006
- May 2006
- April 2006
- March 2006
- February 2006
- January 2006
- December 2005
- November 2005
- October 2005
- September 2005
- August 2005
- July 2005
 Eddy Elfenbein is a Washington, DC-based speaker, portfolio manager and editor of the blog Crossing Wall Street. His