-
Merrill Lynch Called It
Posted by Eddy Elfenbein on March 2nd, 2007 at 12:50 pmThey didn’t get it right in the clown’s mouth, but one month ago, Merrill had an inkling of what was to come.
The bank said 2007 would be the “year of the dividend”, with fear returning as the VIX and VDAX volatility indexes – widely used in option trading – rise from record lows.
“We think global interest rates are going to rise a lot more than investors are discounting, and this is a worrisome outlook for profits,” said Khuram Chaudhry, chief European strategist.
“We’ve seen liquidity everywhere, in equities, property, bonds. It’s been a one-way bet for investors, and they’ve taken on a lot of risk. But they’re not looking beyond the news to the slow drip-drip effect of interest rates. It matters when central banks tighten monetary policy,” he said.(H/T: B-Riz.)
-
Keeping the Y-Axis Real
Posted by Eddy Elfenbein on March 2nd, 2007 at 12:42 pmDealBreaker looks at Tuesday’s “plunge” with some perspective. Here’s how the market has done YTD:
-
Buffett’s Letter to Shareholders
Posted by Eddy Elfenbein on March 2nd, 2007 at 7:53 amHere’s this year’s letter to Berkshire shareholders from Warren Buffett.
You can see all of the letters for the last 30 years here.
Four years ago, Buffett warned that “derivatives are financial weapons of mass destruction.” But he may be changing his tune. In this year’s letter, he writes: “Why, you may wonder, are we fooling around with such potentially toxic material? The answer is that derivatives, just like stocks and bonds, are sometimes wildly mispriced.” -
The Newest Scapegoat: the Stars
Posted by Eddy Elfenbein on March 2nd, 2007 at 7:02 amFrom Reuters:
Think Wall Street has seen the worst of the sell-off? Not if the stars are right.
That is the latest prognostication from financial astrologer Arch Crawford, who predicts the direction of financial markets using a mix of technical and fundamental analysis paired with close examination of planetary cycles.
His current assessment: A lunar eclipse and an opposition of Saturn and Neptune are in the cosmic cards this week. Combined with some bearish market fundamentals, that should keep the world’s biggest stock market under a cloud, the stargazer wrote to clients.I’d also like to add that when the moon is in the Seventh House, and Jupiter aligns with Mars, peace will guide the planets, and love will steer the stars.*
Naturally, I don’t see this happening anytime soon. But if it does happen, you’ll know what to expect.
*Past performance is not a guarantee of future results. -
Dell. Still Sucking.
Posted by Eddy Elfenbein on March 1st, 2007 at 9:52 pmDell (DELL) just reported after the close. The company earned 30 cents a share, one-third less than last year’s fourth quarter. That was a penny ahead of Wall Street’s forecast, but six cents a share came from not paying employee bonuses.
Just look at Dell’s trailing earnings-per-share. This is all you need to know.
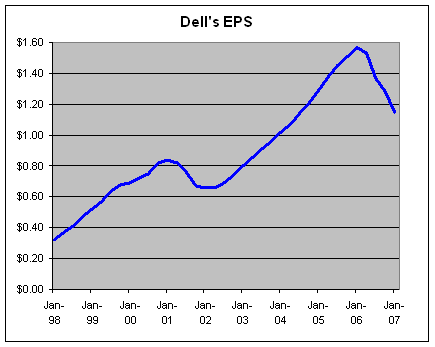
If you’re new to investing, do you see how the blue line goes down at the end? That’s not good. Try and avoid those.
The New York Times notes:Historically, Dell has had operating margins that were higher than any computer maker except Apple because Dell sells computers directly to its customers and does not have to share profit with retailers. But over the last year, those margins have slipped to 5.5 percent from more than 8.2 percent.
Here’s a look at Dell’s operating marging:
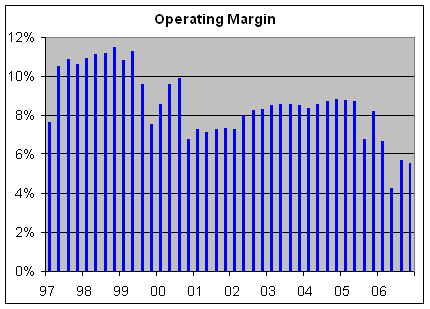
Think of it this way: Dell used to be able to sell $100 worth of effort for around $113. Today, it goes for $106.
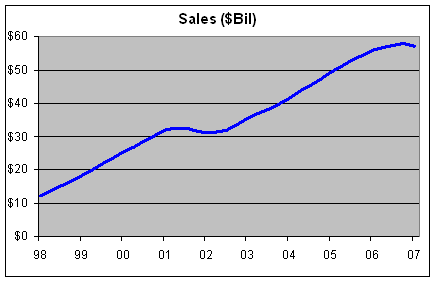
The NYT:Revenue fell 5.1 percent, to $14.4 billion, from $15.18 billion a year earlier. The last time revenue declined at Dell was in 2001, in the recession that followed the technology boom.
Here’s a look at trailing four-quarter sales:
I wish I could give you more details but I can’t. The company hasn’t filed a quarterly statement in nine months. (That’s also not good.) No blance sheet. No comparisons with last quarter. Nothing. Oh, did I mention the SEC investigation? (That’s really not good.)
I’m sure some of this will be revised soon, but here are the results for the last ten years:Quarter…..Sales….Oper. Income…..EPS
1-97………$2,588………$198………..$0.0675
2-97………$2,814………$296………..$0.0725
3-97………$3,188………$346………..$0.085
4-97………$3,737………$397………..$0.10
1-98………$3,920………$429………..$0.11
2-98………$4,331………$483………..$0.12
3-98………$4,818………$539………..$0.14
4-98………$5,173………$595………..$0.15
1-99………$5,537………$600………..$0.16
2-99………$6,142………$694………..$0.19
3-99………$6,784………$650………..$0.18
4-99………$6,801………$513………..$0.16
1-00………$7,280………$625………..$0.19
2-00………$7,670………$736………..$0.22
3-00………$8,264………$818………..$0.25
4-00………$8,674………$589………..$0.18
1-01………$8,028………$588………..$0.17
2-01………$7,611………$545………..$0.16
3-01………$7,468………$544………..$0.16
4-01………$8,061………$594………..$0.17
1-02………$8,066………$590………..$0.17
2-02………$8,459………$677………..$0.19
3-02………$9,144………$758………..$0.21
4-02………$9,735………$809………..$0.23
1-03………$9,532………$811………..$0.23
2-03………$9,778………$840………..$0.24
3-03………$10,622…….$912………..$0.26
4-03………$11,512…….$981………..$0.29
1-04………$11,540…….$966………..$0.28
2-04………$11,706…….$1,006……..$0.31
3-04………$12,502…….$1,089……..$0.33
4-04………$13,457…….$1,187……..$0.37
1-05………$13,386…….$1,174……..$0.37
2-05………$13,428…….$1,173……..$0.38
3-05………$13,911…….$944………..$0.39
4-05………$15,183…….$1,246……..$0.43
1-06………$14,216…….$949………..$0.33
2-06………$14,094…….$605………..$0.22
3-06………$14,383…….$824………..$0.30
4-06………$14,402…….$801………..$0.30 -
Media Star
Posted by Eddy Elfenbein on March 1st, 2007 at 5:00 pmI’ll be on CNBC’s On the Money tonight. I’ll be joining fellow bloggers John Carney of Deal Breaker and Jon C. Ogg of 24/7 Wall Street. The show starts at 7 pm. We’ll be on near the end.
If anyone needs me, I’ll be in my trailer.
Ta!
Update: Here’s the vid. -
Doubling Down at Dearborn
Posted by Eddy Elfenbein on March 1st, 2007 at 1:17 pmMulally is betting the house:
Ford said its restructuring plan would likely cost $11.18 billion, with more than half of the expenses devoted to programs for laid-off workers.
In a filing with the Securities and Exchange Commission on Wednesday, the No.2 U.S. automaker estimated that it would spend $5.96 billion on a jobs bank and other “personnel-reduction programs,” $2.74 billion to scale back its pensions, $2.2 billion for fixed asset impairment charges and $281 million to idle plants.
The company also disclosed that it had pledged all its buildings, trademarks, intellectual property, shares in the main company, and shares in Volvo, Jaguar, Aston Martin, Ford Motor Credit and other operations as collateral for a $23.4 billion line of credit to fund its restructuring plan and cover losses expected until 2009. -
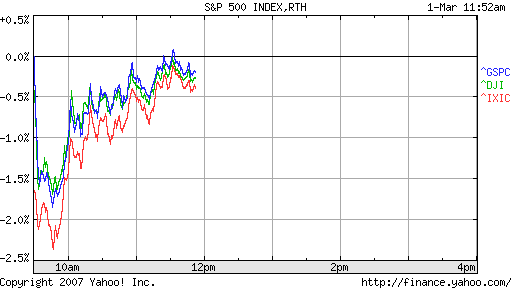
Eek!
Posted by Eddy Elfenbein on March 1st, 2007 at 11:53 amThat wasn’t a fun opening. Things are better now.
-
The Carry Trade
Posted by Eddy Elfenbein on March 1st, 2007 at 10:24 amOne of the key drivers of the market lately has been the “yen carry trade.” A carry trade is when you can borrow money in a currency with low interest rates and turnaround and invest the proceeds in a currency with higher rates. You “carry” the proceeds from one asset to another. It’s like free money. That is, as long as the interest rates don’t move against you.
The popular carry trade has been to use the Japanese yen. The Bank of Japan used to have interest rates set at 0%, but it’s gradually raised rates to 0.5%. Switzerland has also been a popular currency of choice.
For example, a 10-year government bond in Japan goes for about 1.6%. In the U.S., 10-year Treasuries yield 4.5%, and in the U.K., Her Majesty’s 10-year bonds yield about 4.7%. The fear is that the carry trade will suddenly unwind—investors will close out of their carry trades all at once. So how much money is in the carry trade?Japan’s top financial diplomat Hiroshi Watanabe said he was closely monitoring yen carry trades and the impact from their possible reversal. He estimated the size of the carry trade at between 10-20 trillion yen but said there were no statistics available.
10-20 trillion? So he’s closely monitoring it, but he had no frickin idea.
-
Who Got Rich Off the Glitch?
Posted by Eddy Elfenbein on March 1st, 2007 at 9:55 amRoger Ehrenberg at Information Arbitrage points out that some traders were doing quite well, thank you, from the NYSE’s computer glitch.
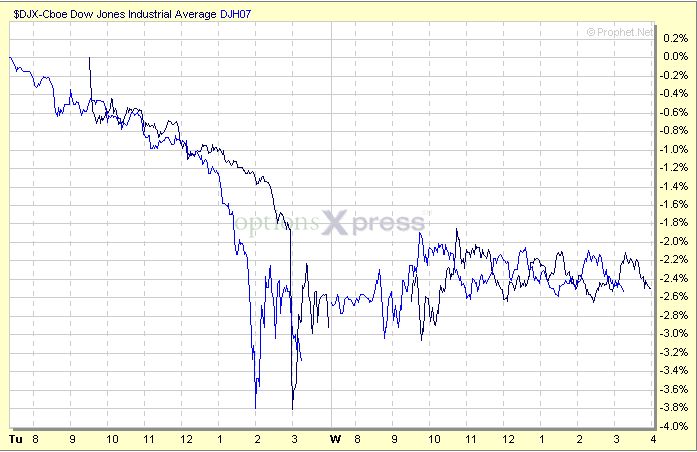
See the black line – that’s the spot DJIA. See the blue line – that’s the March DJH07 futures contract traded on the CBOT. So, let’s walk through this together. In the morning the spot and futures markets pretty much tracked each other. Then look what happened – uh oh, the spot market is falling behind, while the futures market is reflecting the true market sentiment. They are starting to diverge, then wider, wider still, FOR ABOUT TWO HOURS, until BANG – the alternative cash system kicks in and the flood of sell orders drops the spot index like a stone. So this technical “glitch” was really, at its core, a timing delay. Then the futures market, as if it knew what was going to happen, ran up, after which the spot market followed with a significant lag. After a little sputtering and some continued dislocation late in the day yesterday, they tracking each other once again today. Whew.
So what does this mean? A savvy futures trader that saw the divergence could have positioned themselves to profit from the inevitable meltdown in the spot market, and the subsequent run-up after the futures rallied ahead of the spot market. AND HAD ABOUT TWO HOURS TO DO IT.
-
Archives
- June 2026
- May 2026
- April 2026
- March 2026
- February 2026
- January 2026
- December 2025
- November 2025
- October 2025
- September 2025
- August 2025
- July 2025
- June 2025
- May 2025
- April 2025
- March 2025
- February 2025
- January 2025
- December 2024
- November 2024
- October 2024
- September 2024
- August 2024
- July 2024
- June 2024
- May 2024
- April 2024
- March 2024
- February 2024
- January 2024
- December 2023
- November 2023
- October 2023
- September 2023
- August 2023
- July 2023
- June 2023
- May 2023
- April 2023
- March 2023
- February 2023
- January 2023
- December 2022
- November 2022
- October 2022
- September 2022
- August 2022
- July 2022
- June 2022
- May 2022
- April 2022
- March 2022
- February 2022
- January 2022
- December 2021
- November 2021
- October 2021
- September 2021
- August 2021
- July 2021
- June 2021
- May 2021
- April 2021
- March 2021
- February 2021
- January 2021
- December 2020
- November 2020
- October 2020
- September 2020
- August 2020
- July 2020
- June 2020
- May 2020
- April 2020
- March 2020
- February 2020
- January 2020
- December 2019
- November 2019
- October 2019
- September 2019
- August 2019
- July 2019
- June 2019
- May 2019
- April 2019
- March 2019
- February 2019
- January 2019
- December 2018
- November 2018
- October 2018
- September 2018
- August 2018
- July 2018
- June 2018
- May 2018
- April 2018
- March 2018
- February 2018
- January 2018
- December 2017
- November 2017
- October 2017
- September 2017
- August 2017
- July 2017
- June 2017
- May 2017
- April 2017
- March 2017
- February 2017
- January 2017
- December 2016
- November 2016
- October 2016
- September 2016
- August 2016
- July 2016
- June 2016
- May 2016
- April 2016
- March 2016
- February 2016
- January 2016
- December 2015
- November 2015
- October 2015
- September 2015
- August 2015
- July 2015
- June 2015
- May 2015
- April 2015
- March 2015
- February 2015
- January 2015
- December 2014
- November 2014
- October 2014
- September 2014
- August 2014
- July 2014
- June 2014
- May 2014
- April 2014
- March 2014
- February 2014
- January 2014
- December 2013
- November 2013
- October 2013
- September 2013
- August 2013
- July 2013
- June 2013
- May 2013
- April 2013
- March 2013
- February 2013
- January 2013
- December 2012
- November 2012
- October 2012
- September 2012
- August 2012
- July 2012
- June 2012
- May 2012
- April 2012
- March 2012
- February 2012
- January 2012
- December 2011
- November 2011
- October 2011
- September 2011
- August 2011
- July 2011
- June 2011
- May 2011
- April 2011
- March 2011
- February 2011
- January 2011
- December 2010
- November 2010
- October 2010
- September 2010
- August 2010
- July 2010
- June 2010
- May 2010
- April 2010
- March 2010
- February 2010
- January 2010
- December 2009
- November 2009
- October 2009
- September 2009
- August 2009
- July 2009
- June 2009
- May 2009
- April 2009
- March 2009
- February 2009
- January 2009
- December 2008
- November 2008
- October 2008
- September 2008
- August 2008
- July 2008
- June 2008
- May 2008
- April 2008
- March 2008
- February 2008
- January 2008
- December 2007
- November 2007
- October 2007
- September 2007
- August 2007
- July 2007
- June 2007
- May 2007
- April 2007
- March 2007
- February 2007
- January 2007
- December 2006
- November 2006
- October 2006
- September 2006
- August 2006
- July 2006
- June 2006
- May 2006
- April 2006
- March 2006
- February 2006
- January 2006
- December 2005
- November 2005
- October 2005
- September 2005
- August 2005
- July 2005
 Eddy Elfenbein is a Washington, DC-based speaker, portfolio manager and editor of the blog Crossing Wall Street. His