-
The Invaluable Consultant
Posted by Eddy Elfenbein on September 24th, 2006 at 4:38 pm -
Blodget on Amaranth
Posted by Eddy Elfenbein on September 24th, 2006 at 2:34 pmIn Slate, Henry Blodget looks at the Amaranth blow-up:
The only plausible conclusions that can be drawn from the crackups of Amaranth, et al, are that 1) they didn’t know the risks they were taking, or 2) they knew and didn’t care.
He thinks more are on the way, and I agree.
-
Citigroup sees S&P hitting 1,500 by end of 2007
Posted by Eddy Elfenbein on September 22nd, 2006 at 10:43 amFrom Reuters:
Citigroup Inc. set 2007 year-end targets of 1,500 for the Standard & Poor’s 500 index (that’s 14.3% over 15 monnths) and 12,750 for the Dow Jones industrial average, with the cash on corporate balance sheets providing some downside protection.
In a research note, analyst Tobias Levkovich forecast another year of high-single-digit gains. The risk of a decline in the S&P 500 index was modest given that at S&P 500 companies, excluding financial firms, cash holdings are about 8 percent of market capitalization.
Citigroup said that after weighing several factors, it predicted the S&P would range between 1,400 on the low end and 1,630 on the high end as 2007 comes to a close.Given the current yield curve, this strikes me as somewhat overly optimistic.
-
The Forbes 400
Posted by Eddy Elfenbein on September 22nd, 2006 at 10:11 amForbes just came out with its new list of the 400 wealthiest Americans. Here’s the top 25 and their fortunes (in billions):
1 William Henry Gates III……………….$53.0
2 Warren Edward Buffett……………….$46.0
3 Sheldon Adelson………………………..$20.5
4 Lawrence Joseph Ellison……………..$19.5
5 Paul Gardner Allen……………………..$16.0
6 Jim C Walton……………………………..$15.7
7 Christy Walton & family……………….$15.6
7 S Robson Walton……………………….$15.6
9 Michael Dell……………………………….$15.5
9 Alice L Walton……………………………$15.5
11 Helen R Walton………………………..$15.3
12 Sergey Brin……………………………..$14.1
13 Larry E Page……………………………$14.0
14 Jack Crawford Taylor & family……..$13.9
15 Steven Anthony Ballmer…………….$13.6
16 Abigail Johnson………………………..$13.0
17 Barbara Cox Anthony………………..$12.6
17 Anne Cox Chambers………………….$12.6
19 Charles De Ganahl Koch…………….$12.0
19 David Hamilton Koch………………….$12.0
21 Forrest Edward Mars Jr………………$10.5
21 Jacqueline Mars………………………..$10.5
21 John Franklyn Mars……………………$10.5
24 Carl Icahn………………………………..$9.7
25 John Werner Kluge……………………$9.1
For the first time, everyone on the list is a billionaire. -
Market gossip goes high-tech
Posted by Eddy Elfenbein on September 21st, 2006 at 4:06 pmThe Financial Times is on the story:
Market gossip is to take on a more high-tech form thanks to a new automated system that will trawl through more than 40m internet sources – from blogs to regulatory filings – on behalf of hedge funds.
Due for an official launch early next year, the platform is being run by a former Deutsche Bank executive and has received financing from, among others, Draper Fisher Jurvetson, the venture capital firm that backed Skype before it was sold to Ebay for $4.1bn last year. Ten hedge funds are trying out the system.
Called Monitor110, the platform acts as an aggregator and a filter for hedge funds trying to keep up with the explosion of information sources on the internet, such as blogs. The blog search engine Technorati currently tracks 50m blogs, with about 175,000 new ones created every day.Let’s see. The hedgies watch the blogs, and the blogs make fun of the hedgies. All rather post-modern if you ask me.
-
Convergencification
Posted by Eddy Elfenbein on September 21st, 2006 at 2:51 pmStep aside: The bond market is rolling today. The yield on the 10-year bond (^TNX) just fell below 4.65%, and the yield on the 30-year (^TYX) fell below 4.78%.
Here’s some perspective: The 10-year is now 60 basis points below Bernanke.
But there’s something else that’s been happening. The stock and bond markets have converged.
For most of this spring, the stock and bond markets moved in completely opposite directions. If bonds zigged, stocks zagged. Check out this chart of the S&P 500 Spyders (SPY) and the American Century 2025 Fund (BTTRX):
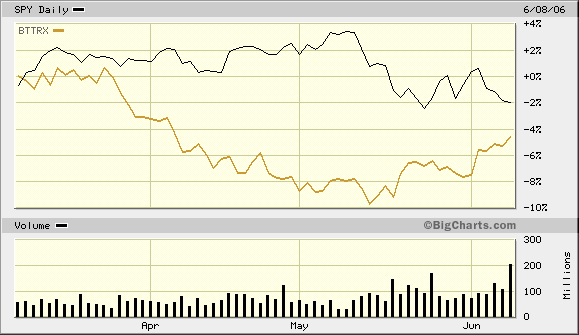
They’re almost like mirror images.
But in early June, everything changed. The two markets suddenly converged, and started to move like waltzing partners:

What happened is the fight for capital changed. It was stocks against bonds. Then the paper assets decided to team up and kick the ass of real assets like gold and oil (think Rocky III):

The gold line is the Oil ETF (USO). -
Headline of the Week
Posted by Eddy Elfenbein on September 21st, 2006 at 12:51 pmThe old weirdness level just wasn’t cutting it.
Not only did investigators impersonate board members, employees and journalists to obtain their phone records, but according to multiple reports, they also surveilled an HP director and a reporter for CNet Networks Inc. They sent monitoring spyware in an e-mail to that reporter by concocting a phony story tip.
They even snooped on the phone records of former CEO and Chairwoman Carly Fiorina, who had launched the quest to identify media sources in the first place.If they had only put that much time, effort and creativity into something more useful…say, running HP’s business.
And in a twist that might seem preposterous if it happened in a movie, The New York Times reported that HP consultants considered hiring spies to pose as clerical or custodial workers at CNet and The Wall Street Journal.
Um…that did happen in a movie: Wall Street.
And they’re right, it was preposterous.
What if those consultants were really spies from Dell who were secretly trying to sabotage HP? How cool would that be?
Honestly, I should be writing for 24. -
Dell Gets Delisting Notice
Posted by Eddy Elfenbein on September 21st, 2006 at 11:41 amOK, the Nasdaq isn’t really going to delist Dell (DELL). But still, you gotta get that 10-Q in sometime.
-
Bed Bath & Beyond Earned 51 Cents a Share
Posted by Eddy Elfenbein on September 20th, 2006 at 10:25 pmNow it’s official: For the August quarter, Bed Bath & Beyond (BBBY) earned 51 cents a share (see earnings call transcript). That’s not too much of a surprise since it’s what the company said to expect.
Well…they were right!
Sales were up 12.3% to $1.607 billion. Interestingly, net income was nearly the exact same as last year. The difference is that there are now 17 million fewer shares.
Although Bed Bath & Beyond doesn’t pay a dividend, last year the company bought back $600 million worth of stock. That’s a frickin ginormous amount for a company this size (5.7% of current market value).
As I’m sure you know by now, I’m a big fan of Bed Bath & Beyond. Let’s geek out at some of stats:Quarter Sales Gross Profit Operating Profit Net Profit EPS $356,633 $146,214 $28,015 $17,883 $0.06 $451,715 $185,570 $53,580 $33,247 $0.12 $480,145 $196,784 $50,607 $31,707 $0.11 $569,012 $238,233 $77,138 $48,392 $0.17 $459,163 $187,293 $36,339 $23,364 $0.08 $589,381 $241,284 $70,009 $43,578 $0.15 $602,004 $246,080 $64,592 $40,665 $0.14 $746,107 $311,802 $101,898 $64,315 $0.22 $575,833 $234,959 $45,602 $30,007 $0.10 $713,636 $291,342 $84,672 $53,954 $0.18 $759,438 $311,030 $83,749 $52,964 $0.18 $879,055 $370,235 $132,077 $82,674 $0.28 $776,798 $318,362 $72,701 $46,299 $0.15 $903,044 $370,335 $119,687 $75,459 $0.25 $936,030 $386,224 $119,228 $75,112 $0.25 $1,049,292 $443,626 $168,441 $105,309 $0.35 $893,868 $367,180 $90,450 $57,508 $0.19 $1,111,445 $459,145 $155,867 $97,208 $0.32 $1,174,740 $486,987 $161,459 $100,506 $0.33 $1,297,928 $563,352 $231,567 $144,248 $0.47 $1,100,917 $456,774 $128,707 $82,049 $0.27 $1,273,960 $530,829 $189,108 $120,008 $0.39 $1,305,155 $548,152 $190,978 $121,927 $0.40 $1,467,646 $650,546 $283,621 $180,980 $0.59 $1,244,421 $520,781 $150,884 $98,903 $0.33 $1,431,182 $601,784 $217,877 $141,402 $0.47 $1,448,680 $615,363 $205,493 $134,620 $0.45 $1,685,279 $747,820 $304,917 $197,922 $0.67 $1,395,963 $590,098 $148,750 $100,431 $0.35 $1,607,239 $678,249 $219,622 $145,535 $0.51 The first thing you’ll notice is a big spike in business during the February quarter due to the holiday shopping season. Retailers live or die by the holidays.
Let’s break down the numbers. The first thing I like to look at is a company’s margins. First we’ll start with gross margins:

Ah, tres bien! This shows Bed Bath & Beyond’s gross margins for the trailing four quarters. As you can see, gross margins have climbed very nicely. In short, they can charge $7 for something that costs them $4 to make. We like that. We like that a lot.
This is also referred to as a company’s variable costs. Let’s say you run a lemonade stand. Your variable cost is simply how much it costs to make your lemonade. For each unit you sell, your variables costs should rise by the same percent. Variable costs are always a function of sales. That’s why gross profit margins don’t change much, and it speaks well of the company that gross margins have climbed in recent years.
Now let’s look at operating margin and net profit margin:

Again, these graphs are very good. The red line is operating margin, and the black is net margin. Don’t worry about the recent downturn in operating margin. For the last four quarters, Bed Bath & Beyond has implement Statement of Financial Accounting Standards 123(R) which accounts for stock-based compensation. That’s shaved…oh, a couple million dollars each quarter.
The charges work out to three cents a share in this quarter and in last quarter. Excluding those charges, the company’s operating margins are still over 15%, so these numbers are still looking good.
Now let me explain what operating margin is. Operating margin is gross margin minus “selling, general and administrative” expense. These are your fixed cost. For you lemonade stand, it would be things like salaries, maintenance and marketing (what can I say…it’s a fancy lemonade stand). These costs are hard to control because they’ll rise simply because you’re still in business. Hey, you gotta pay the phone bill.
Net margin is operating margin minus interest expense and your tax bill. This is my favorite line, the bottom line. In Bed Bath & Beyond’s case, it makes a small amount of money from interest income.
Now let’s look at the growth in sales-per-share:

Again, this is what I like to see–a nice smooth trend.
For the quarter we’re currently in (the company’s third), Bed Bath & Beyond forecasts earnings of 52 cents a share. And for the fourth quarter (ending in February), the company sees earnings of 79 cents a share.
Here’s a chart of earnings-per-share for the past few years, along with the company’s estimate for the next two quarters, plus my estimate for the four quarters after that:

Also in the press release was this:The Company also announced an independent committee of its Board of Directors is carrying out a review of the Company’s stock option grants and procedures. The independent committee’s review was initiated voluntarily by the Company and is being conducted with the assistance of independent legal counsel and outside accounting experts selected by the committee. The independent committee’s review is not complete. The Company expects to report further with respect to the review in its Form 10-Q for the quarter ended August 26, 2006, which the Company expects to file on a timely basis on or before October 5, 2006.
The shares dropped sharply in the after-hours market but this struck me as a perfectly ordinary review. I don’t see how we can read any more into it.
-
Frontier Airlines Jumps
Posted by Eddy Elfenbein on September 20th, 2006 at 2:45 pmI had Frontier Airlines (FRNT) on last year’s Buy List. I hate airline stocks, but FRNT looked like a sound investment at a good price. The stock was doing well until it got slammed after Southwest Airlines (LUV) said it was going to enter the Denver market, Frontier’s home turf. Ultimately, I decided againt keeping Frontier on this year’s Buy List, which was a smart move since the stock has fallen for most of the year.
Shares of Frontier got as low as $6, but have to started to perk up recently. Fuel is a huge cost for the ailines, and crude oil briefly fell below $60 a barrel today. Frontier is up strongly this session and is back over $8 a share.

-
Archives
- October 2026
- September 2026
- August 2026
- July 2026
- June 2026
- May 2026
- April 2026
- March 2026
- February 2026
- January 2026
- December 2025
- November 2025
- October 2025
- September 2025
- August 2025
- July 2025
- June 2025
- May 2025
- April 2025
- March 2025
- February 2025
- January 2025
- December 2024
- November 2024
- October 2024
- September 2024
- August 2024
- July 2024
- June 2024
- May 2024
- April 2024
- March 2024
- February 2024
- January 2024
- December 2023
- November 2023
- October 2023
- September 2023
- August 2023
- July 2023
- June 2023
- May 2023
- April 2023
- March 2023
- February 2023
- January 2023
- December 2022
- November 2022
- October 2022
- September 2022
- August 2022
- July 2022
- June 2022
- May 2022
- April 2022
- March 2022
- February 2022
- January 2022
- December 2021
- November 2021
- October 2021
- September 2021
- August 2021
- July 2021
- June 2021
- May 2021
- April 2021
- March 2021
- February 2021
- January 2021
- December 2020
- November 2020
- October 2020
- September 2020
- August 2020
- July 2020
- June 2020
- May 2020
- April 2020
- March 2020
- February 2020
- January 2020
- December 2019
- November 2019
- October 2019
- September 2019
- August 2019
- July 2019
- June 2019
- May 2019
- April 2019
- March 2019
- February 2019
- January 2019
- December 2018
- November 2018
- October 2018
- September 2018
- August 2018
- July 2018
- June 2018
- May 2018
- April 2018
- March 2018
- February 2018
- January 2018
- December 2017
- November 2017
- October 2017
- September 2017
- August 2017
- July 2017
- June 2017
- May 2017
- April 2017
- March 2017
- February 2017
- January 2017
- December 2016
- November 2016
- October 2016
- September 2016
- August 2016
- July 2016
- June 2016
- May 2016
- April 2016
- March 2016
- February 2016
- January 2016
- December 2015
- November 2015
- October 2015
- September 2015
- August 2015
- July 2015
- June 2015
- May 2015
- April 2015
- March 2015
- February 2015
- January 2015
- December 2014
- November 2014
- October 2014
- September 2014
- August 2014
- July 2014
- June 2014
- May 2014
- April 2014
- March 2014
- February 2014
- January 2014
- December 2013
- November 2013
- October 2013
- September 2013
- August 2013
- July 2013
- June 2013
- May 2013
- April 2013
- March 2013
- February 2013
- January 2013
- December 2012
- November 2012
- October 2012
- September 2012
- August 2012
- July 2012
- June 2012
- May 2012
- April 2012
- March 2012
- February 2012
- January 2012
- December 2011
- November 2011
- October 2011
- September 2011
- August 2011
- July 2011
- June 2011
- May 2011
- April 2011
- March 2011
- February 2011
- January 2011
- December 2010
- November 2010
- October 2010
- September 2010
- August 2010
- July 2010
- June 2010
- May 2010
- April 2010
- March 2010
- February 2010
- January 2010
- December 2009
- November 2009
- October 2009
- September 2009
- August 2009
- July 2009
- June 2009
- May 2009
- April 2009
- March 2009
- February 2009
- January 2009
- December 2008
- November 2008
- October 2008
- September 2008
- August 2008
- July 2008
- June 2008
- May 2008
- April 2008
- March 2008
- February 2008
- January 2008
- December 2007
- November 2007
- October 2007
- September 2007
- August 2007
- July 2007
- June 2007
- May 2007
- April 2007
- March 2007
- February 2007
- January 2007
- December 2006
- November 2006
- October 2006
- September 2006
- August 2006
- July 2006
- June 2006
- May 2006
- April 2006
- March 2006
- February 2006
- January 2006
- December 2005
- November 2005
- October 2005
- September 2005
- August 2005
- July 2005
 Eddy Elfenbein is a Washington, DC-based speaker, portfolio manager and editor of the blog Crossing Wall Street. His