-
Writing Annual Reports
Posted by Eddy Elfenbein on June 22nd, 2006 at 10:59 amA University of Michigan study looks at why annual reports are hard to read (via Tyler Cowen):
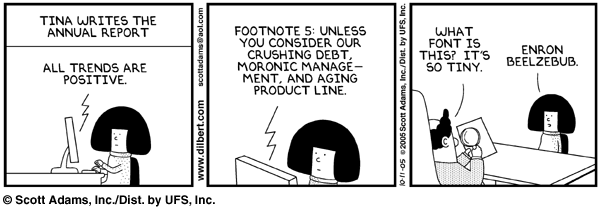
Apparently there’s a simple reason why annual reports are hard to read: managers, in many cases, are trying to hide something.
The study, Annual Report Readability, Earnings and Stock Returns, found that the annual reports of underperforming companies are harder to read than those of companies that are performing well.
Feng Li, an assistant professor of accounting at the university, measured annual report “readability” using a sample of more than 55,000 company reporting years. He examined syllables per word and words per sentence in reports filed with the Securities and Exchange Commission.
He used two readability measures.
First, the “Fog Index” indicated the number of years of formal education a reader of average intelligence would need to read the text once and understand it. Fog = (words per sentence + per cent of complex words) x 0.4. Complex words were defined as words of three syllables or more.
Second, the Kincaid Index rated the reports on a US primary school level.
According to the study, annual reports of companies with lower earnings were more difficult to read. Similarly, companies that had volatile earnings were more likely to produce abstruse reports.Of course, there’s always this:
-
Bed Bath & Beyond Taking a Bath
Posted by Eddy Elfenbein on June 22nd, 2006 at 10:45 amShares of Bed Bath and Beyond (BBBY) are getting hammered this morning (down about -5.5%). The stock has been cut by Bear Stearns. The company’s earnings report was inline with expectations, and the guidance for this quarter was also inline. Still, the stock made fresh 52-week lows this morning.
Here’s a sample negative view from an analyst:In a note to clients entitled “Q1 Could Have Been Better,” UBS analyst Brian Nagel said costs weighed on the retailer.
“Given (same-store) sales growth at the upper end of plan we would have expected stronger earnings growth at Bed Bath & Beyond in the first quarter,” Nagel said. “Recent expense pressures seem unique to Bed Bath & Beyond and are not indicative of higher costs in retail.”
While net earnings had a slight gain, operating profits dipped to $148.8 million from $150.9 million. Costs escalated to $805.9 million from $723.6 million, led by a 19% rise in sales, general and administrative expenses.
Further, the company’s cash assets were cut to nearly a third of their former levels a year ago.Seeking Alpha has a transcript of the conference call.
The good news for us this morning is that Varian Medical (VAR) is up strongly on an analyst upgrade from Oppenheimer. -
Bed Bath & Beyond Earned 35 Cents a Sahre
Posted by Eddy Elfenbein on June 21st, 2006 at 4:21 pmThe company matched Wall Street’s expectations. Sales came in at $1.396 billion, which was also in line with forecasts. The stock is down 19 cents a share in after-hours trading.
-
The First Day of Summer Rally
Posted by Eddy Elfenbein on June 21st, 2006 at 2:47 pmWe’re having a very good day today so far, although I could do without the leadership coming from the “hard asset” sectors like energy and basic materials. The S&P 500 is now above last Thursday’s high point. The Dow was just at 11,111, which must be some sort of sign.
The Buy List is being led today by Harley-Davidson (HDI), Expeditors (EXPD) and Fiserv (FISV). FactSet (FDS) is holding on to its big gain from yesterday. I’m waiting on Bed Bath & Beyond’s (BBBY) earnings after the close. Of Wall Street’s 25 estimates, the high is 36 cents per share, the low is 35 cents per share. Just to be different, I predict—no, guarantee—37 cents per share. When earnings came out three months ago, the stock was over $40 a share. Today, it’s down to $37.
Morgan Stanley (MS) is up after a strong earnings report. The brokerage has been the sick man of Wall Street. It’s trailed the rest of the industry in a furious rally for the major Wall Street brokers. David Weidner at MarketWatch notes that some smaller houses are moving in to take business from some of the big boys.
Volatility continues to rise. Today looks to be the S&P 500’s 12th swing of 1% or more in the past seven weeks. In the six months prior to that, there were just eight such days. -
We’ve Pulled Even With the Market
Posted by Eddy Elfenbein on June 21st, 2006 at 10:00 amGreat news! Thanks to FactSet’s (FDS) big day yesterday, our Buy List has pulled even with the S&P 500 for the year. Woo! It took the market and me nearly six months to lose a little less than 1%.
OK, I can see that you’re not terribly impressed. But let’s take a step back and look at what we can expect of the stock market (and by extension, me).
Although the market likes to jump around a lot, if you look at it from a long-term perspective, the market is far more consistent than many people realize. Over the last 80 years, stocks have averaged 10.36% a year. Oh sure, stocks will plunge 50% or more even few decades, but that just comes with the territory. But if you plan to stick it out, the market is the place to be. On average, it doubles your money every seven years. That’s better than every other asset class. All of them.
But I have to caution you: Over the last 25 years, us stock investors have been spoiled. The reason has to do with bonds. Think of it this way. The stock and bond markets are in a never-ending battle for your money. Whatever bonds do, stocks are very likely to mimic.
Stocks and bonds don’t have a perfect relationship but they will tell you a lot. One of the things you may have noticed from my site is that I don’t worry too much about the “background noise” of Wall Street. This includes most economic reports, the national debt or almost anything about the Federal Reserve. My feeling is that as long as the bond market isn’t worried, then there’s no reason to be worried. The bond market is one of the few sources that isn’t afraid to tell you the truth.
Since 1981, we’ve had a massive rally for bonds. Interest rates for long-term bonds have fallen to levels we haven’t seen in decades. And like clockwork, stocks soared. The period from 1982 to 2000 was one of the greatest bull markets in history. What’s interesting is that during that time, stocks and bonds still closely tracked each other. In fact, since 1969, stocks have beaten long-term government bonds by just 1.69% a year. That’s a pretty measly bonus you get for taking on the risk of owning stocks. Moreover, that 1.69% has been fairly consistent.
If we assume that 1.69% premium will continue, with today’s 30-year bond yield of nearly 5.2%, that translates to a long-term stock market return of (let’s call it) 7% a year. So a return for six months should only average about 3.5%.
I’m afraid that too many investors think that the 20%+ years of the 1990’s are the norm. They’re not. -
How Low Can It Go?
Posted by Eddy Elfenbein on June 21st, 2006 at 6:28 amI often hear people say that a particular stock is so cheap, “how much lower can it really go?” The answer is, it can go a lot lower. A stock can drop 99% and it’s still not at zero. It can drop another 99%, and it’s still worth something. In fact, a stock can drop 99% many, many times, and still not reach zero.
Delistings don’t make a lot of news, but they happen every week. Here’s a graph of issuers on the NASDAQ since 2003:

-
A Stock Market in Rwanda?
Posted by Eddy Elfenbein on June 21st, 2006 at 6:02 amNot yet says a study. But wouldn’t be nice to see a market there soon?
-
Otis Spunkmeyer Files for IPO
Posted by Eddy Elfenbein on June 20th, 2006 at 11:01 am
One of my favorites is going public.The San Leandro, California-based company said in a registration statement with the Securities and Exchange Commission that it planned to use the IPO proceeds to repay debt, to redeem Class A preferred stock and for general corporate purposes.
Otis Spunkmeyer said its principal focus was selling frozen cookie dough products to the food service channel, which represented 63 percent of its net sales in fiscal 2005.
According to restated results, the company earned $5.4 million on $336.3 million of net sales in 2005.
The filing said Merrill Lynch & Co. and JPMorgan were underwriting the offering.
The document did not reveal how many shares the company planned to sell or at what price. Those details will probably be revealed in future filings. -
Looking At Bed Bath & Beyond
Posted by Eddy Elfenbein on June 20th, 2006 at 10:34 amIf you’re new to investing, Bed Bath & Beyond (BBBY) is a good stock to look at. The financials are about as straightforward as they come. No pro forma nonsense or huge “one time” charges that seem to happen every single quarter (Cendant, I’m looking at you).
Here are BBBY’s financial results for the past few years:Quarter Sales Gross Profit Operating Profit Net Profit EPS $356,633 $146,214 $28,015 $17,883 $0.06 $451,715 $185,570 $53,580 $33,247 $0.12 $480,145 $196,784 $50,607 $31,707 $0.11 $569,012 $238,233 $77,138 $48,392 $0.17 $459,163 $187,293 $36,339 $23,364 $0.08 $589,381 $241,284 $70,009 $43,578 $0.15 $602,004 $246,080 $64,592 $40,665 $0.14 $746,107 $311,802 $101,898 $64,315 $0.22 $575,833 $234,959 $45,602 $30,007 $0.10 $713,636 $291,342 $84,672 $53,954 $0.18 $759,438 $311,030 $83,749 $52,964 $0.18 $879,055 $370,235 $132,077 $82,674 $0.28 $776,798 $318,362 $72,701 $46,299 $0.15 $903,044 $370,335 $119,687 $75,459 $0.25 $936,030 $386,224 $119,228 $75,112 $0.25 $1,049,292 $443,626 $168,441 $105,309 $0.35 $893,868 $367,180 $90,450 $57,508 $0.19 $1,111,445 $459,145 $155,867 $97,208 $0.32 $1,174,740 $486,987 $161,459 $100,506 $0.33 $1,297,928 $563,352 $231,567 $144,248 $0.47 $1,100,917 $456,774 $128,707 $82,049 $0.27 $1,273,960 $530,829 $189,108 $120,008 $0.39 $1,305,155 $548,152 $190,978 $121,927 $0.40 $1,467,646 $650,546 $283,621 $180,980 $0.59 $1,244,421 $520,781 $150,884 $98,903 $0.33 $1,431,182 $601,784 $217,877 $141,402 $0.47 $1,448,680 $615,363 $205,493 $134,620 $0.45 $1,685,279 $747,820 $304,917 $197,922 $0.67 As always, I pass the graphics savings on to you.
A few things to point out. You’ll notice that there’s a bulge in the February quarters (the company’s fourth, which technically end in early March but it’s my damn table). That’s because of the holidays so it’s important to compare similar quarters.
Another thing you’ll notice—and something that I place a lot of emphasis on—is the company’s consistency. Here’s a chart of BBBY’s trailing four-quarter sales.

That’s what I like to see, a nice smooth line. The red is Wall Street’s estimate. Yes, someone is paid a great deal of money to draw that line out a few more points. Like a nine-year-old couldn’t find a trend here.
Now let’s look at the operating margins. This is important.

This impresses me a lot. Operating margin is one of the purest measures of how efficiently a company is managing its business. BBBY has been doing very well lately. That last little downtick concerns me a little. But as long as the margins don’t show a severe downtrend, I’m not too worried. Few things are more painful to a company than eroding margins.
Now here’s the company’s earnings-per-share:

Once again, we see a nice smooth line. But what isn’t a smooth line is the stock chart. Shares of BBBY haven’t budged in over four years. This chart pretty much sums it up:

Rising earnings and a flat stock means a plunging earnings multiple. This issue is really about risk. The stock could certainly stay flat, or even fall. Who knows…we can’t predict the future. But we can see that the company has performed very consistently, and its relative valuation is very low. That’s one of the best ways to control for risk.
Earnings are due tomorrow after the market closes. -
FactSet’s Earnings
Posted by Eddy Elfenbein on June 20th, 2006 at 9:26 amFactSet Research Systems (FDS) reported fiscal third-quarter earnings of 41 cents a share (including a penny a share from a tax benefit). This is good news. Wall Street was looking for 39 cents a share.
The company also sees revenue for this quarter coming in between $102 million and $105 million. Wall Street was expecting $98.7 million. The stock is up in pre-market trading.
-
Archives
- July 2026
- June 2026
- May 2026
- April 2026
- March 2026
- February 2026
- January 2026
- December 2025
- November 2025
- October 2025
- September 2025
- August 2025
- July 2025
- June 2025
- May 2025
- April 2025
- March 2025
- February 2025
- January 2025
- December 2024
- November 2024
- October 2024
- September 2024
- August 2024
- July 2024
- June 2024
- May 2024
- April 2024
- March 2024
- February 2024
- January 2024
- December 2023
- November 2023
- October 2023
- September 2023
- August 2023
- July 2023
- June 2023
- May 2023
- April 2023
- March 2023
- February 2023
- January 2023
- December 2022
- November 2022
- October 2022
- September 2022
- August 2022
- July 2022
- June 2022
- May 2022
- April 2022
- March 2022
- February 2022
- January 2022
- December 2021
- November 2021
- October 2021
- September 2021
- August 2021
- July 2021
- June 2021
- May 2021
- April 2021
- March 2021
- February 2021
- January 2021
- December 2020
- November 2020
- October 2020
- September 2020
- August 2020
- July 2020
- June 2020
- May 2020
- April 2020
- March 2020
- February 2020
- January 2020
- December 2019
- November 2019
- October 2019
- September 2019
- August 2019
- July 2019
- June 2019
- May 2019
- April 2019
- March 2019
- February 2019
- January 2019
- December 2018
- November 2018
- October 2018
- September 2018
- August 2018
- July 2018
- June 2018
- May 2018
- April 2018
- March 2018
- February 2018
- January 2018
- December 2017
- November 2017
- October 2017
- September 2017
- August 2017
- July 2017
- June 2017
- May 2017
- April 2017
- March 2017
- February 2017
- January 2017
- December 2016
- November 2016
- October 2016
- September 2016
- August 2016
- July 2016
- June 2016
- May 2016
- April 2016
- March 2016
- February 2016
- January 2016
- December 2015
- November 2015
- October 2015
- September 2015
- August 2015
- July 2015
- June 2015
- May 2015
- April 2015
- March 2015
- February 2015
- January 2015
- December 2014
- November 2014
- October 2014
- September 2014
- August 2014
- July 2014
- June 2014
- May 2014
- April 2014
- March 2014
- February 2014
- January 2014
- December 2013
- November 2013
- October 2013
- September 2013
- August 2013
- July 2013
- June 2013
- May 2013
- April 2013
- March 2013
- February 2013
- January 2013
- December 2012
- November 2012
- October 2012
- September 2012
- August 2012
- July 2012
- June 2012
- May 2012
- April 2012
- March 2012
- February 2012
- January 2012
- December 2011
- November 2011
- October 2011
- September 2011
- August 2011
- July 2011
- June 2011
- May 2011
- April 2011
- March 2011
- February 2011
- January 2011
- December 2010
- November 2010
- October 2010
- September 2010
- August 2010
- July 2010
- June 2010
- May 2010
- April 2010
- March 2010
- February 2010
- January 2010
- December 2009
- November 2009
- October 2009
- September 2009
- August 2009
- July 2009
- June 2009
- May 2009
- April 2009
- March 2009
- February 2009
- January 2009
- December 2008
- November 2008
- October 2008
- September 2008
- August 2008
- July 2008
- June 2008
- May 2008
- April 2008
- March 2008
- February 2008
- January 2008
- December 2007
- November 2007
- October 2007
- September 2007
- August 2007
- July 2007
- June 2007
- May 2007
- April 2007
- March 2007
- February 2007
- January 2007
- December 2006
- November 2006
- October 2006
- September 2006
- August 2006
- July 2006
- June 2006
- May 2006
- April 2006
- March 2006
- February 2006
- January 2006
- December 2005
- November 2005
- October 2005
- September 2005
- August 2005
- July 2005
 Eddy Elfenbein is a Washington, DC-based speaker, portfolio manager and editor of the blog Crossing Wall Street. His