-
CWS Market Review – September 21, 2021
Posted by Eddy Elfenbein on September 21st, 2021 at 8:49 pm(This is the free version of CWS Market Review. If you like what you see, then please sign up for the premium newsletter for $20 per month or $200 for the whole year.)
Before I get to today’s newsletter, I want to mention that today is our ETF’s fifth birthday. The AdvisorShares Focused Equity (CWS) started trading five years ago today. Over that time, we’ve nearly doubled investors’ money, and we’ve done it with low turnover and a long-term focus.
Lots of ETFs fold each year but we’ve still going strong. Thanks to everyone for your support and here’s to many more years!
The Market Stumbles
Yesterday, the stock market suffered its worst loss since May. To be honest, the drop wasn’t so bad. By the closing bell, the index shed 1.70%. For some context, we had 31 days worse than that last year, which admittedly was an unusual year.
When I say that yesterday was the worst day in over two months, that really says more about the last two months than it does about today. The true market outlier wasn’t yesterday’s drop but how calm the market has been for the last several weeks. In fact, yesterday’s market was cushioned by a late-day rally. At one point, the Dow was down 971 points, and the S&P 500 was off by 2.87%. We were down again today, but only by a small bit.

Yesterday’s market was also a near-perfect environment for our Buy List to outperform the rest of the market. All told, our Buy List lost 0.97% yesterday. That’s a big outperformance for our portfolio which is well diversified.
The reason we did so well in a relative sense is that our Buy List is concentrated in many high-quality conservative stocks. Five of our stocks actually closed higher yesterday while 19 of our 25 stocks beat the market.
Let me stress that one-day performance doesn’t tell us how good a portfolio is. Instead, I mean to say that our portfolio is designed to do better under certain conditions. To be fair, there are days when our kinds of stocks are on the outs. That’s simply how the market works. To everything, there is a season. It always sounds odd to talk about outperformance on a down day, but I’ve found that the best portfolios really make their mark during tough markets.
Yesterday was also the first time that the S&P 500 closed below its 50-day moving average on back-to-back days since last October. That’s the longest such streak in 25 years. Bloomberg said that yesterday, the 500 richest people in the world lost a combined $135 billion. Elon Musk lost $7.2 billion. The poor chap is no longer a $200 billionaire.
If you’re not familiar with the 50-day moving average, it’s simply the average closing price for the last 50 trading days. There’s also a 200-day version, plus others. I like to think of the 50-DMA as a stupid metric that works for very smart reasons.
Why is this so? The stock market tends to be trend-sensitive. A rising market will generally tend to keep rising and a lousy market will tend to stay lousy. That sounds obvious, but there’s a lot of complicated math behind it. Usually these trends will last longer than you or anyone thought possible.
That means that the big events in the markets are the turning points. Spotting them, however, is notoriously difficult. Make that impossible. That’s where the 50-DMA comes in. It’s a dumb metric but it does give you a general sense of where you are vis-à-vis the current trend.
The 50-DMA won’t pick the exact bottom, but it will turn not long after, and it will turn earlier if the turn is more dramatic. During last year’s market panic, the S&P 500 jumped above its 50-DMA about one month after the low. The stock market closed lower again today, but this time by just 0.08%.
There’s a very general rule of thumb that after big days, the market will perform one-third of the opposite of what it just did. So a drop of 1.7% will be followed by a rise of 0.57%. Early on today, it looked like we were going to heed close to the rule, but the market sagged into the close.
Another Lehman Brothers Moment?
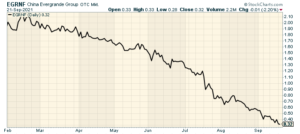
So what caused the market to stumble? The most prominent reason is that a Chinese real estate company called Evergrande is about to go kablooey. Some folks are talking about it being a “Lehman moment” akin to when Lehman Brothers went under 13 years and one week ago.
Evergrande is a highly reckless company that gorged on debt. The company now owes $300 billion. There’s a famous quote from John Paul Getty: “If you own a bank $100, that’s your problem. If you owe the bank $100 million, that’s the bank’s problem.” I’d add that if you owe the bond market $300 billion, that’s the global financial system’s problem. The WSJ said that Evergrande was paying off suppliers with unused real estate properties.
Evergrande was the kind of company that found itself in the right place at the right time. The company made affordable housing that met the demands of China’s growing middle class. From the WSJ: “It expanded into theme parks, healthcare services, mineral-water production and electric-vehicle manufacturing. It enlisted Hong Kong actor Jackie Chan at one point to help promote its bottled water.”
For its part, Beijing seems completely uninterested in any sort of bailout. I hate to think that the Communists do capitalism better than we do. In fact, Evergrande’s recent problems have been quickened by the Chinese government’s push against speculation. The government didn’t like it when home prices soared out of the reach of so many workers.
The problem with these kinds of problems is that you’re never exactly sure who’s exposed to the risk. Company A may go bust and it can be a terrible company. Company B may be a very good company but it loaned Company A way too much money. Now Company B is in trouble. Then if Company B starts to rattle, you don’t know who was exposed to them, and so on. In no time, you can have a chain reaction that freezes world finance.
I’m sure you’ve heard of the Butterfly Effect. This is the idea that one small event on one side of the world have can have a major impact, weeks later, on the other side of the world. Global finance is like the Butterfly Effect just faster and with more money.
In the 1990s, there was a very successful hedge fund called Long-Term Capital Management. It was full of a lot of eggheads who used their models to make tons of money. The problem is that models can only get you so far in finance. LTCM made a big bet on Russia. They assumed that Russia would never default on its debt. After all, that’s something that had never happened with a nuclear power. That is, until it did. Russia defaulted and LTCM got totally wiped out. It all happened in a few days.
The problem for the Fed was that half of Wall Street had lent them money. At one point, the fund was worth $4.7 billion. After they went bust, Warren Buffett offered to buy LTCM for $250 million. He gave them one hour to decide. Ultimately, a group of Wall Street banks got together to bail them out (no government money was used).
Investors outside of the United States have become used to news emanating from New York and Washington driving capital markets. Perhaps for the first time, American investors will have to stand and watch what’s happening in China. I don’t know if the Chinese economy is in trouble, but Wall Street economists have been cutting their forecasts for Chinese GDP growth. That means tourism in the U.S. I noticed that shares of Disney (DIS) were down over 4% today.
It’s all connected, so said the butterfly.
Stock Focus: Veeva Systems
I like to say that the only thing better than owning a monopoly is owning a near-monopoly. After all, the real thing tends to draw too much attention.
That leads to me this week’s stock which is Veeva Systems (VEEV) of Pleasanton, CA. While Veeva isn’t technically a monopoly, it enjoys many of the advantages that a monopoly has. Veeva is a cloud-computing company that’s focused on pharmaceutical and life sciences industry applications. The company was founded in 2007 by Peter Gassner and Matt Wallach. Gassner has become a billionaire along the way and he currently serves as CEO.
What Veeva does is help drug companies capture clinical trial data and follow regulations while letting their sales forces to be more effective. The company has been very successful. Veeva recently became the fifth SaaS (software-as-a-service company) to join the billion-dollar revenue club. The key is that Veeva brings the benefits of cloud computing to a single industry.

This is a critical time for Veeva due to Covid-19. Running all those clinical trials normally involves visiting doctors and researchers. Veeva allows that to happen virtually, which places Veeva’s services in great demand. A particular strength is that Veeva helps its clients comply with government regulations.
I have to confess that watching Veeva has become somewhat entertaining because Wall Street consistently predicts that Veeva’s remarkable run is about to come to an end. Yet each quarterly earnings report easily dispels that notion.
The last report was especially good. On September 1, Veeva said that total revenues for Q3 jumped 29% to $455 million. Not bad. A key stat is that subscription revenue increased by 29% to $366 million. That’s a very good number. All things being equal, I prefer to see a company with strong recurring revenue.
Quarterly earnings came in at 94 cents per share. That beat Wall Street’s forecast by seven cents per share. Veeva has now beaten Wall Street’s consensus for at least the last 32 quarters in a row. (It could be even longer, but that’s as far back as my data goes.)
In the earnings report, Veeva also offered guidance for Q3 and the rest of the fiscal year. For the current quarter, ending October 31, Veeva sees revenues ranging between $464 and $466 million. The company sees earnings of 87 to 88 cents per share. That’s a small range which I take to be a hint.
For the full fiscal year which ends on January 31, Veeva projects revenues of $1.830 to $1.835 billion, and earnings of $3.57 per share. While that’s an optimistic forecast, it didn’t satisfy everyone.
Like I said, Veeva has been ganged up on more than once by a nest of short-sellers. Their mantra has been, “Sure, Veeva’s had some impressive growth until now but the total addressable market isn’t that large.” I think that’s way off-base. In fact, I think cloud is only the beginning.
Now let’s get to some truly remarkable stats. Veeva maintains gross margin in excess of 70%. That’s very impressive. Their operating margins are consistently over 25% and the company doesn’t carry any long-term debt. That’s a testament to how strong a position Veeva has in its market. Peter Gassner has referred to Veeva as having delivered what he calls “30/30” quarters, meaning 30% growth and 30% operating margins.
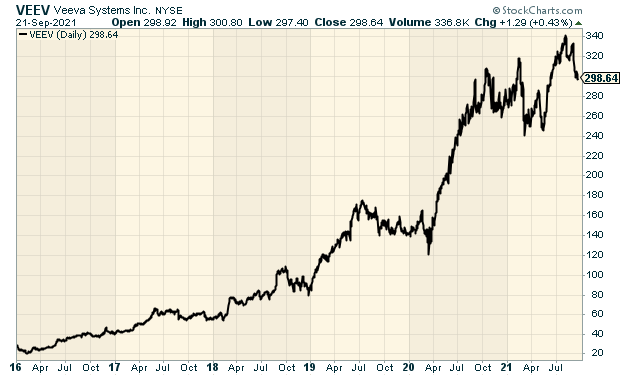
The stock has been a phenomenal winner (see the chart above). Five years ago, you could have picked up one share of VEEV for $40. Lately, VEEV has traded near $300. That’s quite a run.
While I like Veeva a lot, I’m not a fan of the share price. It’s run too far too fast. Even if we assume the company’s optimistic forecast is correct (and it probably is), that means Veeva is currently trading at 83 times this year’s earnings estimate. That’s about four times what many other stocks go for.
I understand the need to pay for growth, but investors must keep things in perspective. Even if Veeva continues to cream estimates, the stock is still very pricey. Veeva Systems is definitely a stock to watch, but it’s not even close to being a Buy until it’s close to $150 per share. Even that is still pretty rich.
– Eddy
P.S. If you haven’t had a chance, you can subscribe to our premium newsletter. It’s only $20 a month or $200 a year. Please join us!
-
Morning News: September 21, 2021
Posted by Eddy Elfenbein on September 21st, 2021 at 7:04 amGlobal Markets Swoon as Worries Mount Over Superpowers’ Plans
Fortunes Tumble From Seattle to Shenzhen in $135 Billion Wipeout
U.K. Warns of Challenging Few Days as Energy Crisis Deepens
There’s a Fortune to Be Made in the Obscure Metals Behind Clean Power
Lael Brainard Walks Tightrope Toward Next Job With Fed Chair in Play
Wall Street’s Message on Evergrande: China Has It Under Control
Royal Dutch Shell Sells Permian Basin Oil Holdings for $9.5 Billion
Mnuchin’s Private Equity Fund Raises $2.5 Billion
Bezos Puts $1 Billion of $10 Billion Climate Pledge Into Conservation
Uber CEO Aims for ‘Fully Green’ Food-Delivery Business
DoorDash to Offer Alcohol Delivery in 20 States and DC
A Caribbean Island’s Audacious Tourism Experiment
Holiday Bummer: Now Prices Are Soaring for Christmas Trees and Decorations
The Economic Mistake the Left Is Finally Confronting
The Taper, When It Comes, Will Feel Like a Relief
Be sure to follow me on Twitter.
-
Ugly Day Comes to a Close
Posted by Eddy Elfenbein on September 20th, 2021 at 4:36 pmYuck, that was an ugly day!
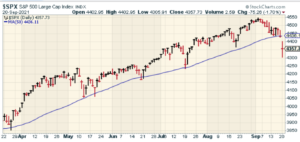
At its low, the S&P 500 was down 2.87%. At least we had a decent rally off the low. The S&P 500 gained 1.20% off today’s low. By the closing bell, the S&P 500 was down 1.70%.
At one point, the Dow was off by 971 points.
This kind of day is almost perfectly made for our Buy List to outperform. Five of our Buy List stocks closed higher and nineteen of our 25 stocks beat the S&P 500 today.
It’s not that we were brilliant today. Rather it reflects the relative conservatism of our portfolio.
It always sounds odd to talk about outperformance on a down day, but that’s important for our strategy.
-
Stocks Sees Biggest Drop Since May
Posted by Eddy Elfenbein on September 20th, 2021 at 10:38 amThe stock market is starting to feel some pain. As I write this, the S&P 500 has been down as much as 1.7% this morning. We haven’t seen a loss like that since May. Of course, there’s a lot of trading to do between now and the closing bell.
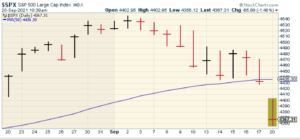
The warning sign came on Friday when the S&P 500 closed just below its 50-day moving average (that’s the blue line on the chart below). Until now, the 50-DMA has been like a trampoline. Every time the market has gotten near it, the bulls have rushed in to save the day. Well, they’re nowhere to be seen this morning.
The S&P 500 hasn’t closed below its 50-DMA on back-to-back days since last October. That’s the longest such streak in 25 years.
What’s the reason for the selloff? There’s a lot of talk about Evergrande going belly up. That’s a Chinese development firm that has way too much debt. The fear is that we’re near a “Lehman moment” where one crack in the wall highlights many, many cracks. Of course, there are lots of folks who claim we’re near a Lehman moment every week.
-
Morning News: September 20, 2021
Posted by Eddy Elfenbein on September 20th, 2021 at 7:09 amA ‘Perfect Storm’ is Brewing in India’s Investment Scene, Says VC Investor
Evergrande Gave Workers a Choice: Loan Us Cash or Lose Your Bonus
China Property Fear Spreads Beyond Evergrande, Roiling Markets
The Global Housing Market Is Broken, and It’s Dividing Entire Countries
Global Supply Shortages Reach All the Way to a Haitian Aid Group
Biden’s Entire Presidential Agenda Rests on Expansive Spending Bill
Why the Fed Might Welcome a Bond Market Tantrum
With the Focus on a Taper, Five Questions for the Fed
The Taper That Will Really Bite Into U.S. Growth Isn’t the Fed’s
How Accounting Giants Craft Favorable Tax Rules From Inside Government
How Car Rentals Explain the 2021 Economy
Google’s Former AI Ethics Chief Has a Plan to Rethink Big Tech
Gates Raises $1 Billion as Corporate CEOs Join Race to Scale Clean Tech
Antitrust Is Happily Dying Before Our Eyes, and Judges Are the Reason
The Pandemic Has Sparked a Book Craze — and Barnes & Noble is Cashing In
Be sure to follow me on Twitter.
-
Thermo Fisher Jumps on Investor Day
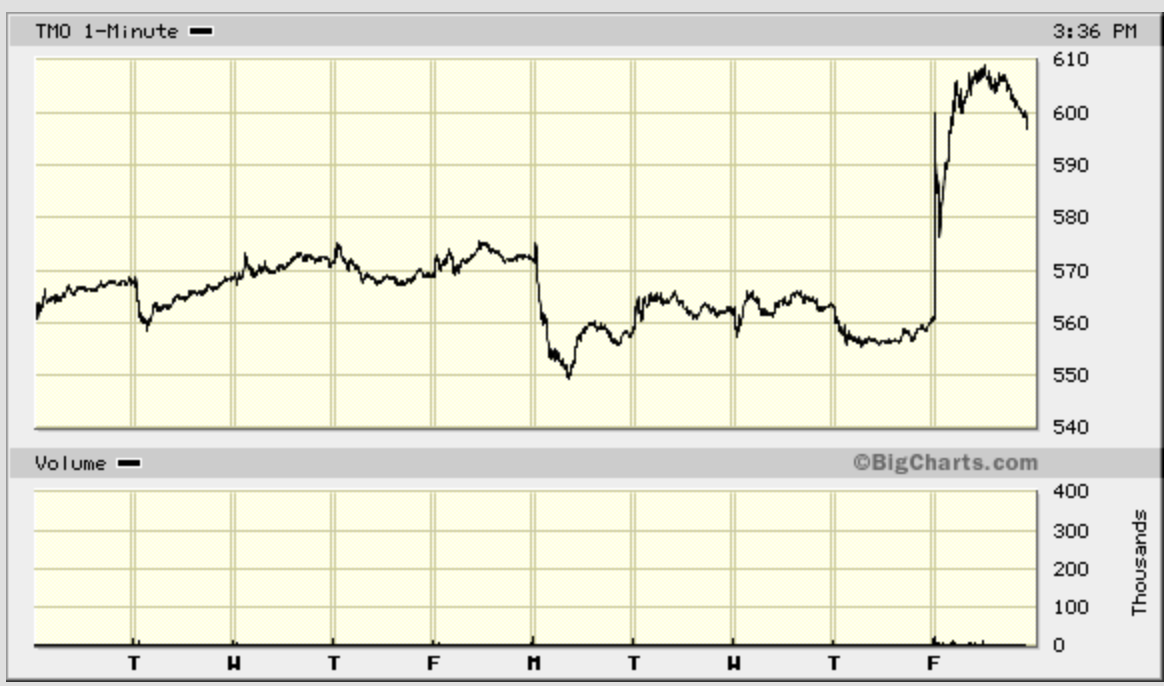
Posted by Eddy Elfenbein on September 17th, 2021 at 3:51 pmThermo Fisher (TMO) had its Investor Day today and the shares are reacting well to what the company had to say. For 2021, TMO sees earnings of $22.07 per share on revenue of $35.9 billion. That’s up from $19.55 per share and $32.2 billion for last year. The 2021 guidance is the same as what they’ve said before.
Thermo offered initial guidance for 2022 of $21.16 per share and revenue of $40.3 billion. In 2025, Thermo sees earnings of $31.04 to $31.84 per share on revenue of $4.88 to $5.08 billion.
Shares of TMO have been up as much as 8.7% today.
-
Morning News: September 17, 2021
Posted by Eddy Elfenbein on September 17th, 2021 at 7:00 amEurope’s Energy Crisis Is Driving Up Natural Gas Prices Worldwide
Do We Need to Shrink the Economy to Stop Climate Change?
China Applies to Join Pacific Trade Pact to Boost Economic Clout
China Adds $14 Billion Cash as Evergrande’s Pain Roils Markets
Inquiry Finds World Bank Officials, Including Now-I.M.F. Chief, Pushed Staff to Inflate China Data
November? December? Fed’s ‘Taper’ Timeline Tied to Volatile Jobs Data
If Your CEO Talks Like Kant, Think Twice Before Investing
Wall Street Influencers Are Making $500,000, Topping Even Bankers
Hedge Funders Are Chasing Crypto Despite Warnings of a Possible Crash
Banks Beware, Amazon and Walmart are Cracking the Code for Finance
Retailers Rethink Pandemic-Battered Manhattan
‘Shang-Chi’ Wins a Warm Asia Greeting. Then There’s China.
Where Did It All Go So Wrong for Juul?
Be sure to follow me on Twitter.
-
Jobless Claims and Retail Sales
Posted by Eddy Elfenbein on September 16th, 2021 at 11:17 amTwo economic reports this morning. First, unemployment claims rose to 332,000. That’s up 20,000 from last week which itself was revised higher by 2,000. Last week’s figure of 312,000 is the current pandemic low.
By the way, the unemployment figures are roughly in line with some of the numbers we saw seven years ago. In other words, we’re getting back to something that looks like normal.
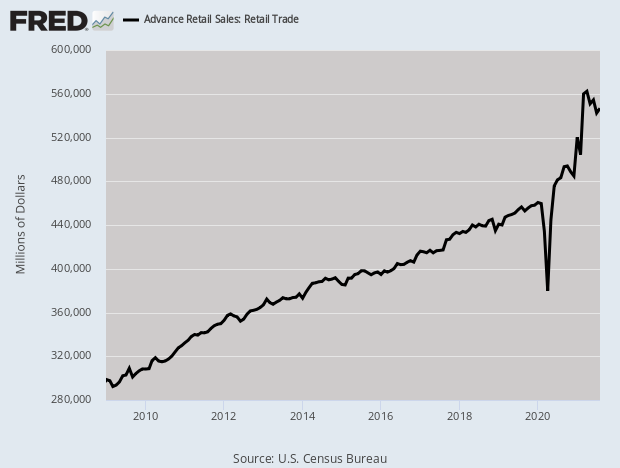
The other report was retail sales. For August, retail sales rose by 0.7%. In the last year, retail sales are up 15.1%. That number surprised Wall Street. Economists had been expecting a decline of 0.8%. The number for July was revised downward from -1.1% to -1.8%.
Economists had expected that consumers cut back their activity as the delta variant continued its tear through the U.S. Persistent supply chain bottlenecks also were expected to hold back spending as in-demand goods were hard to find.
The pandemic’s impact did show up in sales at bars and restaurants, which were flat for the month though still 31.9% ahead of where they were a year ago.
However, sales were strong for most areas during the month, when back-to-school shopping generally results in a pickup in activity, especially so this year as schools prepared to welcome back students after a year of remote learning.
The headline number would have been even better without a 3.6% monthly drop in auto-related activity; excluding the sector, sales rose 1.8%, also well above the 0.1% expected gain.
Just a reminder that the Fed meets again next week.
-
Morning News: September 16, 2021
Posted by Eddy Elfenbein on September 16th, 2021 at 7:04 amWhen the Dragon Sneezes, Europe Catches a Cold
Japan Cuts Economic View on Weaker Production, Spending Due to COVID Revival
These Charts Show Impact of China’s Casino Crackdown on Macau
No Chinese Stock Left Among Global Top 10 as Tencent Slides
China Intensifies Hunt for Cryptocurrency Miners in Hiding
The Coinbase Spat With the SEC Ups the Ante in Washington’s Crypto Fight
Democratic Tax Proposal Takes Aim at ETFs
Boom for Banks as M&A and Pandemic Boost Corporate FX Needs
Delta Tells the Economy, Not So Fast
‘Just Get Me a Box’: Inside the Brutal Realities of Supply Chain Hell
U.S. Poverty Fell Last Year as Government Aid Made Up for Lost Jobs
The Battle for Digital Privacy Is Reshaping the Internet
What the Privacy Battle Upending the Internet Means for You
Climate Change Calls for Backup Power, and One Company Cashes In
Chevron CEO Warns of High Energy Prices and Supply Crunches
Be sure to follow me on Twitter.
-
August Industrial Production Increased by 0.4%
Posted by Eddy Elfenbein on September 15th, 2021 at 1:19 pmA quiet day so far. The stock market is up today after falling six times in seven days. I don’t think you’ll see many shallower losses for six-in-seven-day stretches. We also came somewhat close to the 50-day moving average. That can be an important psychological breaking point, but not always.
Once again, energy stocks are doing the heavy lifting. Energy had been lagging since March. Only recently has it perked up again.
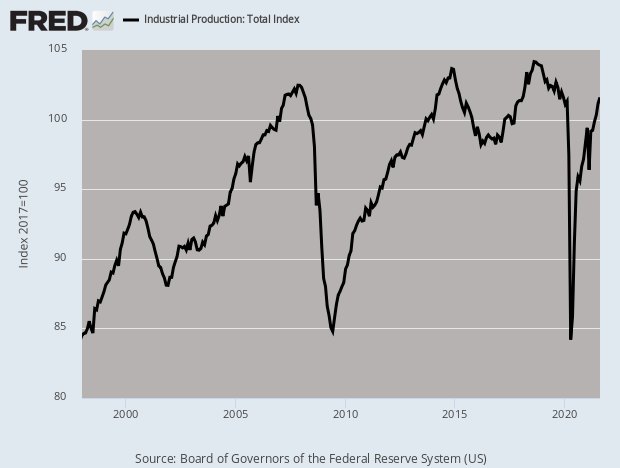
The Federal Reserve released the industrial production report this morning. Last month, industrial production increased by 0.4%. The Fed said that Hurricane Ida chopped off 0.3% from that number. The increase for July was revised up to a gain of 0.8%.
Industrial production is now 0.3% below its pre-pandemic peak. This was our sixth monthly increase in a row.
-
Archives
- August 2026
- July 2026
- June 2026
- May 2026
- April 2026
- March 2026
- February 2026
- January 2026
- December 2025
- November 2025
- October 2025
- September 2025
- August 2025
- July 2025
- June 2025
- May 2025
- April 2025
- March 2025
- February 2025
- January 2025
- December 2024
- November 2024
- October 2024
- September 2024
- August 2024
- July 2024
- June 2024
- May 2024
- April 2024
- March 2024
- February 2024
- January 2024
- December 2023
- November 2023
- October 2023
- September 2023
- August 2023
- July 2023
- June 2023
- May 2023
- April 2023
- March 2023
- February 2023
- January 2023
- December 2022
- November 2022
- October 2022
- September 2022
- August 2022
- July 2022
- June 2022
- May 2022
- April 2022
- March 2022
- February 2022
- January 2022
- December 2021
- November 2021
- October 2021
- September 2021
- August 2021
- July 2021
- June 2021
- May 2021
- April 2021
- March 2021
- February 2021
- January 2021
- December 2020
- November 2020
- October 2020
- September 2020
- August 2020
- July 2020
- June 2020
- May 2020
- April 2020
- March 2020
- February 2020
- January 2020
- December 2019
- November 2019
- October 2019
- September 2019
- August 2019
- July 2019
- June 2019
- May 2019
- April 2019
- March 2019
- February 2019
- January 2019
- December 2018
- November 2018
- October 2018
- September 2018
- August 2018
- July 2018
- June 2018
- May 2018
- April 2018
- March 2018
- February 2018
- January 2018
- December 2017
- November 2017
- October 2017
- September 2017
- August 2017
- July 2017
- June 2017
- May 2017
- April 2017
- March 2017
- February 2017
- January 2017
- December 2016
- November 2016
- October 2016
- September 2016
- August 2016
- July 2016
- June 2016
- May 2016
- April 2016
- March 2016
- February 2016
- January 2016
- December 2015
- November 2015
- October 2015
- September 2015
- August 2015
- July 2015
- June 2015
- May 2015
- April 2015
- March 2015
- February 2015
- January 2015
- December 2014
- November 2014
- October 2014
- September 2014
- August 2014
- July 2014
- June 2014
- May 2014
- April 2014
- March 2014
- February 2014
- January 2014
- December 2013
- November 2013
- October 2013
- September 2013
- August 2013
- July 2013
- June 2013
- May 2013
- April 2013
- March 2013
- February 2013
- January 2013
- December 2012
- November 2012
- October 2012
- September 2012
- August 2012
- July 2012
- June 2012
- May 2012
- April 2012
- March 2012
- February 2012
- January 2012
- December 2011
- November 2011
- October 2011
- September 2011
- August 2011
- July 2011
- June 2011
- May 2011
- April 2011
- March 2011
- February 2011
- January 2011
- December 2010
- November 2010
- October 2010
- September 2010
- August 2010
- July 2010
- June 2010
- May 2010
- April 2010
- March 2010
- February 2010
- January 2010
- December 2009
- November 2009
- October 2009
- September 2009
- August 2009
- July 2009
- June 2009
- May 2009
- April 2009
- March 2009
- February 2009
- January 2009
- December 2008
- November 2008
- October 2008
- September 2008
- August 2008
- July 2008
- June 2008
- May 2008
- April 2008
- March 2008
- February 2008
- January 2008
- December 2007
- November 2007
- October 2007
- September 2007
- August 2007
- July 2007
- June 2007
- May 2007
- April 2007
- March 2007
- February 2007
- January 2007
- December 2006
- November 2006
- October 2006
- September 2006
- August 2006
- July 2006
- June 2006
- May 2006
- April 2006
- March 2006
- February 2006
- January 2006
- December 2005
- November 2005
- October 2005
- September 2005
- August 2005
- July 2005
 Eddy Elfenbein is a Washington, DC-based speaker, portfolio manager and editor of the blog Crossing Wall Street. His