-
Still More Deflation
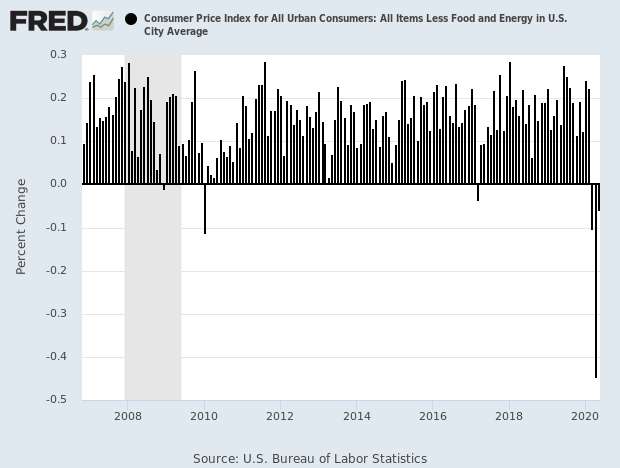
Posted by Eddy Elfenbein on June 10th, 2020 at 12:00 pmThis morning’s CPI showed that inflation fell by 0.1% last month. This was the third monthly drop in a row. This comes after the CPI fell by 0.8% in April.
In the 12 months through May, the CPI gained 0.1%. That was the smallest year-on-year rise since September 2015 and followed a 0.3% increase in April. Economists polled by Reuters had forecast the CPI would be unchanged in May and gain 0.2% year-on-year.
The National Bureau of Economic Research, the arbiter of U.S. recessions, declared on Monday that the economy slipped into recession in February. Nonessential businesses were shuttered in much of the country in mid-March to slow the spread of COVID-19, the respiratory illness caused by the novel coronavirus, almost bringing the economy to a halt.
Excluding the volatile food and energy components, the CPI slipped 0.1% in May after decreasing 0.4% in April, the largest drop since the series started in 1957. The so-called core CPI fell in March for the first time since January 2010.
The stock market is down a bit today. The Federal Reserve’s policy statement will come out this afternoon. Also, Chairman Powell will hold a press conference.
Here’s a look at the monthly change in the core rate. It appears to be getting back to normal. We’ll see.
-
Morning News: June 10, 2020
Posted by Eddy Elfenbein on June 10th, 2020 at 7:02 amEconomic Impact Of The Coronavirus Crisis Is ‘Dire Everywhere,’ OECD Says
China Factory Gate Deflation Deepens On Global Demand Slump
Expats Fleeing Dubai Is Bad News for the Economy
ECB Prepares ‘Bad Bank’ Plan For Wave Of Coronavirus Toxic Debt
With Crisis Response In Place, Fed Looks To Long Term
A $22 Trillion Stock Rally Now Hinges on Rapid Economic Recovery
Virus Splinters Global Economy, Exposing Inequality Fault Lines
What Are Fintechs and How Can They Help Small Business?
‘Morally Impossible’: Some Advertisers Take a Timeout From Facebook
Jack Dorsey’s Stand Against Trump Marks a Long-Debated Red Line
CrossFit C.E.O. Greg Glassman Steps Down in Chaos
AMC Says ‘Almost All’ U.S. Theaters Will Reopen in July
Tesla Model Y: The Legacy Car Killer
Nick Maggiulli: The Depth of Privilege
Ben Carlson: 5 Signs This Might Be a New Bull Market
Be sure to follow me on Twitter.
-
Nasdaq 10,000
Posted by Eddy Elfenbein on June 9th, 2020 at 2:58 pmAt 1:43 pm ET, the Nasdaq Composite broke 10,000 for the first time ever.
The index has nearly doubled its famous peak from 20 years ago.
The index was started in 1971 at 100. It’s now up 100-fold in just under 50 years. The Nasdaq Composite first got to 1,000 in 1995.
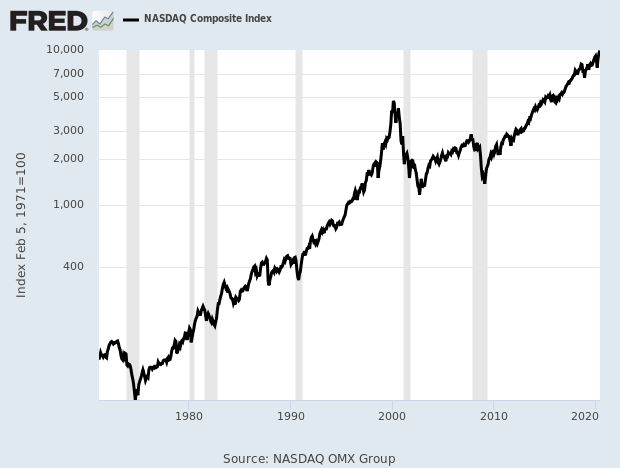
There are about 2,500 in the index, but the Nasdaq 100 contains about 90% of the full Nasdaq’s weighting.
-
Morning News: June 9, 2020
Posted by Eddy Elfenbein on June 9th, 2020 at 7:11 amU.S. Failed to Properly Oversee Chinese Telecom Carriers: Senate Panel
Behind China’s Twitter Campaign, a Murky Supporting Chorus
Prepping Portfolios for Next Market Storm? Not Just Gold and Govvies
Stock Markets in Europe Fall. Wall Street May Follow.
Despite Recession, Stock Markets Turn Positive for the Year
Once Bitten, Not Shy: Investors Again Seek Margin Loans As Stocks Rally
Debt Shakeout Poised to Make FAANG, Giant Retailers Even Bigger
Apple Plans to Announce Move to Its Own Mac Chips at WWDC
IBM Exits Facial Recognition Business, Calls for Police Reform
TSMC Scores Subsidies and Picks Site for $12 Billion U.S. Plant
In India, the YouTube-TikTok Rivalry Turns Nasty
Michael Batnick: The Fastest Stock Market Ever & How to Talk to Your Friend About Picking Stocks
Roger Nusbaum: You’re Not Smarter Than Stanley Druckenmiller
Cullen Roche: What if the Stock Market is Exactly Right?
Howard Lindzon: The Rarest Asset of All…Time
Be sure to follow me on Twitter.
-
Positive for the Year
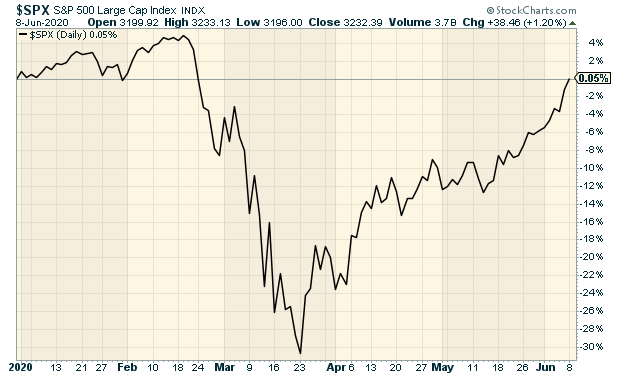
Posted by Eddy Elfenbein on June 8th, 2020 at 8:08 pmThanks to a big push over the last few days, the S&P 500 is now positive for the year.
Well, it’s barely positive…but it’s still positive. For the year, the S&P 500 is up 0.05%. That means for every $20 you invested in the index, you now have a profit of one penny!
Of course we can compare that with a few weeks ago when the index was down 30%!
-
Mistakes in the Jobs Report
Posted by Eddy Elfenbein on June 8th, 2020 at 10:50 amThe monthly jobs report has unfortunately become politicized. Prominent figures on both sides have accused the other of cooking the data. This is baseless conspiracy thinking.
Interestingly enough, the BLS admitted that the data in Friday’s report was incorrect. They put out the wrong data with an explanation. The BLS will revise the figures next month. They don’t do it immediately in order to avoid the appearance of political pressure.
When the U.S. government’s official jobs report for May came out on Friday, it included a note at the bottom saying there had been a major “error” indicating that the unemployment rate likely should be higher than the widely reported 13.3 percent rate.
The special note said that if this “misclassification error” had not occurred, the “overall unemployment rate would have been about 3 percentage points higher than reported,” meaning the unemployment rate would be about 16.3 percent for May. But that would still be an improvement from an unemployment rate of about 19.7 percent for April, applying the same standards.
The Bureau of Labor Statistics, the agency that puts out the monthly jobs reports, said it was working to fix the problem.
Instead of some conspiracy, I think it’s simply hard to get accurate data during such extreme events.
-
Nine Wins in Eleven Sessions
Posted by Eddy Elfenbein on June 8th, 2020 at 10:36 amThe stock market is up again this morning. This could be the ninth up day in the last 11 sessions. We’re also seeing a continuation of the theme of strong cyclical stocks. The Energy Sector is doing very well so far. Industrials and Financials are also leading the pack. This may suggest that Wall Street believes the economy has turned around. We’ll see.
The Federal Reserve meets tomorrow and on Wednesday. This meeting will also have a press conference by Chairman Powell. I don’t expect any major policy changes from the Fed, but it will be interesting to hear what Powell has to say.
I want to reiterate a point I made in the newsletter — cyclicals stocks are starting to lead the market impressively over the last month. This could suggest Wall Street sees a faster-than-expected recovery.
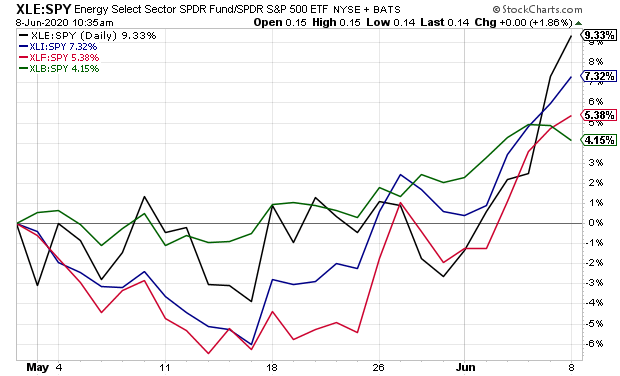
The graph above is the four main cyclical sector ETFs divided by the SPY. Notice also that the 2/10 Spread has gotten wider.
-
Morning News: June 8, 2020
Posted by Eddy Elfenbein on June 8th, 2020 at 7:05 amU.S. Shale Companies Are Turning the Oil Taps Back On
Stock Markets Drift Lower in a Bad Sign for Wall Street
Fed Says Beating Pandemic Is Key, But How Will It Know Things Are Better?
U.S. Fed’s Main Street Lending Facility Likely To Start With A Whimper
Morgan Stanley Makes New Bet on a Steepening U.S. Yield Curve
Local Austerity Will Hold Back U.S. Rebound Like It Did in 2010
Scarred and Scared: Post-Covid Consumers Not Their Old Selves
Farmers Get Billions in Virus Aid, and Democrats Are Wary
Airlines Got $25 Billion in Stimulus; Industry Still Expected to Shrink
‘Corporate America Has Failed Black America’
This Week In Business: The Fight Over Inflammatory Language
Reebok And Athletes Cut Ties With CrossFit Over Founder Greg Glassman’s George Floyd Tweet
Joshua Brown: 10% of Jobs Lost Due to the Virus Have Come Back in May
Michael Batnick: Animal Spirits Talk Your Book: How to Make Better Financial Decisions With Daniel Crosby & Automate Automate Automate
Ben Carlson: The Craziest Charts of the Year (So Far) & The 2020 Stock Market By the Numbers
Cullen Roche: What if the Stock Market is Exactly Right?
Be sure to follow me on Twitter.
-
May Jobs Report
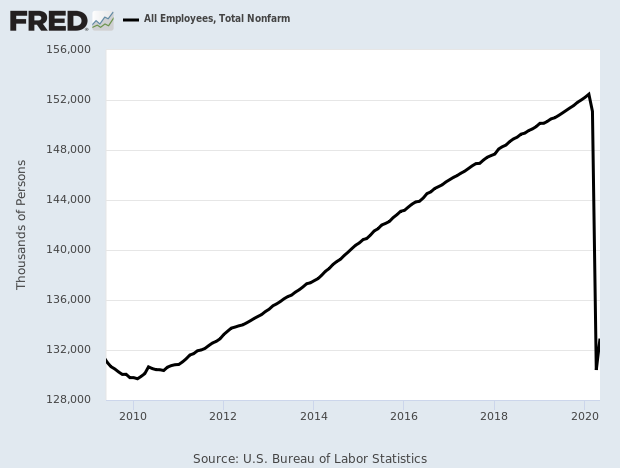
Posted by Eddy Elfenbein on June 5th, 2020 at 8:57 amHere’s the May jobs report. There was a gain of 2.5 million for nonfarm payrolls. The unemployment rate fell to 13.3%. Economists had been expecting 19%.
Employment stunningly rose by 2.5 million in May and the jobless rate declined to 13.3% according to data Friday from the Labor Department that was far better than economists had been expecting and indicated that an economic turnaround could be close at hand.
Economists surveyed by Dow Jones had been expecting payrolls to drop by 8.333 million and the unemployment rate to rise to 19.5% from April’s 14.7%.
Stock market futures burst higher following the report and indicated an open of nearly 600 points higher for the Dow Jones Industrial Average.
The May gain was by far the biggest one-month jobs gain in U.S. history since at least 1939.
-
CWS Market Review – June 5, 2020
Posted by Eddy Elfenbein on June 5th, 2020 at 7:08 am“There is scarcely an instance of a man who has made a fortune by speculation and kept it.” – Andrew Carnegie
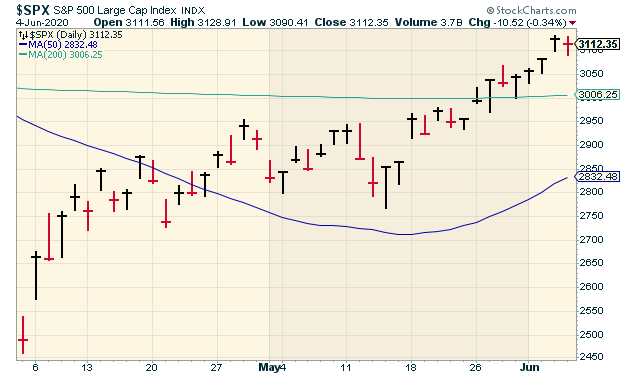
This was obviously a tense and distressing week for our country. As usual, I’ll eschew any political commentary, but I will note that despite the drama of recent events, this was a fairly placid week for the stock market—and for our Buy List. On Wednesday, the S&P 500 broke above 3,100 for the first time in three months.
The S&P 500 closed lower on Thursday, but before then, it had rallied for four days in a row, for seven times in eight sessions. The S&P 500 isn’t too far from an all-time high. In fact, the Nasdaq 100 Index already made a new high this week. (This is an indexed skewed toward large-cap tech companies.)
Here’s a look at the S&P 500 over the past few weeks:
Our Buy List is also doing well. Eleven of our 25 stocks are positive for the year. At this rate, there’s a good chance that the Buy List as a whole will be positive for the year very soon. On Thursday, Danaher and FactSet both reached new 52-week highs. RPM International got to a new high on Wednesday. Our Buy List is up over 40% from its low.
In this week’s CWS Market Review, I want to take a closer look at some of the recent economic news. (Warning: It ain’t pretty.) I also want to comment on an emerging trend that’s unfolding just beneath of the surface of the stock market. I’ll also have some updates on our Buy List stocks (Middleby!). But first, let’s look at some terrible, horrible, no good, very bad economic news.
The Worst Jobs Market in Decades
I’m sending this newsletter on Friday morning, a few hours ahead of the May jobs report. That means I don’t have the numbers just yet, but I expect they will be very unpleasant. The report for April indicated that 20.5 million Americans had lost their jobs. The unemployment rate jumped to 14.7%. That’s the highest since the great Depression. The report for May should be similarly poor.
Last week, I mentioned the downward revision to the Q1 GDP report. The day after the GDP report, we typically get the reports on personal income and spending. This time, they were very unusual reports. For April, personal income rose by 10.5% while personal spending decreased by 13.6%. The lockdown has screwed with even boring economic stats. The personal-savings rate soared to 33%. That’s not even close to a typical number for this data series.
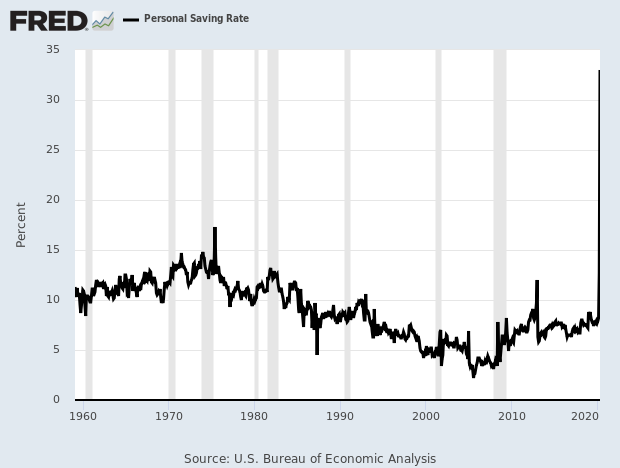
This tells you just how unusual the current economic climate is. We’ve never been in a situation where the economy didn’t merely slow down, but froze in place.
On Monday, we got a look at the ISM Manufacturing report. This report usually comes out on the first business day of the month. I like this report because the lag time is fairly low, although we should be aware that the factory segment of the U.S. economy is no longer its driving force.
Monday’s report came in at 43.1. That’s actually not so terrible, though it’s not good. That’s up from 41.5 for April, which was an 11-year low. This almost certainly signals that a U.S. recession began in March or April. The National Bureau of Economic Research is the most respected “recession-dating” organization. NBER hasn’t yet made an official announcement on the timing of a recession, but I think they’ll say something before the end of this year.
By the way, you’ll often hear that a recession is defined as back-to-back quarters of negative economic growth. We’ll most certainly get that when the Q2 GDP number comes out in late July. However, that’s not the correct definition of a recession.
NBER calls a recession “a significant decline in economic activity spread across the economy, lasting more than a few months, normally visible in real GDP, real income, employment, industrial production, and wholesale-retail sales.” The 2001 recession happened without back-to-back quarters of negative growth.
On Monday, we also learned that construction spending fell 2.9% in April. That’s also bad, but not as bad as it could have been. It’s the lowest number since October 2018.
On Wednesday, ADP released its report on private payrolls. It showed that the economy lost 2.76 million private-sector jobs last month. As bad as that is, it was much better than expectations.
This morning’s ADP payroll report showed that the U.S. economy shed 2.76 million jobs last month. As bad as that is, it’s much better than expectations. The ADP report doesn’t always align with the government’s numbers.
Then on Thursday, the jobless-claims report showed that 1.877 million Americans filed for first-time jobless claims. That marks the ninth decline in a row (meaning a decline in the increase in the number of folks out of work). Economists had been expecting 1.775 million new claims. This was the first time since March 14 that the number came in fewer than two million.
The economic stats will continue to be poor as long as the economy remains closed. Fortunately, states and localities are gradually reopening. This has to be done with safety as the foremost priority. Only when businesses get back to something resembling normal will we see the economic numbers improve. Hopefully, that will be evident before the end of the summer.
Has the Cycle Turned?
I like to keep an eye on how well cyclical stocks are doing. These are companies whose fortunes are closely tied to the economic cycle. Cyclicals tend to move in strong up-down waves, hence the name cyclicals.
There’s no official definition or even index (that I know of) for cyclicals. Personally, I think of them as the four key cyclical sectors: Financials, Energy, Materials and Industrials.
Energy and Materials are obvious candidates for this category. In fact, I wouldn’t mind seeing these two sectors merged into one. Call it something like Natural Resources. The Energy sector has fallen so much that I wonder why it’s still a stand-alone sector. These two sectors behave very similarly anyway.
Industrials are an interesting sector in that they have the strongest correlation to the overall market. In other words, they’re the most like everyone else. As a result, the relative strength of the industrials tends to fluctuate the least.
You may be surprised that I classify Financials as cyclicals. I think they are, but they’re not pure cyclicals like the others.
Here’s a look at the relative strength of the ETFs of the four sectors divided by the ETF of the S&P 500. This figure allows us to see how well the cyclicals are doing compared with the rest of the market.
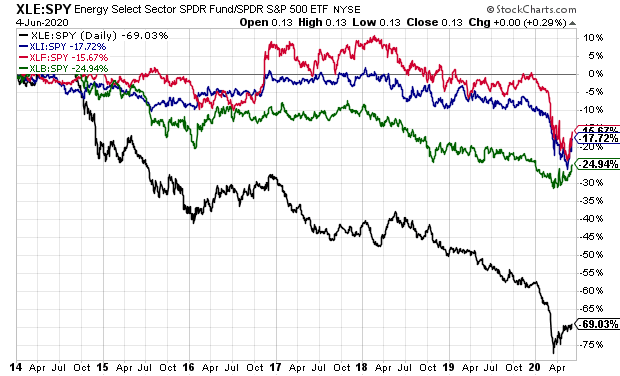
Energy, the black line, is certainly an outlier. However, we can see that all four sectors have lagged the market for a few years. Notice also that they all had prominent bounces a few weeks ago.
Looking at the relative performance of cyclical stocks is important because it tells us what the market is thinking. Also, once a trend gets established, it can last for several years. It’s not that cyclical stocks are in any sense better than defensive stocks. It’s about where we are in the cycle.
Cyclical stocks also benefit from a double-whammy effect. This means that they tend to outperform the market when the market itself does well. Conversely, they lag the market when the market does poorly. That’s certainly been the case this year.
Could this be the start of a long trend? I can’t say just yet, but it wouldn’t surprise me. With cyclicals, the key is spotting when the cycle changes, and it’s been several years since cyclicals have led the charge.
How do you know if your stock is a cyclical? On our Buy List, it would include businesses like Silgan (SLGN), Danaher (DHR), RPM International (RPM), Stepan (SCL) and Eagle Bancorp (EGBN).
Wall Street has shifted its thinking toward a cyclical recovery. If that’s correct, then these stocks should continue to prosper. Now let me update you on some of our Buy List stocks.
Buy List Updates
Silgan Holdings (SLGN) said it completed the acquisition of the dispensing business of the Albéa Group. This business is a leading supplier of pumps and sprays for the beauty and personal care markets. Last year, the business generated sales of $395 million. Silgan is an 8.9% winner for us this year. SLGN remains a buy up to $36 per share.
Three weeks ago, I highlighted Middleby (MIDD) and said I liked it below $60 per share. Well, it’s certainly done well since then. On Thursday, MIDD closed near $81 per share. MIDD is close to doubling its low from late March. This week, I’m lifting our Buy Below on Middleby to $85 per share.
Moody’s (MCO) is another stock that’s been rallying very well for us. Shares of MOC are up close to 70% from its March low. The ratings agency had a blow-out earnings report for Q1. Moody’s earned $2.73 per share, which was 51 cents better than expectations. I’m raising our Buy Below on Moody’s to $290 per share.
That’s all for now. The Federal Reserve meets again next week, on Tuesday and Wednesday. I don’t expect much action from the Fed this time, but it will be interesting to hear what the central bank has to say. This will be one of the meetings where the Fed will update its economic projections. Jerome Powell will hold a post-meeting press conference. Also on Wednesday, the government will release the CPI report for May. The last report showed deflation. Be sure to keep checking the blog for daily updates. I’ll have more market analysis for you in the next issue of CWS Market Review!
– Eddy
-
Archives
- July 2026
- June 2026
- May 2026
- April 2026
- March 2026
- February 2026
- January 2026
- December 2025
- November 2025
- October 2025
- September 2025
- August 2025
- July 2025
- June 2025
- May 2025
- April 2025
- March 2025
- February 2025
- January 2025
- December 2024
- November 2024
- October 2024
- September 2024
- August 2024
- July 2024
- June 2024
- May 2024
- April 2024
- March 2024
- February 2024
- January 2024
- December 2023
- November 2023
- October 2023
- September 2023
- August 2023
- July 2023
- June 2023
- May 2023
- April 2023
- March 2023
- February 2023
- January 2023
- December 2022
- November 2022
- October 2022
- September 2022
- August 2022
- July 2022
- June 2022
- May 2022
- April 2022
- March 2022
- February 2022
- January 2022
- December 2021
- November 2021
- October 2021
- September 2021
- August 2021
- July 2021
- June 2021
- May 2021
- April 2021
- March 2021
- February 2021
- January 2021
- December 2020
- November 2020
- October 2020
- September 2020
- August 2020
- July 2020
- June 2020
- May 2020
- April 2020
- March 2020
- February 2020
- January 2020
- December 2019
- November 2019
- October 2019
- September 2019
- August 2019
- July 2019
- June 2019
- May 2019
- April 2019
- March 2019
- February 2019
- January 2019
- December 2018
- November 2018
- October 2018
- September 2018
- August 2018
- July 2018
- June 2018
- May 2018
- April 2018
- March 2018
- February 2018
- January 2018
- December 2017
- November 2017
- October 2017
- September 2017
- August 2017
- July 2017
- June 2017
- May 2017
- April 2017
- March 2017
- February 2017
- January 2017
- December 2016
- November 2016
- October 2016
- September 2016
- August 2016
- July 2016
- June 2016
- May 2016
- April 2016
- March 2016
- February 2016
- January 2016
- December 2015
- November 2015
- October 2015
- September 2015
- August 2015
- July 2015
- June 2015
- May 2015
- April 2015
- March 2015
- February 2015
- January 2015
- December 2014
- November 2014
- October 2014
- September 2014
- August 2014
- July 2014
- June 2014
- May 2014
- April 2014
- March 2014
- February 2014
- January 2014
- December 2013
- November 2013
- October 2013
- September 2013
- August 2013
- July 2013
- June 2013
- May 2013
- April 2013
- March 2013
- February 2013
- January 2013
- December 2012
- November 2012
- October 2012
- September 2012
- August 2012
- July 2012
- June 2012
- May 2012
- April 2012
- March 2012
- February 2012
- January 2012
- December 2011
- November 2011
- October 2011
- September 2011
- August 2011
- July 2011
- June 2011
- May 2011
- April 2011
- March 2011
- February 2011
- January 2011
- December 2010
- November 2010
- October 2010
- September 2010
- August 2010
- July 2010
- June 2010
- May 2010
- April 2010
- March 2010
- February 2010
- January 2010
- December 2009
- November 2009
- October 2009
- September 2009
- August 2009
- July 2009
- June 2009
- May 2009
- April 2009
- March 2009
- February 2009
- January 2009
- December 2008
- November 2008
- October 2008
- September 2008
- August 2008
- July 2008
- June 2008
- May 2008
- April 2008
- March 2008
- February 2008
- January 2008
- December 2007
- November 2007
- October 2007
- September 2007
- August 2007
- July 2007
- June 2007
- May 2007
- April 2007
- March 2007
- February 2007
- January 2007
- December 2006
- November 2006
- October 2006
- September 2006
- August 2006
- July 2006
- June 2006
- May 2006
- April 2006
- March 2006
- February 2006
- January 2006
- December 2005
- November 2005
- October 2005
- September 2005
- August 2005
- July 2005
 Eddy Elfenbein is a Washington, DC-based speaker, portfolio manager and editor of the blog Crossing Wall Street. His