-
The Rebound in Eagle
Posted by Eddy Elfenbein on October 30th, 2019 at 11:59 amLet me state upfront that this graph isn’t completely kosher because it begins the day after the 27% drop in shares of Eagle Bancorp (EGBN).
But we’ve talked a lot about the crash; let’s look at the recovery:

That’s not bad. Yesterday’s high was 25% above the post-drop low. I still think Eagle is a good bargain.
-
Moody’s Earned $2.15 per Share
Posted by Eddy Elfenbein on October 30th, 2019 at 7:47 amMoody’s Corporation Reports Results for Third Quarter 2019
Moody’s Corporation 3Q19 revenue of $1.2 billion up 15% from 3Q18
Moody’s Investors Service 3Q19 revenue of $747 million, up 16% from 3Q18; Moody’s Analytics revenue of $494 million, up 13%
3Q19 diluted EPS of $1.99 increased 25% from 3Q18; adjusted diluted EPS of $2.15 up 27%
FY 2019 diluted EPS and adjusted diluted EPS guidance ranges increased to $7.20 to $7.35 and $8.05 to $8.20, respectivelyMoody’s Corporation (MCO) today announced results for the third quarter of 2019, as well as updated its current outlook for full year 2019.
“Moody’s revenue increased 15% in the third quarter as Moody’s Investors Service benefited from strong corporate and public finance sector bond issuance amid favorable market conditions. Furthermore, Moody’s Analytics continued to deliver robust performance across all business lines, particularly in ERS, driven by solid demand for its analytical solutions,” said Raymond McDaniel, President and Chief Executive Officer of Moody’s. “In light of stronger than anticipated top-line growth and disciplined expense management, we are raising our full year 2019 adjusted diluted EPS guidance range to $8.05 to $8.20.”
ASSUMPTIONS AND OUTLOOK FOR FULL YEAR 2019
Moody’s outlook for 2019 is based on assumptions about many geopolitical conditions and macroeconomic and capital market factors, including interest rates, foreign currency exchange rates, corporate profitability and business investment spending, mergers and acquisitions, consumer borrowing and securitization, and the amount of debt issued. These assumptions are subject to uncertainty, and results for the year could differ materially from our current outlook. Our guidance assumes foreign currency translation at end-of-quarter exchange rates. Specifically, our forecast for the remainder of 2019 reflects exchange rates for the British pound (£) of $1.23 to £1 and for the euro (€) of $1.09 to €1.
-
Morning News: October 30, 2019
Posted by Eddy Elfenbein on October 30th, 2019 at 7:03 amTrade and Fed Rate Worries Offset $50 Billion M&A Deal News, Sapping Stocks’ Strength
It’s a Big Week for Economic News, With Implications for the 2020 Race
Fed Prepares to Pause After Third Rate Cut: Decision Day Guide
State of Health Among American Men Reveals Death and Despair
The Drone Wars Are Already Here
Toyota’s Support of Trump’s Emissions Rules Shocks Californians
Fiat Chrysler in Merger Talks With PSA, Maker of Peugeot
HBO Max Sets Price ($15 a Month) and Target Date (Next May)
Amazon is Rolling Out Free Grocery Delivery to All Prime Members
Sony to Shut Down PlayStation Vue, a Cable Alternative
J&J’s Own Expert, Working for FDA, Found Asbestos in Baby Powder
A Secretive Family Landing a $4 Billion Haul Has Everyone Guessing
Ben Carlson: Dear Bernie Sanders, Banning Buybacks Won’t Help
Michael Batnick: Stock-Picking Struggles & The Most Bullish Signal in the World
Be sure to follow me on Twitter.
-
Stryker Earned $1.91 per Share
Posted by Eddy Elfenbein on October 29th, 2019 at 4:53 pmStryker (SYK) reported Q3 earnings of $1.91 per share.
Reported net sales increased 10.6% to $3.6 billion
Organic net sales increased 8.6%
Reported operating income margin of 17.5%
Adjusted operating income margin(1) expanded 50 bps to 25.4%
Reported EPS decreased 20.6% to $1.23
Adjusted EPS increased 13.0% to $1.91, at the high end of guidance range“We delivered another strong quarter of results, with organic sales growth of 8.6% and adjusted EPS growth of 13%,” said Kevin A. Lobo, Chairman and Chief Executive Officer. “We expect this momentum to continue, which positions us well to deliver above the high end of our initial guidance range for both organic sales and adjusted EPS.”
Sales Analysis
Consolidated net sales of $3.6 billion increased 10.6% in the quarter and 11.5% in constant currency. Organic net sales increased 8.6% in the quarter including 9.3% from increased unit volume partially offset by 0.7% from lower prices.
Orthopaedics net sales of $1.3 billion increased 7.8% in the quarter and 8.8% in constant currency. Organic net sales increased 8.8% in the quarter including 10.1% from increased unit volume partially offset by 1.3% from lower prices.
MedSurg net sales of $1.6 billion increased 9.2% in the quarter and 10.0% in constant currency. Organic net sales increased 8.8% in the quarter including 9.2% from increased unit volume partially offset by 0.4% from lower prices.
Neurotechnology and Spine net sales of $0.7 billion increased 19.4% in the quarter and 20.2% in constant currency. Organic net sales increased 7.6% in the quarter including 7.8% from increased unit volume partially offset by 0.2% from lower prices.
2019 Outlook
Based on our performance to date and anticipated strength in the remainder of the year, we now expect 2019 organic net sales growth to be toward the higher end of our previously guided range of 7.5% to 8.0% and expect adjusted net earnings per diluted share(2) to be in the range of $8.20 to $8.25. For the fourth quarter we expect adjusted net earnings per diluted share(2) to be in the range of $2.43 to $2.48. If foreign currency exchange rates hold near current levels, we expect net sales in the fourth quarter and full year will be negatively impacted by approximately 1.0%, and net earnings per diluted share will be negatively impacted by approximately $0.02 in the fourth quarter and $0.15 in the full year.
-
Black Tuesday — 90 Years Ago Today
Posted by Eddy Elfenbein on October 29th, 2019 at 1:31 pmOctober 29, 1929 was Black Tuesday on Wall Street. This was the day that really broke the market because it was supposed to be a rebound. The market had fallen sharply the day before, and the week before.
The Monday-Tuesday decline was over 25%. That’s larger than the one-day fall in 1987. It still ranks as the worst two-day plunge in market history.
Volume reached 16 million shares. Workers had to stay overtime to process the whole thing. The volume record would stand for the next 40 years.
Check out the coverage from the New York Times:
By THE NEW YORK TIMES
The second hurricane of liquidation within four days hit the stock market yesterday. It came suddenly, and violently, after holders of stocks had been lulled into a sense of security by the rallies of Friday and Saturday. It was a country-wide collapse of open-market security values in which the declines established and the actual losses taken in dollars and cents were probably the most disastrous and far-reaching in the history of the Stock Exchange.
That the storm has now blown itself out, that there will be organized support to put an end to a reaction which has ripped billions of dollars from market values, appeared certain last night from statements by leading bankers.
Although total estimates of the losses on securities are difficult to make, because of the large number of them not listed on any exchange, it was calculated last night that the total shrinkage in American securities on all exchanges yesterday had aggregated some $14,000,000,000, with a decline of about $10,000,000,000 in New York Stock Exchange securities. The figure is necessarily a rough one, but nevertheless gives an idea of the dollars and cents recessions in one of the most extraordinary declines in the history of American markets.
It was not so much the little trader or speculator who was struck by yesterday’s cyclone; it was the rich men of the country, the institutions which have purchased common stocks, the investment trusts and investors of all kinds. The little speculators were mostly blown out of their accounts by the long decline from early September. Thousands of them went headlong out of the market on Thursday. It was the big man, however, whose holdings were endangered yesterday and who threw his holdings into the Stock Exchange for just what they would bring, when hysteria finally seized him.
Market Leaders Hard Hit
Shares of the best known American industrial and railroad corporations smashed through their old lows of Thursday, and most of them to the lowest level for many years, as wave after wave of liquidation swept the market during its day of utter confusion and rout. As bid after bid was filled for stocks and more and more offered, stocks of the best grade dropped almost perpendicularly, with 2, 3, 5 and even 10 points between sales under probably the most demoralized conditions of trading in the history of the Stock Exchange and the Curb.
United States Steel declined 17 1/2, General Electric lost 47 1/,; United States Industrial Alcohol, 39 1/2; Standard Gas, 40 1/2; Columbia Gas, 22; Air Reduction, 48 7/8; Allied Chemical & Dye, 36; Baltimore & Ohio, 13 3/8; A.M. Byers Company, 30 3/4; Chesapeake & Ohio, 23 1/2; New York Central, 22 5/8; Peoples Gas, 40 1/2; Westinghouse Electric, 34 1/4; Western Union, 39 1/2; and Worthington Pump, 29.
These are the blue chips of the market, seasoned stocks based on the country’s leading industries, and which have lead the way up the ladder of fluctuations over many months of the now thoroughly defunct bull market. They, and many others, are the issues in which speculation has been most rampant. But stocks of all kinds were affected by the market’s second debacle. The good went down with the bad and levels undreamed of in Wall Street a month or so ago were crashed through before the resistless assault of a headlong and in many cases senseless wave of liquidation.
Causes of Crash Varied
Yesterday’s far-reaching decline in stocks may be ascribed mainly to a general loss of confidence in the market and the inability of any man or group to stem such a torrent of selling, which came from all parts of the world. European selling forming a very material percentage of the stocks forced on the market. But there were thousands of ramifications to the market and many factors, too, which served to add their quota of pressure.
Among these may be enumerated: Belated liquidation from Thursday’s crash, when the market did not rally promptly from the decline.
The cleaning out of several stale pools, whose holdings, in some cases large, went into the market for what they would bring.
The immediate drying up of buying power on the part of the general public, already badly hit in the smash of Thursday.
Bear selling for the decline of an adroit and unspectacular fashion.
The mob psychology which impels holders of stocks in all parts of the country to try to sell them all at once when the market shows signs of giving way.
Margin calls which went out of Wall Street by the thousands and which mainly were answered by orders to sell at the market.
The catching of stop-loss orders, many of them put in months ago.
Day’s Sales 9,212,800 Shares
The statistical record of yesterday’s tremendous day furnished proof that in many respects it did not equal last Thursday’s trading, although the declines were larger. Trading on the Stock Exchange aggregated 9,212,800 shares, as compared with 12,894,650 on Thursday. On the Curb Market sales were 4,152,900 shares, as compared with 6,837,415 in last week’s violent decline.
Once again the lateness of the tickers added to the confusion and as a guide to the trading were well-nigh worthless. At ten-minute intervals the floor prices were flashed on the bond tickers; and the Dow, Jones news tickers and the New York News Bureau tickers furnished running flows of quotations as they were received from the floor of the Exchanges. It was only by these methods of expediency that Wall Street was able to keep up with the market at all, and in most brokerage houses all attempts to keep their quotation boards up to date were abandoned. It just could not be done.
Pool’s Purpose Misunderstood
One of the difficulties that beset the market was the popular misconception that the banking pool, organized by J. P. Morgan & Co., the First National Bank, the National City Bank, the Guaranty Trust Company, the Equitable Trust Company, and the Chase National Bank would throw funds into the market to save it. What the bankers had set out to do, with their consortium, was merely to supply bids where no bids existed and to plug up the “air hole” which the market had developed on Thursday. They had no idea of putting the market up, or saving any one’s profits. Rather the general plan was to provide a degree of stabilization on which further liquidation could take place, if it proved necessary.
The rally of Friday and the steadiness of the market, which returned to normal on Saturday, could be attributed partly to this misconception, partly to a temporary restoration of confidence by the public generally. The long Sunday holiday gave traders the opportunity to think over their own particular problems. Those who still had profits in the market could visualize them slipping away; those who had losses feared that they might be extended still further. There was that very large definite quota, too, who had received margin calls over the week’s end and who had decided to get out of the market completely.
Opening Weak and Nervous
At any rate, stocks opened weak, nervous and unsettled. Steel, at 202 1/4 was off 1 /1/4. International Telephone and Telegraph at 100 was off 3, General Electric at 290 was off 7 1/2, and there were similar reactions from Saturday’s closing figures.
The opening quotations were a surprise and a shock to Wall Street and to the country, which watched its tickers at 10 o’clock with feverish anxiety. It had been generally believed that some sort of organized support had been arranged over Sunday and that the market, at least, would be a steady one. Most persons believed that the storm of liquidation had blown itself out and that while the market might not advance, still it would not decline very far and that the orderly readjustments started on Friday and Saturday could be completed.
But these reckonings had been made without taking into consideration the deep-seated fear of a smashing and declining market by the thousands of holders of stocks at home and abroad. They had been through a tempestuous and nerve-wracking week and the answer to the opening quotations was a veritable flood of selling which swept the market from its feet.
Steel Leads in Decline
Steel pounded down through 200, and 5 to 10 point declines all over the list had been established by 10:30 o’ clock. By 11 o’ clock the market was in the identical state of demoralization that characterized it on Thursday when the bottom dropped out. Each set of figures brought news of a lower level of prices, and stocks were going down 5 to 10 points in an hour, with support evidently of a very chary character and without power to stem the torrent of liquidation which again was flowing over the country’s Exchanges.
From nervous irregularity at the opening, the tone became weak and it continued increasingly weak right through to the close, with nervousness and hysteria becoming more emphasized during the final hour of trading when almost 3,000,000 shares were dealt in on the Stock Exchange.
It was in this final hour that the greatest damage was done. Terror reigned on the Stock Exchange, on the Curb and in the brokerage offices. A curious hush fell over customers’ rooms in strange contrast to the pushing, whirling, shouting mob of brokers on the floor of the Exchanges who strove with might and main to execute their orders. Few men or women spoke. Most of them merely watched with fascinated eyes the jumping hieroglyphics. Most of them had been sold out. But they held to their chairs and watched the quotations as if hypnotized.
Rush of Sales Increases
The mounting volume and the declining quotations synchronized with each other during the entire day. Sales to 10:30 on the Stock Exchange were 815,600 shares; by 12 o’clock they had mounted to 3,135,200; by 1:30 to 5,547,900; by 2:10 to 6,328,500, with the total finally footing up to 9,212,800.
The statistical record of the day’s debacle, as measured by the averages compiled by The New York Times, which have been maintained since 1911, reflected the greatest decline in history, and the industrial averages and the combined, that is, twenty-five representative railroad and twenty-five representative industrial shares, sold down to new low points for the year. Little more than two months ago all of them established new highs. Figured by these measures, the rails declined 9.31, and the industrials 49.12, the combined dropping 29.22. The industrials reached a high of 469.49 on Sept. 19. Yesterday they dropped to 314.95, a decline of 154.54. The combined average of fifty stocks sold at their high for all time on Sept. 19 was 311.90. The decline since that date, to yesterday’s low of 222.57, has been 89.33 points.
Wild Rumors Current
One of the features of the day’s trading was the large number of rumors afloat. These involved houses as well as individuals, but none of them was believed to be true. Thus far, the financial district has got through the most disastrous break in its history in exceptionally good fashion. As on Thursday, there were many reports of suicides in Wall Street, none of which was true. There was no mistaking the gravity of the situation which has developed, however, or the attitude with which leading bankers and brokers view it.
There was but one brief respite during the day. At 1:10 P.M. the news tickers reported that Charles E. Mitchell had just entered the Morgan offices. Wall Street jumped to the conclusion that another banking conference was on, and stocks steadied momentarily. Steel common was then selling on the floor of the Exchange at 193 1/2. A Morgan broker on the floor of the Stock Exchange started bidding for Steel, and the market leader immediately rallied to 198. But the rally was short-lived. Ten minutes later Steel was back to 190 and stocks started once more on the violent smash that did not stop until the bell halted trading.
-
Morning News: October 29, 2019
Posted by Eddy Elfenbein on October 29th, 2019 at 7:17 amAramco IPO’s Local Push May Dim Saudi ‘Vision’
Vietnam Is a Trade War Winner. Now It Has To Figure Out How To Stay Ahead.
Why the Economy Might Not Sway 2020 Voters
Australia Says Google Misled Consumers Over Location Tracking
Google, In Rare Stumble, Posts 23% Decline in Profits
Google Owner Alphabet in Bid to Buy Fitbit
Amazon Set to Challenge Loss of $10 Billion Pentagon JEDI Cloud Computing Contract
Biggest Private Coal Miner Goes Bust After Trump Rescue Fails
The Men Who Would Be King of Glencore Move Into the Spotlight
AT&T Deals With Elliott. Now It Needs to Nail HBO Max.
Richard Branson’s Virgin Galactic Is a Huge Financial Risk
California Blackouts Hit Cellphone Service, Fraying a Lifeline
Howard Lindzon: Momentum Monday – Earnings Earnings Earnings
Joshua Brown: Why the Stock Market Rallies Into Year End & Bond Market is Trick Or Treating at the Fed
Jeff Carter: Returns to Angel Investing
Ben Carlson: Talk Your Book: Crossing Wall Street with Eddy Elfenbein
Be sure to follow me on Twitter.
-
Repost: How the Market Behaves at All-Time Highs
Posted by Eddy Elfenbein on October 28th, 2019 at 1:35 pmFinance people tend to be numbers people. I’d certainly include myself in that group. You can mention any financial topic and there are dozens of studies, charts and regressions on it. Name it and the numbers have been crunched.
This obscures an important point. All these numbers do is explain a few basic truths about the market. What can be told with numbers only reinforces what can be said with words, and usually in only a few words.
The important truths about the market aren’t many and they aren’t complicated. Investors need to understand them. On Monday, for example, I highlighted the recent behavior of Royal Caribbean (RCL). The stock dove in October due to fears of Ebola. It’s recovered and gone on to soar to new heights.
With our RCL example, the important truth is that stocks oscillate between large, quick downdrafts and long, slow up trends. The downs are fast and dramatic, the recoveries are slow and boring. Yet, it’s the boring part that makes all the difference. People spend too much time worrying about the painful declines and not enough time on riding out the long rallies.
Earlier this year, I looked at all the daily closes for the S&P 500 going back to the 1930s. I found that all the days where the market went up or down by more than 1.17% canceled each other out. The entire gain came from the low volume days. You hear a lot about tail risk, but the important part of the distribution is the tall heads.
(Incidentally, the market’s returns aren’t merely fat-tailed, they’re tall-headed as well. That’s “leptokurtic” if you’re looking to impress people.)
Most of the market’s big one-day gains have come right after big one-day losses. I asked Ryan Detrick, a must-follow on Twitter, to look at how the S&P 500 has behaved when it’s at a new all-time high. As I suspected, the market is far calmer than it normally is, and the return has been better as well.
Since 1950, there have been 1,026 trading days following a new high. (Technically, we could say the study goes back to 1929 because it took until 1954 for the index to make a new high.) That’s about 6.2% of the time, or one new high in every 16.1 days.
Of those 1,026 new highs, the market rose the following day nearly 56% of the time. That compares with 53% for all days.
To me the arresting fact is the standard deviation. For all market days, the standard deviation is 0.965%. But when the market’s at a new high, it’s only 0.611%. That’s more than 36% less volatility.
In the last 60 years, the S&P 500 has risen by more than 2% following a new high just three times. The normal market sees 2% up days more than four times more frequently. It’s probably more appropriate to say that volatility rises when the market is off its high than to say that volatility is lower at the top.
In the last 60 years, the biggest rally off a new high came on January 6, 1999 when the S&P 500 gained 2.21%. Of all days, that’s only the 265th best day.
If you had invested solely in those 1,026 days (with no transaction costs), you would have made 95.6%. Those 1,026 days are equal to about four years. The annualized return works out to 18%.
Let’s consider this hypothetical. Let’s say the entire stock market only offered two rewards. For 95% of the time, the market gained 1.2% a month. For 5% of the time, it lost 10% a month. Those are your only two outcomes.
That’s a good way to think about market behavior. The annualized outcome of our hypothetical is about 7.5%, but there are pronounced dips along the way. If you invest for several years, you’ll likely experience more than a few down months bunched together. The long-term trend, however, is unmistakable.
You’ll notice that market commentators spend far too much time talking about the inevitable declines than they do on what drives the vol gains. As a successful investor, view downturns as both necessary and fleeting.
(This post originally appeared on August 12th, 2015.)
-
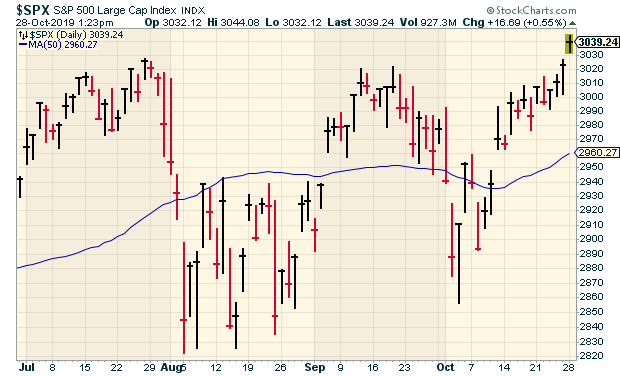
All-Time High
Posted by Eddy Elfenbein on October 28th, 2019 at 1:24 pmThe S&P 500 is up to a new all-time high today. If you recall, the S&P 500 dropped 5.6% in four days this summer. That sparked a lot of worrying that the economy was about to plunge.
All we had to do was wait a few weeks and we’re at a new high.
Since the bull market started in March 2009, there have been 25 pullbacks of 5% or more. Every single one has been turned back.
Here’s the chart. The blue line is the 50-day moving average.
-
Chatting with the Animal Spirits
Posted by Eddy Elfenbein on October 28th, 2019 at 11:07 amI’m a big fan of the Animal Spirits podcast with Michael Batnick and Ben Carlson, so it was a great honor to be invited on.
We had a fun conversation that covered several topics. Check it out.
-
Check Point Earns $1.44 per Share
Posted by Eddy Elfenbein on October 28th, 2019 at 10:59 amWe had a good earnings report this morning from Check Point Software (CHKP). The company earned $1.44 for Q3 which was four cents more than estimates.
Previously, Check Point told us to expect earnings to range between $1.36 and $1.44 per share on revenue of $480 to $500 million. Total revenue was $491 million.
I haven’t seen updated guidance yet but from the previous report, CHKP said they project full-year earnings between $5.85 and $6.25 per share and revenue between $1.94 and $2.04 billion.
The shares are up a bit in early trading.
Here are some highlights:
Total Revenue: $491 million, 4 percent increase year over year
Deferred Revenues: $1,242 million, 8 percent increase year over year
GAAP Operating Income: $214 million, representing 44 percent of revenues
Non-GAAP Operating Income: $246 million, representing 50 percent of revenues
GAAP EPS: $1.25, Non-GAAP EPS: $1.44“During the third quarter, our security subscriptions continued to drive results with 13 percent growth. This was underscored by expanded customer adoption of our cloud solutions,” said Gil Shwed, Founder and CEO of Check Point Software Technologies. “We continued to increase the breadth of our offerings with the introduction of CloudGuard Connect and CloudGuard Edge, providing enterprises with industry leading threat prevention driven by a cloud service.”
Total Revenue: $491 million compared to $471 million in the third quarter of 2018, a 4 percent increase year over year.
GAAP Operating Income: $214 million compared to $226 million in the third quarter of 2018, representing 44 percent and 48 percent of revenues in the third quarter of 2019 and 2018, respectively.
Non-GAAP Operating Income: $246 million compared to $250 million in the third quarter of 2018, representing 50 percent and 53 percent of revenues in the third quarter of 2019 and 2018, respectively.
GAAP Taxes on Income: $47 million compared to $45 million in the third quarter of 2018.
GAAP Net Income & Earnings per Diluted Share: GAAP net income was $188 million compared to $198 million in the third quarter of 2018. GAAP earnings per diluted share were $1.25, same as third quarter of 2018.
Non-GAAP Net Income & Earnings per Diluted Share: Non-GAAP net income was $217 million compared to $219 million in the third quarter of 2018. Non-GAAP earnings per diluted share were $1.44 compared to $1.38 in the third quarter of 2018, a 4 percent increase year over year.
Deferred Revenues: As of September 30, 2019, deferred revenues were $1,242 million compared to $1,148 million as of September 30, 2018, an 8 percent increase year over year.
Cash Balances, Marketable Securities & Short Term Deposits: $4,055 million as of September 30, 2019, compared to $4,072 million as of September 30, 2018.
Cash Flow: Cash flow from operations of $244 million compared to $249 million in the third quarter of 2018.
Share Repurchase Program: During the third quarter of 2019, the company repurchased approximately 2.9 million shares at a total cost of approximately $323 million.Update
Check Point provided Q4 guidance on the earnings call.
With that said, our revenues for the fourth quarter are expected to be between $527 million to $557 million and non-GAAP EPS is expected to be between $1.93 to $2.04. GAAP EPS is expected to be approximately $0.19 lower.
-
Archives
- June 2026
- May 2026
- April 2026
- March 2026
- February 2026
- January 2026
- December 2025
- November 2025
- October 2025
- September 2025
- August 2025
- July 2025
- June 2025
- May 2025
- April 2025
- March 2025
- February 2025
- January 2025
- December 2024
- November 2024
- October 2024
- September 2024
- August 2024
- July 2024
- June 2024
- May 2024
- April 2024
- March 2024
- February 2024
- January 2024
- December 2023
- November 2023
- October 2023
- September 2023
- August 2023
- July 2023
- June 2023
- May 2023
- April 2023
- March 2023
- February 2023
- January 2023
- December 2022
- November 2022
- October 2022
- September 2022
- August 2022
- July 2022
- June 2022
- May 2022
- April 2022
- March 2022
- February 2022
- January 2022
- December 2021
- November 2021
- October 2021
- September 2021
- August 2021
- July 2021
- June 2021
- May 2021
- April 2021
- March 2021
- February 2021
- January 2021
- December 2020
- November 2020
- October 2020
- September 2020
- August 2020
- July 2020
- June 2020
- May 2020
- April 2020
- March 2020
- February 2020
- January 2020
- December 2019
- November 2019
- October 2019
- September 2019
- August 2019
- July 2019
- June 2019
- May 2019
- April 2019
- March 2019
- February 2019
- January 2019
- December 2018
- November 2018
- October 2018
- September 2018
- August 2018
- July 2018
- June 2018
- May 2018
- April 2018
- March 2018
- February 2018
- January 2018
- December 2017
- November 2017
- October 2017
- September 2017
- August 2017
- July 2017
- June 2017
- May 2017
- April 2017
- March 2017
- February 2017
- January 2017
- December 2016
- November 2016
- October 2016
- September 2016
- August 2016
- July 2016
- June 2016
- May 2016
- April 2016
- March 2016
- February 2016
- January 2016
- December 2015
- November 2015
- October 2015
- September 2015
- August 2015
- July 2015
- June 2015
- May 2015
- April 2015
- March 2015
- February 2015
- January 2015
- December 2014
- November 2014
- October 2014
- September 2014
- August 2014
- July 2014
- June 2014
- May 2014
- April 2014
- March 2014
- February 2014
- January 2014
- December 2013
- November 2013
- October 2013
- September 2013
- August 2013
- July 2013
- June 2013
- May 2013
- April 2013
- March 2013
- February 2013
- January 2013
- December 2012
- November 2012
- October 2012
- September 2012
- August 2012
- July 2012
- June 2012
- May 2012
- April 2012
- March 2012
- February 2012
- January 2012
- December 2011
- November 2011
- October 2011
- September 2011
- August 2011
- July 2011
- June 2011
- May 2011
- April 2011
- March 2011
- February 2011
- January 2011
- December 2010
- November 2010
- October 2010
- September 2010
- August 2010
- July 2010
- June 2010
- May 2010
- April 2010
- March 2010
- February 2010
- January 2010
- December 2009
- November 2009
- October 2009
- September 2009
- August 2009
- July 2009
- June 2009
- May 2009
- April 2009
- March 2009
- February 2009
- January 2009
- December 2008
- November 2008
- October 2008
- September 2008
- August 2008
- July 2008
- June 2008
- May 2008
- April 2008
- March 2008
- February 2008
- January 2008
- December 2007
- November 2007
- October 2007
- September 2007
- August 2007
- July 2007
- June 2007
- May 2007
- April 2007
- March 2007
- February 2007
- January 2007
- December 2006
- November 2006
- October 2006
- September 2006
- August 2006
- July 2006
- June 2006
- May 2006
- April 2006
- March 2006
- February 2006
- January 2006
- December 2005
- November 2005
- October 2005
- September 2005
- August 2005
- July 2005
 Eddy Elfenbein is a Washington, DC-based speaker, portfolio manager and editor of the blog Crossing Wall Street. His