-
Econ Updates
Posted by Eddy Elfenbein on March 6th, 2019 at 12:53 pmThere are a few econ stats I wanted to pass along. The ADP payroll report showed an increase of 183,000 net new jobs last month. The government report is due out on Friday.
The United States imported more goods than ever last year, including a record amount from China, ballooning America’s trade deficit with the rest of the world to $891.3 billion and delivering a setback to President Trump’s goal of narrowing that gap.
The increase was driven by some factors outside Mr. Trump’s control, like a global economic slowdown and the relative strength of the United States dollar, both of which weakened overseas demand for American goods. But the widening gap was also exacerbated by Mr. Trump’s $1.5 trillion tax cut, which has been largely financed by government borrowing, and the trade war he escalated last year.
The trade deficit is the difference between how much a country sells to its trading partners and how much it buys. Mr. Trump has long boasted that his trade policies would reduce that gap, which he views as a measure of whether partners like China and the European Union are taking advantage of the United States, a diagnosis that few economists share.
Instead, in a year when Mr. Trump imposed tariffs on steel, aluminum, washing machines, solar panels and a variety of Chinese goods, the trade deficit grew by 12.5 percent from 2017, or nearly $70 billion dollars, the Commerce Department said Wednesday. The deficit in goods, which Mr. Trump particularly targets, grew to $891.2 billion for the year, its highest level in history.
The February ISM Non-manufacturing index rose to 59.7 from 56.7 in January.
-
The Market Made Its Low 10 Years Ago Today
Posted by Eddy Elfenbein on March 6th, 2019 at 11:24 amTen years ago today, on March 6, 2009, the S&P 500 finally bottomed out at its lowest point of this century. During the day, the S&P 500 got to 666. It’s more than quadrupled since then.
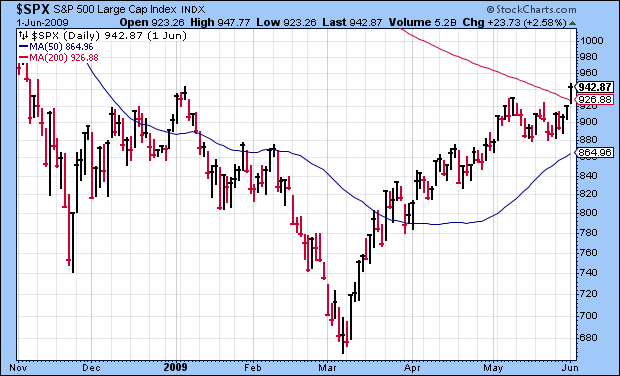
It was a Friday and that morning, the jobs report for February came out. The U.S. economy had shed 651,000 net jobs. The VIX was near 50 and the TED Spread was still about 1%. Adjusted for inflation, the Dow was basically where it was 43 years before.
The news was terrible, yet it was a great time to buy. In fact, it was one of the best times to buy in a generation.
-
Morning News: March 6, 2019
Posted by Eddy Elfenbein on March 6th, 2019 at 7:06 amOECD Cuts Global Outlook Again and Warns Worse May Be Ahead
As Trump Moves to End Trade War With China, Business Asks: Was It Worth It?
JPMorgan Leads Banks’ Flight from Poor Neighborhoods
Wall Street Regulators Could Take a Fresh Look at Bonuses
Companies Falsely Labeled Products ‘Made in U.S.A.’ Their Financial Penalty? $0.
Low-Income Tax Filers Targeted With False Promise of Big Refunds
Why Napalm Is a Cautionary Tale for Tech Giants Pursuing Military Contracts
Philip Morris Paid for India Manufacturing Despite Ban on Foreign Investment
Ousted Nissan Boss Ghosn Leaves Japan Jail After $9 Million Bail
Czech Cyber Watchdog Says Its Huawei Warning Took U.S. by Surprise
GE’s Lowered Expectations for Quick Turnaround Should Be ‘Wake-Up Call’
Someone Just Paid the Equivalent of 250 Teslas to Buy This One Car
Nick Maggiulli: No Laws, Only Tendencies
Ben Carlson: Averages Are Clean But Actual Results Are Messy
Howard Lindzon: Where Were You On March 9, 2009
Be sure to follow me on Twitter.
-
Ross Stores Earned $1.20 per Share
Posted by Eddy Elfenbein on March 5th, 2019 at 4:12 pmRoss Stores‘s (ROST) fiscal Q4 earnings are out. The deep discounter earned $1.20 per share for its fiscal Q4. That’s the big holiday shopping season. The company had given guidance of $1.09 to $1.14 per share. Sales for Q4 were $4.11 billion which topped estimates of $4.05 billion. Comp stores sales were 4% whereas the Street was expecting 2.3%.
As usual, the company gave weak guidance. Ross sees Q1 earnings of $1.05 to $1.11 per share. The Street was at $1.18.
Looking ahead, Ms. Rentler said, “While we hope to do better, we continue to take a prudent approach to forecasting our business for 2019. Although we remain favorably positioned as an off-price retailer, we face our own difficult sales and earnings comparisons, a very competitive retail landscape, and an uncertain macro-economic and political environment.”
They always say that. Ross sees full-years of $4.30 to $4.50 per share. Wall Street had been expecting $4.51 per share.
Ross is authorizing a $2.55 billion share buyback. If that’s not enough, Ross is raising its dividend. The quarterly payout will rise 13.3% from 22.5 cents to 25.5 cents per share. The new dividend is payable on March 29 to stockholders of record as of March 18.
-
Morning News: March 5, 2019
Posted by Eddy Elfenbein on March 5th, 2019 at 7:09 amChina Needs to Brace for a ‘Tough Economic Battle Ahead,’ Says Li
Widening Russia Money Laundering Scandal Hits Europe Bank Shares
Has Amazon Given Up on Changing Whole Foods’ Pricey Image?
GE: Notably Undervalued After Blockbuster Biopharma Deal
Google Finds It’s Underpaying Many Men as It Addresses Wage Equity
AT&T Assembles a Media Team, Joining a Battle With Giants
Airfares To Hawaii Plummet As Southwest Launches New Service Starting At $49
F.D.A. Criticizes Walgreens and Other Retailers for Selling Tobacco Products to Minors
Nightstar Stock Is Latest Winner From Gene-Therapy Gold Rush
Nevada’s Gold Is at Center of Barrick vs. Newmont Fight
Lilly’s 50% Price Cut to Insulin Humalog Is Still Unaffordable
Joshua Brown: This Incredible Stat Will Make You Zero Dollars!
Ben Carlson: The Alternative Was Worse
Roger Nusbaum: The Joy of Stoicism & Not Caring
Michael Batnick: Just A Little Bit More
Be sure to follow me on Twitter.
-
Morning News: March 4, 2019
Posted by Eddy Elfenbein on March 4th, 2019 at 7:14 amU.S. and China Near Deal That Could End Most U.S. Tariffs
The U.S. Is Ceding the Pacific to China
China Plans $90 Billion Cut in VAT for Manufacturers
Powell Trashed MMT, But Wall Street Sees Room for U.S. to Try It
High-Tax States Make It Hard for the Rich to Leave
Amazon’s Hard Bargain Extends Far Beyond New York
Qualcomm Launches Patent Challenge to Apple Ahead of Antitrust Case
AT&T Plans to Revamp CNN’s Digital Arm
Volvo to Limit Car Speeds in Bid for Zero Deaths
With Big Stars and Plans, Luminary Aims to Be the Netflix of Podcasts
Cullen Roche: MMT’s True Colors Appear & Reconciling Krugman vs Kelton
Howard Lindzon: Momentum Monday…Biotech Rush
Jeff Miller: Weighing the Week Ahead: What is “Baked Into” Current Market Prices?
Be sure to follow me on Twitter.
-
CWS Market Review – March 1, 2019
Posted by Eddy Elfenbein on March 1st, 2019 at 7:08 am“The market owes you nothing. Take full responsibility for everything that happens and your results will improve.” – Dan Zanger
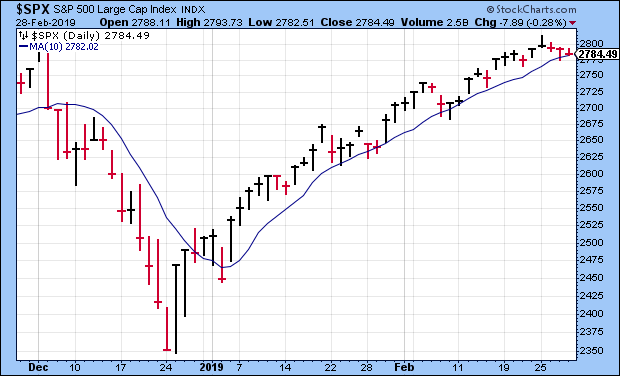
February is on the books, and it was another good month for stocks. Last December was the worst December for the market since the 1930s, and that was followed by the best January for the market since 1987.
While February was a good month for stocks (and even better for us), Wall Street has again fallen back into somnolence. The daily changes have slowed to a trickle. In nine of the last 14 trading sessions, the S&P 500 has moved up or down by less than 0.3%.
Since January 4, the S&P 500’s seen its largest drawdown, not just its largest fall, but the decline from the closing peak has been less than 1.5%. Ryan Detrick, one of my favorite technical guys, points out that the S&P 500 has closed above its 10-day moving average for 38 straight sessions. That’s the longest such streak in years.
I’m happy to report that our Buy List is off to a good start for the year. Through February, the Buy List is up 12.25%. That’s compared with 11.08% for the S&P 500. (These results don’t include dividends, although our final numbers are always dividend-adjusted.)
This week, we had some more good news. Smucker (SJM) rallied on good earnings. Check Point Software (CHKP) broke out to a new high. Continental Building Products (CBPX) rallied after its earnings report. But the biggest news is that Danaher (DHR) is buying GE’s biopharma business for $21.4 billion. Usually, the acquirer sees its stock fall after a big acquisition. Not this time. In the last four days, shares of DHR are up 12%. Let’s take a closer look at this deal and what it means for us.
Danaher Buys GE’s BioPharma Business
On Monday, Danaher (DHR) announced that it’s buying General Electric’s biopharmaceutical business for $21.4 billion. The deal is all cash. If you recall, GE’s new CEO is Larry Culp who used to be CEO of Danaher (and a person who helped make a lot of money for us.)
Nor is this the first GE garage sale that we’ve been a part of. GE sold its transportation unit to Wabtec, a former Buy List stock. That deal was completed this week.
In April, Danaher had approached GE for a deal, but GE wasn’t interested. This time, they were. Initially, GE had wanted to sell off its entire healthcare business, of which the biopharma business is just a part.
Danaher’s President and CEO, Thomas P. Joyce, Jr., said, “GE Biopharma is renowned for providing best-in-class bioprocessing technologies and solutions. This acquisition will bring a talented and passionate team as well as a highly innovative, industry-leading product suite to our Life Sciences portfolio, providing an excellent complement to our current biologics workflow solutions.”
Joyce continued, “We expect GE Biopharma to advance our growth and innovation strategy in an important and highly attractive life-science market. We see meaningful opportunities to harness the power of the Danaher Business System to further provide GE Biopharma’s customers with end-to-end bioprocessing solutions that help enable breakthrough development and production capabilities. We look forward to welcoming this talented team to Danaher.”
Danaher said the deal should be completed by the fourth quarter. Breaking down the numbers, Danaher said it’s paying 17 times expected earnings. To fund the deal, Danaher will issue a mix of debt and equity. Danaher still has plans to spin off its dental business later this year. The proceeds from that will help fund the GE deal.
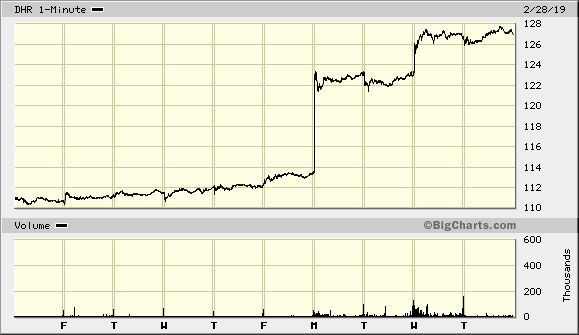
GE has been in a great deal of trouble, and the company needs to raise cash. As a result, it’s ditching assets in an attempt to save the business. The deal is good for both companies. Danaher jumped 8.5% on Monday. In fact, that was more than GE’s jump. This week, I’m raising Danaher’s Buy Below to $136 per share.
Smucker Rises on Earnings
Last Friday, JM Smucker (SJM) dropped sharply after the terrible earnings report from Kraft Heinz. But on Tuesday morning we learned that despite the problems at KHC, Smucker is doing just fine.
For their fiscal Q3, the jelly people earned $2.26 per share which beat Wall Street’s estimate of $2.02 per share. Sales rose 6% to just over $2 billion. The company also stood by its full-year forecast.
“We are pleased with the progress that we made in the third quarter to advance our consumer centric strategy for growth, including increasing contributions from new platforms such as 1850™ coffee and Jif® Power-Ups™ snacks,” said Mark Smucker, Chief Executive Officer. “Our results reflect strong sales across all of our key growth brands, including double-digit increases for Rachael Ray® Nutrish®, Smucker’s® Uncrustables®, Nature’s Recipe®, and Sahale Snacks®. We are also pleased with our cost-management efforts, as we continue to deliver on our synergy and cost-savings targets. Across all our businesses, we are executing on our strategic plan focused on meeting consumer and retail trends and delivering sustainable long-term growth.”
For the full year, which is just one more quarter, Smucker expects sales of $7.9 billion and earnings of $8.00 to $8.20 per share. They’ve already made $6.20 per share for the first three quarters, so that translates to a Q4 range of $1.80 to $2.00 per share. I’m surprised they didn’t increase that due to the big beat for Q3. Perhaps they’re being conservative.
Let’s look at SJM’s different divisions. Coffee sales were at $561 million. That’s the most profitable division. Retail consumer foods had sales of $422 million. Retail pet food was $759 million, and the international division had sales of $228 million. Yes, it’s a lot more than jelly.
SJM was up as much as 8% on Tuesday, but it’s given back some of that. Smucker is still a buy up to $114 per share.
Ross Stores Earnings Preview
The lousy retail-sales report for December scared a lot of folks. As I said, I suspect the numbers are bogus. Walmart had a very good earnings report, and I figure they know something about retail.
This Tuesday, after the close, Ross Stores (ROST) will report its fiscal Q4 earnings. Our favorite deep-discounter had a terrible end to 2018. At one point, the shares fell for 10 days in a row, for a loss of 22%.
Despite that, the Q3 report, just before Thanksgiving, was quite good. Ross earned 91 cents per share, which easily beat their guidance of 84 to 88 cents per share. For Q4, which is the all-important holiday quarter, Ross projects same-store sales growth of 1% to 2%. For EPS, they see that ranging between $1.09 and $1.14 per share. For the entire year, Ross sees earnings of $4.15 to $4.20 per share.
The stock is currently above our $92 Buy Below price. I may raise that, but I want to see the earnings report first. There’s no need to rush out and buy this one.
Buy List Updates
In last week’s issue, I told you about the earnings report from Continental Building Products (CBPX). I thought the numbers were pretty good, and I said, “look for a rebound.” But I probably underestimated how negative the market was on this stock. Apparently, Wall Street was expecting disaster, and they didn’t get it. As a result, the shares vaulted more than 8% on Friday. This week, I’m lifting my Buy Below on Continental Building to $31 per share.
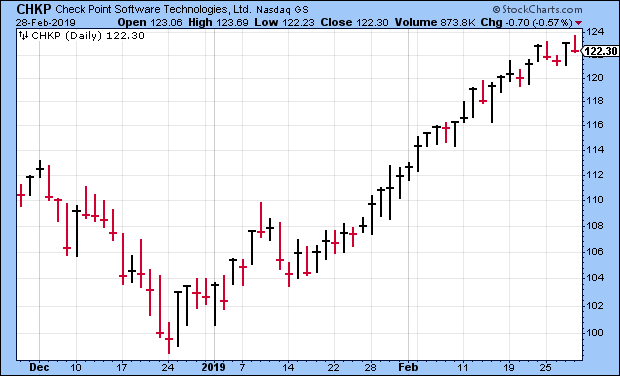
Check Point Software (CHKP) looks to be a big winner for us this year. The stock cratered late last year, and it’s made back everything it lost. It’s now up 19% for us this year. I’m looking forward to the next earnings report. For Q1, Check Point sees revenues between $460 and $480 million and EPS between $1.28 and $1.34. I’m raising our Buy Below this week to $130 per share.
There are two Buy List stocks with quarters that ended in February, FactSet (FDS) and RPM International (RPM). This week, FactSet said it will report fiscal Q2 earnings on March 26 before the market opens. I was pounding the tables on this one in December, and it’s done well for us. Wall Street is looking for earnings of $2.33 per share. The stock has run past my Buy Below, but I don’t want to increase it before I get a chance to see the next earnings report.
RPM hasn’t said when its earnings will come, but it will probably be sometime in early April. For its fiscal Q3, RPM expects earnings between 10 and 12 cents per share. RPM is our only losing stock this year, but it’s only down 1.55%.
Here’s a good example of how strong Disney (DIS) is. The company won four Oscars this week. On top of that, 21st Century Fox, which is about to be owned by Disney, won another seven Oscars. Disney is a good value here.
That’s all for now. There are a few key economic reports next week. On Monday, we’ll get construction spending. The report for new-home sales comes out on Tuesday. On Wednesday, we’ll get the ADP payroll report, plus the beige book report. Then on Friday, we’ll get the big jobs report for February. It will be interesting to see if the labor market is still improving. Be sure to keep checking the blog for daily updates. I’ll have more market analysis for you in the next issue of CWS Market Review!
– Eddy
-
Morning News: March 1, 2019
Posted by Eddy Elfenbein on March 1st, 2019 at 7:04 amGerman Juggernaut May Face Economic Jam as Tariffs and Brexit Loom
U.S. Prepares Final China Trade Deal as Hawks Urge Caution
U.S. Economy Cooled as G.D.P. Grew at 2.6% Rate in Fourth Quarter
Deepening Downdraft Chills Factory Activity
One of Wall Street’s Most Popular Trading Strategies Is Now Failing
Tesla Speeds Up! Why Aren’t You Thrilled?
Gap to Spin Off Old Navy as Stand-Alone Company, Stock Skyrockets More Than 25%
What Home Depot Wants You to Know
Uber and Lyft Said to Offer Drivers a Chance to Participate in I.P.O.s
Facebook and Telegram Are Hoping to Succeed Where Bitcoin Failed
Pour One Out for the Fading American Beer Industry
Martha Stewart Goes to Pot by Teaming Up With Canopy Growth
Roger Nusbaum: Personal Debt Is Crippling
Ben Carlson: Why Are People Miserable at Work? & The Rich Man’s Disease
Be sure to follow me on Twitter.
-
Q4 GDP Growth = 2.6%
Posted by Eddy Elfenbein on February 28th, 2019 at 9:20 amU.S. economic growth was better than expected as 2018 came to a close, with GDP rising 2.6 percent, according to a first estimate the Commerce Department released Thursday.
Economists surveyed by Dow Jones expected a gain of 2.2 percent after a 3.4 percent rise in the third quarter. The growth came amid a bevy of uncertainty and a time when the stock market briefly slid into bear market territory.
While the GDP report was only preliminary, it would mean average growth for the year was 3.1 percent.
Growth was helped by a 2.8 percent rise in consumer spending along with increased nonresidential fixed investment, exports, private inventory investment, and federal government spending. Weakness in residential fixed investment, which fell 3.5 percent, and state and local government spending served as a drag. The gross private domestic investment gain slowed to 4.6 percent in the quarter after a robust 15.2 percent rise in the previous period.
Exports rose 1.6 percent in the quarter, reversing a 4.9 percent decline in the previous quarter, while imports increased by 2.7 percent, making trade a slight net negative.
Last year was the best year for economic growth since 2005, narrowly beating out 2006 and 2015.
Here’s a look at annualized real GDP growth per capita:
50s: 2.53%
60s: 3.06%
70s: 2.19%
80s: 2.14%
90s: 2.10%
00s: 0.82%
10s: 1.48% (so far)The big surge in the early 60s is an outlier. Long-term growth was remarkably stable from the mid-1960s until the last recession.
It’s interesting how this data undercuts so much cultural history (70s = bad economy; 80s = good economy). For example, 1978 was the second-best year for growth in the last 45 years, and it was mid-cycle, too, not rebounding off the bottom. I would not have guessed that. Or, after the surge from the Korea War, growth in the 1950s wasn’t that great.
-
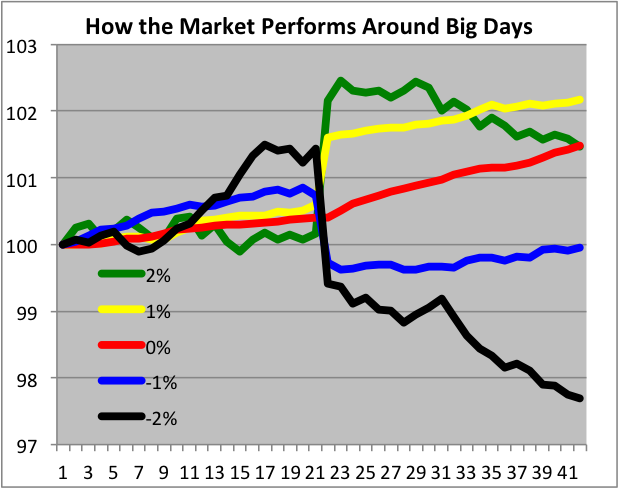
How the Market Performs Around Big Days
Posted by Eddy Elfenbein on February 28th, 2019 at 8:37 amHere’s a research project I’ve been working on. I was curious to see if the market has historically evinced any sort of pattern before and after 2% down days.
I took all the S&P 500 daily closings since 1960. I realized I needed to use some kind of band so I sorted of all the daily moves between -1.9% and -2.1%. There were 91 such days which is about 0.6% of the time. I then pulled out 41 days: the 20 days before the big drop, the big drop and the 20 days following the drop.
I found that yes, there is a pattern. The market rallies before the big drop, about 1.5% in 10 days, which shouldn’t be too unexpected. However, the market tops out five days before the drop. The market then slowly slides before – wham! Down 2%.
Here’s what I found surprising. After the 2% drop, the market has continued to sink. It’s a momentum trade, and after about 10 days, the market has really started to fall. In the 20 days following a 2% drop, the market has historically lost another 1.73%, and that’s on top of the 2% loss.
Now I was curious to know what happens after a +2% daily jump. I assumed it would be the mirror image of the 2% fall. It’s not. I found 93 such days. In the 20 days before the big jump, the market hasn’t done much of anything. It has flatlined, but after the 2% jump, the market has lost ground, but not by much; -0.67% in 20 days.
Lots of questions. Is the market reverting? How come a 2% move prompts a countertrend while a 2% drop continues one? I don’t know. Perhaps down moves are more trend-sensitive.
I then tried the same experiment but with 1% up days and 1% down days. Again, I used a band of 0.9% to 1.1%. Now we’re dealing a lot more data, around 500 days for each.
Like the -2% day, the market has rallied into a 1% drop but not as much. Unlike the -2% day, the market has rallied a little bit (a very little bit) after a 1% drop. The move works out to less than 3% annualized. The 1% drop basically has canceled out the moves before and after the drop.
The time around a 1% up day is good for the bulls. The market has rallied 0.60% ahead of the bump and another 0.55% afterwards. That’s about the long-term average, but combined with the 1% jump it makes it good for investors.
The emerging picture seems to be that high volatility is simply bad news for stocks. Market students know that the market’s best days usually happen in the middle of lousy markets, but even modestly strong days aren’t that great for stocks.
One final test. What about flat days? I found more than 1,900 days between -0.1% and +0.1%. Flat days come amid good times. Twenty days prior to flatness, the market has gained 0.40%. Annualized that’s 5.2%. But here’s the surprise, the market has gained 1.07% in the 20 days following a flat day. That’s more than 14% annualized. I didn’t see that coming.
I also looked at 3% up and down days (2.9% to 3.1%), but there isn’t a lot of data so I’d want to be humble about any conclusions. However, the market has done horribly after 3% days of any direction. Down 3.25% after 3% losses, and down 5% after 3% gains. Yikes.
Conclusion: There seems to be a horseshoe effect. Big up and big down days are bad. I would guess there’s a sweet spot, probably a mildly positive day of 0.2% or so – that’s the ideal environment.
For any future research, I would recommend looking at more days. Maybe 100 before and 100 after. I’d also look to see if there’s a discernible trend towards an ideal spot.
Here’s a chart of the data which I hope is self-explanatory.
-
Archives
- July 2026
- June 2026
- May 2026
- April 2026
- March 2026
- February 2026
- January 2026
- December 2025
- November 2025
- October 2025
- September 2025
- August 2025
- July 2025
- June 2025
- May 2025
- April 2025
- March 2025
- February 2025
- January 2025
- December 2024
- November 2024
- October 2024
- September 2024
- August 2024
- July 2024
- June 2024
- May 2024
- April 2024
- March 2024
- February 2024
- January 2024
- December 2023
- November 2023
- October 2023
- September 2023
- August 2023
- July 2023
- June 2023
- May 2023
- April 2023
- March 2023
- February 2023
- January 2023
- December 2022
- November 2022
- October 2022
- September 2022
- August 2022
- July 2022
- June 2022
- May 2022
- April 2022
- March 2022
- February 2022
- January 2022
- December 2021
- November 2021
- October 2021
- September 2021
- August 2021
- July 2021
- June 2021
- May 2021
- April 2021
- March 2021
- February 2021
- January 2021
- December 2020
- November 2020
- October 2020
- September 2020
- August 2020
- July 2020
- June 2020
- May 2020
- April 2020
- March 2020
- February 2020
- January 2020
- December 2019
- November 2019
- October 2019
- September 2019
- August 2019
- July 2019
- June 2019
- May 2019
- April 2019
- March 2019
- February 2019
- January 2019
- December 2018
- November 2018
- October 2018
- September 2018
- August 2018
- July 2018
- June 2018
- May 2018
- April 2018
- March 2018
- February 2018
- January 2018
- December 2017
- November 2017
- October 2017
- September 2017
- August 2017
- July 2017
- June 2017
- May 2017
- April 2017
- March 2017
- February 2017
- January 2017
- December 2016
- November 2016
- October 2016
- September 2016
- August 2016
- July 2016
- June 2016
- May 2016
- April 2016
- March 2016
- February 2016
- January 2016
- December 2015
- November 2015
- October 2015
- September 2015
- August 2015
- July 2015
- June 2015
- May 2015
- April 2015
- March 2015
- February 2015
- January 2015
- December 2014
- November 2014
- October 2014
- September 2014
- August 2014
- July 2014
- June 2014
- May 2014
- April 2014
- March 2014
- February 2014
- January 2014
- December 2013
- November 2013
- October 2013
- September 2013
- August 2013
- July 2013
- June 2013
- May 2013
- April 2013
- March 2013
- February 2013
- January 2013
- December 2012
- November 2012
- October 2012
- September 2012
- August 2012
- July 2012
- June 2012
- May 2012
- April 2012
- March 2012
- February 2012
- January 2012
- December 2011
- November 2011
- October 2011
- September 2011
- August 2011
- July 2011
- June 2011
- May 2011
- April 2011
- March 2011
- February 2011
- January 2011
- December 2010
- November 2010
- October 2010
- September 2010
- August 2010
- July 2010
- June 2010
- May 2010
- April 2010
- March 2010
- February 2010
- January 2010
- December 2009
- November 2009
- October 2009
- September 2009
- August 2009
- July 2009
- June 2009
- May 2009
- April 2009
- March 2009
- February 2009
- January 2009
- December 2008
- November 2008
- October 2008
- September 2008
- August 2008
- July 2008
- June 2008
- May 2008
- April 2008
- March 2008
- February 2008
- January 2008
- December 2007
- November 2007
- October 2007
- September 2007
- August 2007
- July 2007
- June 2007
- May 2007
- April 2007
- March 2007
- February 2007
- January 2007
- December 2006
- November 2006
- October 2006
- September 2006
- August 2006
- July 2006
- June 2006
- May 2006
- April 2006
- March 2006
- February 2006
- January 2006
- December 2005
- November 2005
- October 2005
- September 2005
- August 2005
- July 2005
 Eddy Elfenbein is a Washington, DC-based speaker, portfolio manager and editor of the blog Crossing Wall Street. His