-
Fed’s Minutes
Posted by Eddy Elfenbein on April 11th, 2018 at 3:33 pmThe Fed released the minutes from their March 20-21 meeting. Here are some key bits.
The information reviewed for the March 20-21 meeting indicated that labor market conditions continued to strengthen through February and suggested that real gross domestic product (GDP) was rising at a moderate pace in the first quarter. Consumer price inflation, as measured by the 12‑month percentage change in the price index for personal consumption expenditures (PCE), remained below 2 percent in January. Survey‑based measures of longer-run inflation expectations were little changed on balance.
Gains in total nonfarm payroll employment were strong over the two months ending in February. The labor force participation rate held steady in January and then stepped up markedly in February, with the participation rates for prime-age (defined as ages 25 to 54) women and men moving up on net. The national unemployment rate remained at 4.1 percent. Similarly, the unemployment rates for African Americans, Asians, and Hispanics were roughly flat, on balance, in recent months. The share of workers employed part time for economic reasons edged up but remained close to its pre-recession levels. The rates of private-sector job openings and quits increased slightly, on net, over the two months ending in January, and the four-week moving average of initial claims for unemployment insurance benefits continued to be low in early March. Recent readings showed that increases in labor compensation remained modest. Compensation per hour in the nonfarm business sector advanced 2-3/4 percent over the four quarters of last year, and average hourly earnings for all employees rose 2-1/2 percent over the 12 months ending in February.
Total industrial production expanded, on net, in January and February, with gains in both manufacturing and mining. Automakers’ schedules indicated that assemblies of light motor vehicles would likely edge down in coming months. However, broader indicators of manufacturing production, such as the new orders indexes from national and regional manufacturing surveys, pointed to further solid increases in factory output in the near term.
Consumer expenditures appeared likely to rise at a modest pace in the first quarter following a strong gain in the preceding quarter. Real PCE edged down in January, and the components of the nominal retail sales data used by the Bureau of Economic Analysis to construct its estimate of PCE rose somewhat in February while the pace of light motor vehicle sales declined slightly. However, household spending was probably held back somewhat in February because of a delay in many federal tax refunds, and the subsequent delivery of those refunds would likely contribute to an increase in consumer spending in March. Moreover, the lower tax withholding resulting from the tax cuts enacted late last year, which was beginning to show through in consumers’ paychecks, would likely provide some impetus to spending in coming months. More broadly, recent readings on key factors that influence consumer spending–including gains in employment and real disposable personal income, along with households’ elevated net worth–continued to be supportive of solid real PCE growth in the near term. In addition, consumer sentiment in early March, as measured by the University of Michigan Surveys of Consumers, was at its highest level since 2004.
Real residential investment looked to be slowing in the first quarter after rising briskly in the fourth quarter. Starts of new single-family homes increased in January and February, although building permit issuance moved down somewhat. Starts of multifamily units jumped in January but fell back in February. Sales of both new and existing homes declined in January.
Growth in real private expenditures for business equipment and intellectual property appeared to be moderating in the first quarter after increasing at a solid pace in the preceding quarter. Nominal shipments of nondefense capital goods excluding aircraft edged down in January. However, recent forward-looking indicators of business equipment spending–such as the backlog of unfilled capital goods orders, along with upbeat readings on business sentiment from national and regional surveys–pointed to further solid gains in equipment spending in the near term. Firms’ nominal spending for nonresidential structures outside of the drilling and mining sector declined in January. In contrast, the number of crude oil and natural gas rigs in operation–an indicator of business spending for structures in the drilling and mining sector–continued to move up through mid-March.
Total real government purchases seemed to be flattening out, on balance, in the first quarter after rising solidly in the fourth quarter. Nominal defense spending in January and February was consistent with a decline in real federal purchases. In contrast, real purchases by state and local governments looked to be rising, as the payrolls of these governments increased in January and February and nominal state and local construction spending advanced somewhat in January.
The change in net exports was a significant drag on real GDP growth in the fourth quarter of 2017, as imports grew rapidly. The nominal U.S. international trade deficit widened in January; exports declined, led by lower exports of capital goods and industrial supplies, while imports were about flat. The slowing of real import growth following the rapid increase in the fourth quarter suggested that the drag on real GDP growth from net exports would lessen in the first quarter.
Total U.S. consumer prices, as measured by the PCE price index, increased 1-3/4 percent over the 12 months ending in January. Core PCE price inflation, which excludes changes in consumer food and energy prices, was 1-1/2 percent over that same period. The consumer price index (CPI) rose 2-1/4 percent over the 12 months ending in February, while core CPI inflation was 1-3/4 percent. Recent readings on survey-based measures of longer-run inflation expectations–including those from the Michigan survey, the Survey of Professional Forecasters, and the Desk’s Survey of Primary Dealers and Survey of Market Participants–were little changed on balance.
Foreign economic activity expanded at a moderate pace in the fourth quarter. Real GDP growth picked up in Mexico but slowed a bit in some advanced foreign economies (AFEs) and in emerging Asia. Recent indicators pointed to solid economic growth abroad in the first quarter of this year. Inflation abroad continued to be boosted by the pass-through to consumer prices of past increases in oil prices. However, excluding food and energy prices, inflation remained subdued in many foreign economies, including the euro area and Japan.
-
CPI Fell 0.1% in March
Posted by Eddy Elfenbein on April 11th, 2018 at 11:34 amFor the first time in 10 months, consumer prices fell in March. The CPI showed a drop of 0.1%, but that was driven by lower gas prices.
That core rate, which excludes food and energy, rose 0.2% which is basically inline with the previous trend.
Here’s the headline rate:
In the last 12 months, headline inflation is up 2.36%.
Here’s a look at the core rate:
Core inflation over the last year was 2.11%.
-
Morning News: April 11, 2018
Posted by Eddy Elfenbein on April 11th, 2018 at 7:02 amTrade Threats Cloud Bright World Growth Outlook, Lagarde Says
China Will Do What’s Best for China: Not Shooting Markets
Upcoming Earnings Could Pour ‘Fuel on Fire’ for Stocks
Six Takeaways From Zuckerberg’s Time in the Senate Spotlight
Day 2 of Mark Zuckerberg’s Testimony: What to Watch For
FTC Confirms What We Suspected All Along: Those ‘Warranty Void If Removed’ Stickers Are No Good
Farmers Hit the Road to Reach Shoppers Before Amazon Does
Bank of America to Stop Financing Makers of Military-Style Guns
Boeing Reels in a Huge Order From American Airlines Group, Inc.
It Built an Empire of GIFs, Buzzy News and Jokes. China Isn’t Amused.
Theranos Lays Off Most of Its Remaining Workforce
No One Likes Necco Wafers, but People Are Hoarding Them Anyway
Lawrence Hamtil: Equal-Weighting the S&P 500 vs the S&P 400
Roger Nusbaum: Tariffs Throw A Cat Amongst The Pigeons
Joshua Brown: Managing Risk is Not the Same as Taking Less Risk
Be sure to follow me on Twitter.
-
Morning News: April 10, 2018
Posted by Eddy Elfenbein on April 10th, 2018 at 7:07 amRussian Markets Reel After U.S. Imposes New Sanctions
‘No Direct Confrontation’: Investors Voice Relief at Xi’s Speech
U.S.-China Talks Broke Down Over Trump’s Demands on High-Tech Industries
Payday Lenders Sue CFPB as Hopes for Quick Regulatory Fix Fade
The $66 Billion Bayer-Monsanto Merger Just Got a Major Green Light — But Farmers are Terrified
Mark Zuckerberg Meets With Top Lawmakers Before Hearings
Uber Acquires Bike Share Startup JUMP
Uber Loses EU Court Case in Fight Against French Criminal Charges
Alexa P2P Could Be Amazon’s Gateway to Payments
You Won’t Have to Sign for Credit Card Purchases Much Longer
Novartis Wager on AveXis Shows Rare Diseases Command Mega Prices
Ant Financial Plans $9 Billion Round of Fresh Financing
Nick Maggiulli: The Echo Chamber
Cullen Roche: Why Bitcoin Will Never Be the Dominant Form of Money
Be sure to follow me on Twitter.
-
The Rise in Volatility
Posted by Eddy Elfenbein on April 9th, 2018 at 7:25 pmIt’s hard to convey the dramatic rise in the stock market’s volatility in a graph. I think this one does a good job. It’s the daily changes of the S&P 500 from mid-September until today.
In the first two-thirds of the graph, the stock market rarely went down, and rarely rose by more than 1%. Since then, it’s gotten much more interesting. We’ve already had six 2% down days this year.
In today’s session, the Dow rose as much as 440 points. I was skeptical. I didn’t see the need for a big rise after an ugly day on Friday. At 12:27, I tweeted:
Today's rally is a lot weaker than it appears.
— Eddy Elfenbein (@EddyElfenbein) April 9, 2018
As it turns out, I got close to the top. The markets soon reversed course.
The S&P 500 closed higher by 0.33% today. While that’s not a big change for the day, we saw a lot of intraday movement. This is a very different market than the one we saw late last year.
-
Russian Stocks Plunge
Posted by Eddy Elfenbein on April 9th, 2018 at 10:25 amThe Russian stock market is plunging as the Trump administration announced new sanctions. Check out the price action in the Russian ETF (RSX).

From Bloomberg:
Russian stocks had their biggest drop in four years and the ruble slumped the most in the world after the U.S. slapped new sanctions on Kremlin-connected billionaires and tensions with the U.S. spiraled following the latest chemical attack in Syria.
The benchmark MOEX Russia Index sank 8.7 percent on Monday, the steepest slide since March 2014, when Moscow’s annexation of the Crimean peninsula triggered international penalties. The ruble and local bonds had their biggest drop since 2016 and the cost of insuring sovereign notes against default was set for the sharpest increase since December 2014.
Investors pulled out after the U.S. on Friday escalated penalties against Russia for meddling in the 2016 election by sanctioning dozens of Russian tycoons, companies and key allies of President Vladimir Putin. On top of that, U.S. President Donald Trump warned of a “big price to pay” in response to reports of a chemical attack outside Syria’s capital, saying President Vladimir Putin and Iran “are responsible for backing Animal Assad.”
“We haven’t seen such a united, mass retreat from Russian assets for a long time,” Kirill Tremasov, director of the analysis department at Loko-Invest said by phone. “The situation is ever more reminiscent of 2014.”
-
Morning News: April 9, 2018
Posted by Eddy Elfenbein on April 9th, 2018 at 7:05 amEurope Caught in the Middle as Trump Threatens China
Russian Stocks Take Worst Hit Since Crimea on Sanctions, Syria
Oil Edges Up But U.S.-China Trade Tensions Curb Gains
Rusal Sanctions Offer Light Comfort for Aluminum Prices
Expansion of Canada’s Trans Mountain Pipeline in Doubt
Novartis Bets Big on Gene Therapy With $8.7 Billion AveXis Deal
Alibaba Invests in Chinese Facial-Recognition Startup
Deutsche Bank Solves One Crisis With New CEO. Now Onto the Next
Tesla Gives Panasonic an Electric Shock
7 Ideas To Pave The Way For Autonomous Vehicles
Car Dealerships Face Conundrum: Get Big or Get Out
Spotify’s $26 Billion Value Is Hard to Put Your Finger On
Ben Carlson: Price Discovery in Bitcoin & Is College Worth the Cost?
Jeff Carter: Plenty of Non-Believers
Howard Lindzon: Apple is Dead, The New Stocktwits iOS App, and Security is Perking…
Be sure to follow me on Twitter.
-
March NFP +103K, Unemployment 4.1%
Posted by Eddy Elfenbein on April 6th, 2018 at 8:35 amThe March jobs report is out. The government says the U.S. economy created 103,000 net new jobs last month. That’s below expectations of 178,000. For the sixth month in a row, the unemployment rate held at 4.1%.
Average hourly earnings rose 0.3%. In the last year, AHE is up 2.7%.
There were big revisions to the data for January and February. The revisions totaled -50,000.
The Labor Force Participation Rate was 62.9%. The broader U-6 rate was 8.0%.
Here’s the unemployment rate:
Here’s the U-6 rate:
Labor Force Participation Rate:
-
CWS Market Review – April 6, 2018
Posted by Eddy Elfenbein on April 6th, 2018 at 7:08 am“Whenever people agree with me, I always feel I must be wrong.” – Oscar Wilde
On Monday, it finally happened. For the first time in 443 trading days, the S&P 500 closed below its 200-day moving average. Dun dun duuuun!
Actually, this is a big deal. The 200-DMA is one of those things I file under “Simple Ideas that Actually Work.” The concept isn’t that hard. The stock market is prone to momentum, and the 200-DMA is a simple way to gauge how the market is doing relative to its previous trends.
Over the long haul, the market does poorly when it’s beneath its 200-DMA. Let me be clear—I don’t favor jumping ship. In fact, I think this is actually a good time for us, and our strategy. More on that later. But it’s important to understand that this is a different market than the one we experienced over the last several months.
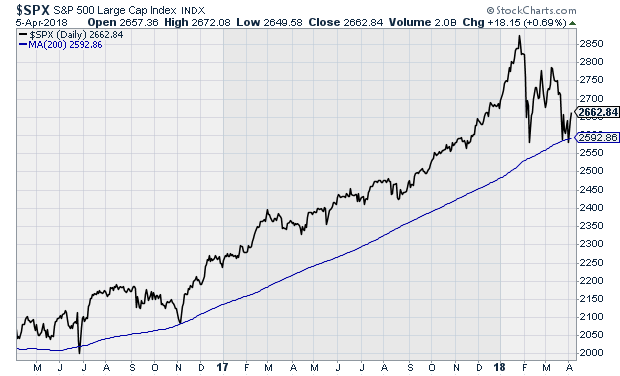
Here’s a good example. In the last two months, guess how many times the S&P 500 has fallen more than 2% in one day? I’ll give you a hint. Six. Now guess how many times it happened in 16 months prior to that? Another hint. Zero. Not one.
The market has become more volatile, more unpredictable and more unforgiving. In this week’s issue, I’ll discuss the good earnings report we got from RPM International. Also, Hormel Foods seems to be benefiting from the growing trade war. Who knew tariffs could impact pig prices? I’ll tell you what it all means. But first let’s look at why this is such a good market for stock pickers.
This Is a Good Market for Stock Pickers
One metric I like to keep track of is the relative performance of the Equally Weighted ETF (RSP) versus the S&P 500 ETF (SPY). The concept is pretty simple. The RSP is a fund that equally weights all the stocks in the S&P 500. The SPY is weighted by market value. The relationship between the two often tells us how “broad” the market is.
Over the last 16 months, the RSP badly lagged the SPY. In simple terms, the big fish have been doing most of the work while the minnows have been left behind. As a very general rule, stock pickers tend to like the minnows more than index funds or institutional investors. Whenever you hear that it was a bad year for active managers, in all likelihood, that’s a reflection of how broad the market was.
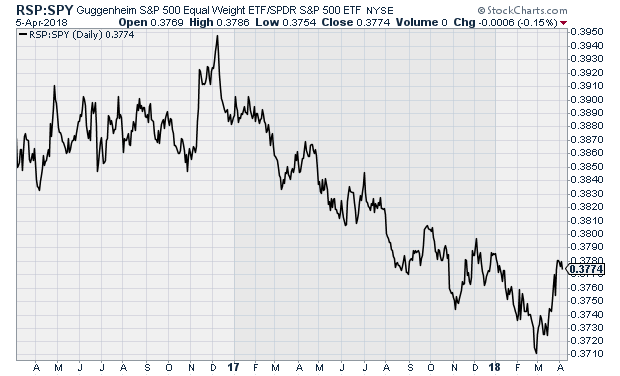
Some markets are broad and some are narrow. We had a very, very narrow one, but that changed abruptly in March. Now the RSP has been crushing the SPY. The big stars of the rally, like the FAANG stocks, have been feeling the pain. Facebook, for example, is more than 18% off its high. Tesla is down more than 21% from its high. The fractured market has been a good one for our Buy List, and I think this will continue. Many of the former high fliers are still overpriced. Also, a good portion of our Buy List stocks have been in unpopular sectors. It was tech that grabbed all the gains.
But the real test for stocks will be the first-quarter earnings season. Twenty of our 25 stocks will report earnings from mid-April to early May. Earnings season is the key time for every rational investor. I don’t have all the dates yet, but it looks like it will start for us around April 19, with Alliance Data Systems (ADS) and Danaher (DHR). Signature Bank (SBNY) usually reports about the same time, but they seem to enjoy waiting till the last minute to inform me.
I’m particularly looking forward to this earnings season. Analysts on Wall Street currently expect the S&P 500 to have earnings of 35.64. That’s the index-adjusted number, and it’s a very good one. (Every point in the index is worth about $8.5 billion.) If that estimate is right, then it would represent a 23.7% increase over last year’s Q1. That’s very strong growth, and the final number will probably be even better. Typically, about 60% to 75% of earnings reports exceed expectations. Indeed, on Wall Street, you’re expected to beat expectations.
Obviously, tax reform is playing a big role in the increased expectations. We’ve seen that in several of our stocks, but that’s not the only factor. The business climate is improving. Typically, Wall Street pares back its earnings estimates as earnings season approaches. Not this time. At the start of the year, analysts were expecting Q1 earnings of $33.97. Over the last four months, Wall Street’s estimate has increased by 5%.
For all of 2018, Wall Street expects the S&P 500 to earn 156.13. That’s up about 7% since the start of the year. The current estimate means the index is currently going for just over 17 times forward earnings. Valuation is a tricky game, but I’d call the current valuation elevated but not dangerous. Our stocks, however, are quite reasonably priced. Carriage Services (CSV), our funeral home operator, is going for less than 14 times earnings. ADS is going for less than 10 times earnings.
In particular, I’m also looking forward to the earnings report from Torchmark (TMK). They probably have the steadiest “earnings line” of any major stock on Wall Street. Their earnings seem to grow by a similar amount each quarter. Since late January, the shares are down about 9%. TMK is probably going for about 14 times this year’s earnings.
With this earnings season, I’m also on the lookout for increased guidance. Not all companies are required to provide guidance to investors. The better ones do, and I prefer to see it. The trick is spotting the ones that try to low-ball investors. Apple loves to do that, as does Ross Stores (ROST). This is still early in the year to see much in the way of higher or lower guidance. Still, companies are always talking with their suppliers and customers so they have a good sense of how the next few months will shake out.
Make sure your portfolio is well-diversified, and focus on high-quality stocks. Don’t try to catch a bottom in any of the falling stars of the bull market. The selling there isn’t over yet. I expect to see more volatility and more testing of the 200-DMA. The best defense in an environment like this is a solid portfolio of Buy List stocks. Now let’s look at the recent earnings beat from RPM International.
RPM International Beats Earnings
On Thursday, RPM International (RPM) reported fiscal Q3 earnings of 30 cents per share. That profit included a one-penny non-recurring gain due to the tax-reform act, plus another eight cents due to lower tax rates, so let’s call it 21 cents per share. Wall Street had been expecting 18 cents per share.
This is one of our quieter stocks, but don’t overlook it. RPM had a solid quarter. Net sales rose 7.8% to $1.1 billion. Quarterly EBIT (earnings before interest and taxes) rose 52%.
“RPM’s operating performance for the third quarter was outstanding, despite severe, continued industry-wide headwinds from higher raw-material costs. We continue to generate exceptional EBIT leverage, reflecting the early success of cost-savings initiatives we began implementing last year and rigorous SG&A spending discipline we have exercised throughout this year,” stated Frank C. Sullivan, RPM chairman and chief executive officer.
The company has three business segments. The largest is the industrial group. For Q3, they had revenue growth of 9.2% to $569 million. The consumer group was up 6.4% to $363 million. The specialty segment had revenue growth of 6.5% to $170 million.
For Q4, RPM expects consolidated revenue growth in the “mid-to-upper” single digits. The company is narrowing its full-year guidance from $3 to $3.10 per share to $3.05 to $3.10 per share. That means RPM is going for less than 16 times earnings.
RPM shares haven’t done much of anything lately, but the stock got a little boost after the earnings report. This is a good company going for a good valuation. I’m dropping my Buy Below on RPM down to $52 per share.
Buy List Updates
You may be familiar with the “Butterfly Effect,” the idea that a very tiny event, like a butterfly flapping its wings, can cause a hurricane at the other end of the world. I often think of that when we consider the second- and third-order effects of financial markets. For example, Hormel Foods (HRL) had a very strong day on Wednesday. At one point, it was almost up 7%. That’s a huge move for a company like HRL.
What happened? China decided to respond to the Trump administration’s tariffs on steel and aluminum by proposing tariffs on pork. That caused hog prices to plummet. This is important because rising commodity prices had been squeezing Hormel’s operating profits in recent quarters. In a matter of days, geopolitics bailed them out. Hormel looks quite good here. The company will report earnings again in later May.
This week, the New York Stock Exchange, which is owned by Intercontinental Exchange (ICE), reached a deal to buy the Chicago Stock Exchange (CHX). A few weeks ago, an investor group led by a Chinese conglomerate tried to buy the CHX. The SEC blocked the deal. The CHX used to be a big regional player, but it’s small potatoes nowadays. They didn’t disclose the numbers of the deal, but the WSJ said it was around $70 million. That’s barely a dent compared with ICE’s market cap of $42 billion. Still, it’s nice to see ICE expand.
Also, this week, JM Smucker (SJM) said they’re buying Ainsworth Pet Nutrition for $1.7 billion. They make the Nutrish dog treats which are endorsed by Rachel Ray.
Premium pet food is a fast-growing sector. Recently, General Mills snapped up Blue Buffalo for $8 billion. In my opinion, that was way too much. But unlike General Mills, Smucker already has a pet-food division (they have the Meow Mix brand). SJM claims this will help them cut overhead costs for Ainsworth. We’ll see.
The good news is that Smucker is getting a pretty good deal for Ainsworth. They’re paying 12 times EBITDA for it. Smucker also said they’re considering ditching their baking business which includes brands like Pillsbury. Interestingly, shares of SJM didn’t get slammed, which often happens to the acquirer when big deals are announced.
That’s all for now. Next week will be fairly quiet for economic news, but towards the end of the week, we’ll start seeing the first batch of Q1 earnings reports. Our Buy List earnings report won’t start until the week after that. There are a few things to keep an eye out for. On Wednesday, we’ll get the minutes from the most recent Fed meeting. Also on Wednesday is the latest CPI report. There have been some muted signs of greater inflation. Be sure to keep checking the blog for daily updates. I’ll have more market analysis for you in the next issue of CWS Market Review!
– Eddy
Syndication Partners
I’ve teamed up with Investors Alley to feature some of their content. I think they have really good stuff. Check it out!
Sell These 2 FAANG Stocks About to Be Destroyed
In what was a very poor April Fool’s joke, the stock market took a tumble on Monday, closing below its 200-day moving average for the first time since June 2016. U.S. stocks had their worst start to an April in many decades as measured by the S&P index. The 2.2% plunge was exceeded by only the 2.5% dive in 1929 when the index only consisted of 90 stocks. This drop followed the worst three month period for global stocks in more than two years.
This selloff was once again led by technology stocks – the Nasdaq 100 index lost 2.9% – as more reasons to sell tech outweighed expected stellar earnings reports (average gains of 22%) later this month. The so-called FAANG stocks extended their recent fall. On Monday, they lost $78.7 billion in market value, bringing the total decline in value to $397 billion just from March 12
The reasons behind the tech selloff were many and included: the continuing worries over regulation of social media, thanks to Facebook; a stupid April Fool tweet from Tesla’s Elon Musk joking about bankruptcy; tweets from President Trump continuing his rants about Amazon; further tweets from the President threatening the future of NAFTA, reigniting the market’s worries about a global trade war; and finally a report that Apple may use chips of its own design in Macs rather than Intel’s chips.
Hopefully, the political worries coming from the White House will eventually fade: if so, then that means the main long-term worry surrounds the social media stocks and in particular, Facebook.
Warren Buffett Loves the Industry of this Beaten Down High-Yield Stock. You Should Too.
Last year at the Berkshire Hathaway annual shareholder meeting, billionaire Warren Buffett stated: “We have got a big appetite for wind or solar.” This high-yield stock is a pure play wind and solar energy producer that was just upgraded by Goldman Sachs. View the recent share price decline as an opportunity to invest in the renewable energy sector at a great buy-in price.
Pattern Energy Group (Nasdaq: PEGI) is an owner/operator of 20 wind power facilities, including one project it has agreed to acquire, with a total owned interest of 2,736 MW in the United States, Canada and Chile. Each power facility is contracted to sell all its energy output, or a majority, on a long-term, fixed-price power sale agreement. Ninety-two percent of the electricity to be generated by the facilities will be sold under these power sale agreements, which have a weighted average remaining contract life of approximately 14 years.
The company has been focused on growing its portfolio since the 2013 IPO. At that time the company owned 1,041 MW of energy production capacity. The added and future acquisitions for Pattern Energy Group are sourced and developed by a related private investment company called Pattern Development. Pattern Development is more like an investment fund that searches out renewable energy production projects to fund. Management has a stated goal of reaching 5,000 MW of owned capacity by 2020. At this time the company already has over 1,000 MW of new projects where PEGI has the right of first offer to purchase the projects when they are ready to come on line. In its long-term development pipeline, management claims visibility on up to 10,000 MW.
Investors have participated in the growth, with the PEGI dividend increasing every quarter until the most recent announcement. From 2014 through the end of 2017 the dividend grew by 35%. On March 1, 2018 the company chose for the first time to not increase the dividend. It was kept level with the previous rate. While the market did not like the lack of dividend increase, it was a prudent move by the Board of Directors to not announce an increase. Cash flow from recent acquisitions had not kicked in to boost free cash flow to pay a higher dividend. In February the company announced the purchase of a 206 MW portfolio of wind and solar projects in Japan. The portfolio has three operating facilities and two under construction. It is an almost certainty that PEGI will soon resume dividend growth.
The PEGI share price peaked above $24 in September 2017. The shares now trade at $17 and change with a 9.75% current yield. This is a dividend growth stock, in the growing renewable energy sector. The current sell-off of the stock is not justified by fundamentals. When the dividend again starts to grow this stock could be bid up again into the mid-$20’s.
-
Morning News: April 6, 2018
Posted by Eddy Elfenbein on April 6th, 2018 at 7:03 amBright Lights, Big Shoulder Pads: A Timid Japan Recalls Its Bubble Era
China Has the Cards to Call Trump’s Bluff
White House Tries to Pull NAFTA Back From Brink as Deadlines Loom
Trump’s Criticism of Amazon: It’s Personal
Facebook Retracted Zuckerberg’s Messages From Recipients’ Inboxes
Corporate America Will Bring Next Wave of Pain, Money Managers Warn
Dimon’s Take on Taxes, Health Care, the Fed
Samsung Profit Climbs to Record on Strong Memory-Chip Demand
Coinbase COO Says Exchange Will Launch Venture-Capital Arm for Digital-Currency Projects
Target to Pay $3.7 Million in Settlement Over Job-Screening Policies
Delta Says Hack on Vendor Exposed Customer Credit-Card Data
Hidden by Model 3 Mess, Tesla’s Other Problem Is About to Emerge
Jeff Miller: Are You A Contrarian Trend Follower?
Roger Nusbaum: Don’t Let Big Tech Ruin You
Be sure to follow me on Twitter.
-
Archives
- July 2026
- June 2026
- May 2026
- April 2026
- March 2026
- February 2026
- January 2026
- December 2025
- November 2025
- October 2025
- September 2025
- August 2025
- July 2025
- June 2025
- May 2025
- April 2025
- March 2025
- February 2025
- January 2025
- December 2024
- November 2024
- October 2024
- September 2024
- August 2024
- July 2024
- June 2024
- May 2024
- April 2024
- March 2024
- February 2024
- January 2024
- December 2023
- November 2023
- October 2023
- September 2023
- August 2023
- July 2023
- June 2023
- May 2023
- April 2023
- March 2023
- February 2023
- January 2023
- December 2022
- November 2022
- October 2022
- September 2022
- August 2022
- July 2022
- June 2022
- May 2022
- April 2022
- March 2022
- February 2022
- January 2022
- December 2021
- November 2021
- October 2021
- September 2021
- August 2021
- July 2021
- June 2021
- May 2021
- April 2021
- March 2021
- February 2021
- January 2021
- December 2020
- November 2020
- October 2020
- September 2020
- August 2020
- July 2020
- June 2020
- May 2020
- April 2020
- March 2020
- February 2020
- January 2020
- December 2019
- November 2019
- October 2019
- September 2019
- August 2019
- July 2019
- June 2019
- May 2019
- April 2019
- March 2019
- February 2019
- January 2019
- December 2018
- November 2018
- October 2018
- September 2018
- August 2018
- July 2018
- June 2018
- May 2018
- April 2018
- March 2018
- February 2018
- January 2018
- December 2017
- November 2017
- October 2017
- September 2017
- August 2017
- July 2017
- June 2017
- May 2017
- April 2017
- March 2017
- February 2017
- January 2017
- December 2016
- November 2016
- October 2016
- September 2016
- August 2016
- July 2016
- June 2016
- May 2016
- April 2016
- March 2016
- February 2016
- January 2016
- December 2015
- November 2015
- October 2015
- September 2015
- August 2015
- July 2015
- June 2015
- May 2015
- April 2015
- March 2015
- February 2015
- January 2015
- December 2014
- November 2014
- October 2014
- September 2014
- August 2014
- July 2014
- June 2014
- May 2014
- April 2014
- March 2014
- February 2014
- January 2014
- December 2013
- November 2013
- October 2013
- September 2013
- August 2013
- July 2013
- June 2013
- May 2013
- April 2013
- March 2013
- February 2013
- January 2013
- December 2012
- November 2012
- October 2012
- September 2012
- August 2012
- July 2012
- June 2012
- May 2012
- April 2012
- March 2012
- February 2012
- January 2012
- December 2011
- November 2011
- October 2011
- September 2011
- August 2011
- July 2011
- June 2011
- May 2011
- April 2011
- March 2011
- February 2011
- January 2011
- December 2010
- November 2010
- October 2010
- September 2010
- August 2010
- July 2010
- June 2010
- May 2010
- April 2010
- March 2010
- February 2010
- January 2010
- December 2009
- November 2009
- October 2009
- September 2009
- August 2009
- July 2009
- June 2009
- May 2009
- April 2009
- March 2009
- February 2009
- January 2009
- December 2008
- November 2008
- October 2008
- September 2008
- August 2008
- July 2008
- June 2008
- May 2008
- April 2008
- March 2008
- February 2008
- January 2008
- December 2007
- November 2007
- October 2007
- September 2007
- August 2007
- July 2007
- June 2007
- May 2007
- April 2007
- March 2007
- February 2007
- January 2007
- December 2006
- November 2006
- October 2006
- September 2006
- August 2006
- July 2006
- June 2006
- May 2006
- April 2006
- March 2006
- February 2006
- January 2006
- December 2005
- November 2005
- October 2005
- September 2005
- August 2005
- July 2005
 Eddy Elfenbein is a Washington, DC-based speaker, portfolio manager and editor of the blog Crossing Wall Street. His