-
The Streak Is Over
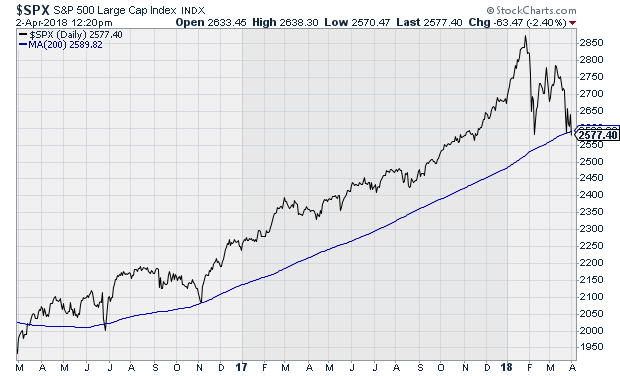
Posted by Eddy Elfenbein on April 2nd, 2018 at 4:09 pmThe S&P 500 closed today at 2,581.88. This is the first time in 21 months that the index has closed below its 200-day moving average.
The S&P 500 also closed barely above the low close from February 8 which was 2,581.00. We came within one point of that.
The index is now more than 10% below the high close from January 26. That’s the official mark of a correction. We had been there before, but now we’re back.
-
The 200-DMA Streak May End Today
Posted by Eddy Elfenbein on April 2nd, 2018 at 12:23 pmThe S&P 500 is currently below its 200-day moving average.
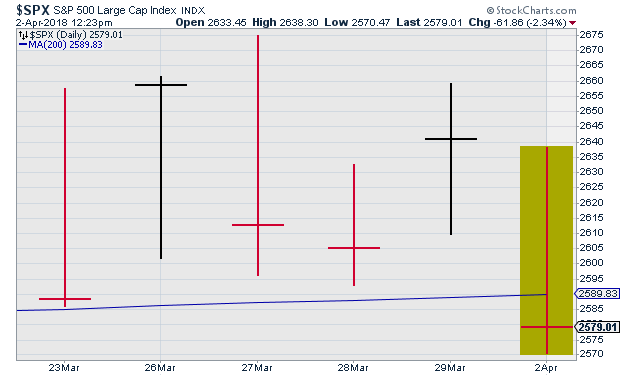
We closed below it on June 27, 2016, but that was for one day. Before that, we have to go back to March 15, 2016. In other words, the S&P 500 has traded above its 200-DMA almost continuously for two years.
-
China Strikes Back
Posted by Eddy Elfenbein on April 2nd, 2018 at 11:25 amThe stock market is down about 1.8% this morning as fears of a trade war continue to escalate. The Chinese Finance Ministry said they’re going to place tariffs on several U.S. products.
The ISM Manufacturing report for March came in at 59.3. That’s pretty good. The prices paid report was 78.1 which is a seven-year high. Also, construction spending rose 0.1% for February. That’s pretty weak.
Shares of Tesla fell as low as $244.59 this morning. That’s a 52-week low. The stock is about 6% below its high from March 2014. A lot of people rode this one on the way up.
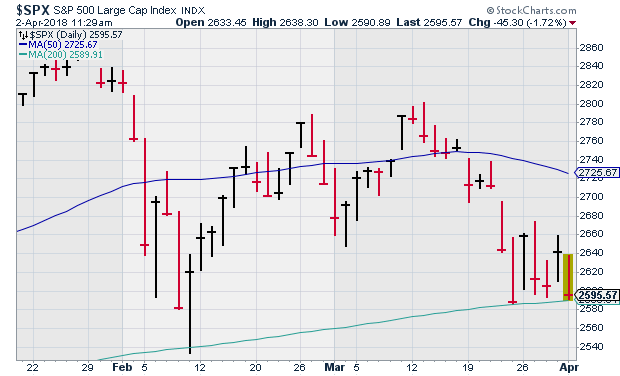
Looking at the broad market, once again, the S&P 500 is testing its 200-day moving average.
-
Morning News: April 2, 2018
Posted by Eddy Elfenbein on April 2nd, 2018 at 7:03 amChina Urges More Trade Talks as Tariffs on U.S. Goods Begin
Japanese Businesses Plan More Investment Even as Sentiment Slips
Bahrain’s Biggest Oil Find Since 1932 Dwarfs Reserves
U.S. Futures Point to Fall Amid Trade Worries
NTSB ‘Unhappy’ With Tesla Over Crash Disclosures
Cloudflare Announces a Faster, More Private Internet Directory
Alibaba Bets Big On Local Delivery in a $9.5 Billion Deal
Silicon Valley Rivals Take Shots at Facebook
Mall Vacancies Reach Six-Year High as Retail Slump Batters Local Economies
Retailers Race Against Amazon to Automate Stores
Joshua Brown: Wait – Did I Call the Top in Bitcoin?
Jeff Miller: Weighing the Week Ahead: Have Stock Prices Veered from the Fundamentals?
Cullen Roche: 2 Thoughtful Concerns on the US National Debt
Be sure to follow me on Twitter.
-
CWS Market Review – March 31, 2018
Posted by Eddy Elfenbein on March 31st, 2018 at 11:50 am“It was never my thinking that made the big money. It was always my sitting.”
– Jesse LivermoreThe first quarter of 2018 is officially on the books. Sadly, this was the worst quarter for the S&P 500 since the third quarter of 2015, and it was the second-worst quarter for the index in the past 22 quarters.
Those stats, however, are a bit misleading. While this was a down quarter for the S&P 500, the index only fell 1.22%; many of those 22 quarters were positive, but only barely. I point this out because this was all part of the “Baby Step” rally that defined the market for the past few years.
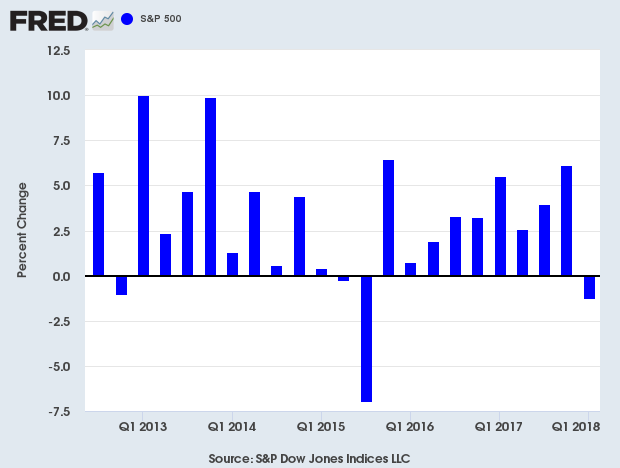
That rally came to an end during Q1. In this issue of CWS Market Review, I’ll explain what it all means. I’ll also highlight the recent earnings report from FactSet. The financial data folks beat earnings and raised guidance, yet the stock fell. Frustrating, but not unusual. I’ll have more on that in a bit. I’ll also preview next week’s earnings report from RPM International. But first, let’s look at the market’s Jekyll and Hyde first quarter.
The Jekyll-and-Hyde Stock Market
I think it’s best to divide Q1 into two segments. The first part started on New Year’s and ended on January 26. This was the last stage of the “Baby Step” rally. The market seemed to go up every day, but only by a little bit. On those occasions when the market fell, it was also by a little bit.
Daily volatility was very low, and the indexes never strayed far from their 52-week highs. The S&P 500 went an amazing 404 days without closing more than 5% below its all-time high. In particular, the market’s gains were driven by a small group of very large tech stocks. This became known on Wall Street as the FAANG stocks (Facebook, Amazon, Apple, Netflix and Google).
The problem was that the big gains from these few stocks made it so most stock-pickers trailed the S&P 500. The only exception was if stock-pickers owned one or more of the FAANGs, but most of them appeared wildly overpriced. Still, they climbed higher and higher. By January 26, the S&P 500 had gained 7.4% for the year.
After that, things began to change. On Monday, January 29, the S&P 500 fell 0.67%. That’s really not much, but it was the worst day for the market in five months. As I said, that fact said a lot more about the preceding five months than it did about what happened on January 29. The next day, the S&P 500 fell by more than 1%. Now traders started to take notice. On Friday, the index fell more than 2%. The next day, it fell another 4%. The rout was on.
On Monday, February 8, the S&P 500 closed at 2,581. That was a 10.2% drop from the all-time-high close just nine days before. After that, the market quickly rebounded, but I warned you that the storm had not yet passed. Here’s a sample of what I wrote:
February 16, “But mark my words–the bears will be back.”
February 23, “I think there’s a good chance we will soon see more dips.”
March 16, “I still think there’s danger out there.”The reason I was suspicious of the market’s rebound is that the index “tested” its 200-day moving average and quickly reversed course. On February 9, the S&P 500 dipped its toe below the 200-DMA, but it closed higher on the day. The index rallied for another five days in a row. A quick bounce like that off the 200-DMA is not a good sign.
Sure enough, the stock market stalled out again after March 9. The S&P 500 then fell eight times in ten days. It wasn’t helped by trade-war talk from the president. Then last Friday, March 23, the S&P 500 again slipped below its 200-DMA but closed just above it. Old Wall Street wisdom tells us that the more a support level is tested, the greater the chance is that it will fail.
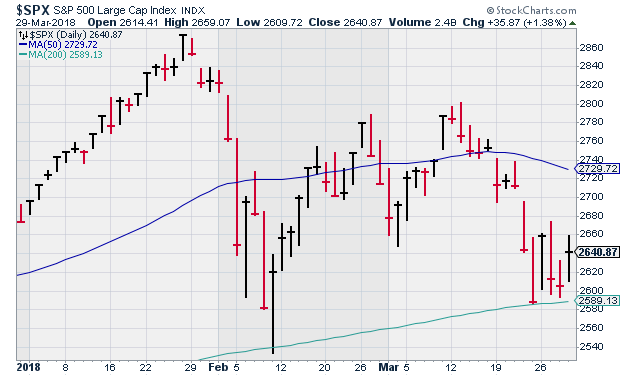
Like a slingshot, the market shot up on Monday. The Dow gained 669 points for its best point day in nearly a decade and its third-best point day ever. Yet again, the market lost steam later in the week. What’s important to understand is that the period since January 26 has been the time of the “broken market.” Sure, stock prices have gotten pushed around, but most of the damage has fallen on the well-known FAANG stocks.
The broken market, however, has been quite good for the Buy List in a relative sense. Since the last stage of the bull market was so heavily focused on FAANG and some other areas, our Buy List has trailed the market. But since the market fractured, we’ve done much better. By that, of course, I mean that we’ve fallen much less than everybody else has.
In fact, as of the close of trading on Thursday, our Buy List holds a slight lead over the S&P 500, -1.03% to -1.22%. (Note that that doesn’t include dividends.) Seven weeks ago, we were trailing the S&P 500 by more than 2.5%. We’ve made all that up, and then some.
The difference this time is that the market faces more serious challenges. Inflation may be creeping higher and the Fed is determined to raise interest rates. The labor market looks pretty good. This week, we learned that initial jobless claims fell to their lowest point in 45 years. A key indicator I like to watch is the spread between the 2- and 10-year Treasuries. On Thursday, the spread stood at 45 basis points. That’s the lowest spread since 2007. Four years ago, the spread was over 220 basis points. It’s not negative yet, but the 2/10 has gone negative before the last four recessions.
I don’t want anyone to panic. If you’re overpriced in tech stocks, then you may have something to worry about, but we’re not. Most of the FAANGs have been feeling the hurt lately. Facebook, for example, plunged 18% in seven days. Shares of Amazon got dinged by a presidential tweet. On the other side of the market, a lot of boring Consumer Staples names have been doing well. Hormel Foods (HRL) was up nearly 6% in March. Church & Dwight (CHD) was a winner as well. After lagging in January, our high-quality strategy is paying off in a difficult market. Now let’s look at this week’s earnings report from FactSet.
FactSet Beat and Raised Guidance
On Tuesday morning, FactSet (FDS) reported fiscal Q2 earnings of $2.12 per share. That’s a healthy 17.1% increase over last year’s Q2. The consensus on Wall Street was for $2.06 per share. In last week’s CWS Market Review, I said I was looking for something between $2.08 and $2.11 per share, so FDS beat even optimistic forecasts.
Digging into the numbers, organic revenues increased 5.7% to $310.4 million. A key metric I watch is their adjusted operating margin. That fell from 33.1% in last year’s Q2 to 31.4% for this year. The company blamed negative foreign exchange. On the plus side, free cash flow rose more than 20% to $86.1 million.
An important metric for FactSet is what the company calls “Annual Subscription Value” or ASV. At the end of Q2, that stood at $1.35 billion. Their “organic” ASV rose by 5.8%. Frankly, that could be higher. Like many companies, FDS was greatly helped by a lower tax rate. The company also approved adding $300 million to its current share-buyback program.
FactSet stopped providing quarterly guidance, but they still give guidance for the full year. The company raised its 2018 guidance range for this by 10 cents at both ends. They now see full-year adjusted EPS between $8.35 and $8.55 per share. That’s pretty good.
After the earnings report, the stock pulled back and finished the quarter at $199.42 per share. I’m encouraged by the earnings report. This week, I’m lifting our Buy Below price on FactSet to $207.
Earnings Preview for RPM International
RPM International (RPM) is due to report fiscal Q3 earnings on Thursday, April 5. In January, RPM reported fiscal Q2 earnings of 70 cents per share which beat the Street by eleven cents. However, that included a tax benefit of nine cents per share. Quarterly sales rose 10.5%. Organic sales rose by 4.3%, and acquisition sales were up 4.7%. Forex added another 1.6% to sales growth.
RPM is one of our quieter stocks, and that is just fine by me. For Q2, RPM’s EBIT rose by 15.4%. The company has three business segments. Last quarter, its industrial unit had sales growth of 11%, the consumer unit was up 11.1% and the specialty segment was up 7.4%.
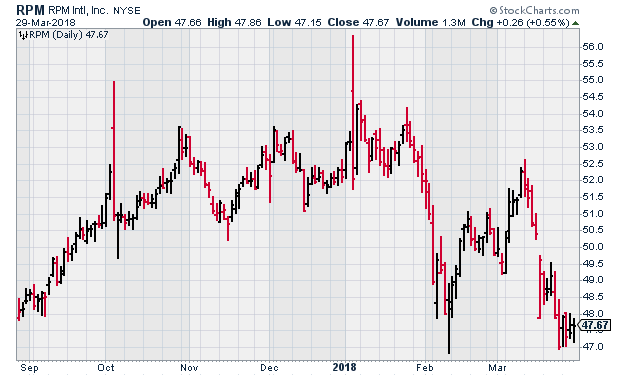
RPM said that the new corporate tax rate will add ten cents per share to its bottom line. For the entire fiscal year, RPM expects earnings of $3 to $3.10 per share. They’ve already made $1.56 per share for the first half of fiscal 2018. For Q3, Wall Street expects 18 cents per share.
Before I go, I want to address the recent drop in Alliance Data Systems (ADS). The stock had been falling, and it fell even more this week. On Thursday, the shares got to their lowest point since the election. Off Wall Street called the stock a short. I think some investors are worried that ADS will soon cut their guidance.
There’s also the fear that Facebook’s limiting the information they share with data brokers would negatively impact ADS. The company defended itself. On Thursday, ADS reiterated guidance and said they don’t have a close relationship with any social media platforms. ADS will report earnings again on April 19.
That’s all for now. Next week, we’ll get some key economic reports. On Monday, the ISM Manufacturing report comes out. The recent numbers here have been quite good. On Wednesday, the ADP payroll report is released. Then Friday is Jobs Day. We’ll get the employment report for March. The last NFP report showed an increase of 313,000 jobs. Be sure to keep checking the blog for daily updates. I’ll have more market analysis for you in the next issue of CWS Market Review!
– Eddy
-
Morning News: March 30, 2018
Posted by Eddy Elfenbein on March 30th, 2018 at 7:04 amStocks Are About to Get a $400 Billion Dividend Boost
NYSE in Talks to Buy Chicago Stock Exchange
Bitcoin is Falling Back to Earth. It’s Now Below $7,000
Coffee Must Carry Cancer Warning, California Judge Rules
Trump May Have a Beef With Amazon But Consumers Can’t Get Enough of It
Walmart in Early-Stage Acquisition Talks With Humana
Facebook’s Zuckerberg Disavows Memo Saying All User Growth is Good
IQiyi, the ‘Chinese Netflix,’ Pockets More Than $2 Billion in IPO, Stock Falls in Debut
Telegram Raises $1.7 Billion in Coin Offering, May Seek More
SpaceX Gains Official Approval to Launch High-Speed Satellite Internet Service
Under Armour Says 150 Million MyFitnessPal Accounts Breached
Toast This Easter With Peeps-Flavored Beer
Roger Nusbaum: Learning From Iomega
Michael Batnick: Belief and Doubt
Be sure to follow me on Twitter.
-
45-Year Low for Initial Claims
Posted by Eddy Elfenbein on March 29th, 2018 at 1:24 pmToday’s initial jobless claims report came in at 215,000. That’s the lowest since January 27, 1973.
We also learned this morning that personal income rose 0.4% in February while personal spending rose 0.2%.
-
Morning News: March 29, 2018
Posted by Eddy Elfenbein on March 29th, 2018 at 7:08 amTrade Deals Take Years. Trump Wants to Remake Them in Months.
The IRS Is Auditing a Lot Fewer Americans
It’s the No. 1 Power Source, But Natural Gas Faces Headwinds
Nissan, Renault in Talks to Merge, Create New Company
Facebook Could Be Fined Millions for Violating Consent Deal
Airbnb to Share Information With Authorities on Guests in China
Warren Buffett Is Now America’s No. 2 Real Estate Broker
The Clock Is Ticking Faster at Tesla
Boeing Possibly Hit By `WannaCry’ Malware Attack
Uber Isolated by Partners and Competitors in Aftermath of Crash
Takeda Shares Fall as Investors Queasy Over Possible Bid for Shire
Anbang Was Seized by China. Now, It Has a Deal For You.
Jeff Miller: How to Exploit an Inefficient Market
Ben Carlson: That Time a U.S. Senator Tried to Actually Me
Be sure to follow me on Twitter.
-
The Market Rotates Away from Tech
Posted by Eddy Elfenbein on March 28th, 2018 at 10:42 amYesterday was an unusual day for the market. At noon, the S&P 500 was up about 0.5%. After that, the wheels fell off and the index closed down 1.7%.
What’s interesting is that once again, it was tech stocks that took the blame. The tech sector has lagged the S&P 500 seven times in the last eight days, and it’s doing so again today. Now it’s Amazon’s turn to bring down the indexes. (Technically, Amazon is classified as a consumer discretionary.)
This recent market action has been very good for our Buy List. Well, very good for the relative strength of our Buy List. By that I mean that we haven’t suffered nearly as much on down days.
Some of this is the unwinding of the FAANG Trade where a small group of very large stocks gobbled up most of the gains. Facebook, for example, has been creamed recently.
In the last seven weeks, the S&P 500 has lost -3.06% while the Buy List is down just -0.22%.
-
Q4 GDP Revised to 2.9%
Posted by Eddy Elfenbein on March 28th, 2018 at 10:01 amThis morning, the government revised Q4 GDP growth from 2.5% to 2.9%. This means that the last three quarters of 2017 saw decent growth. This was the first time in 13 years that the economy strung together three decent quarters in a row.
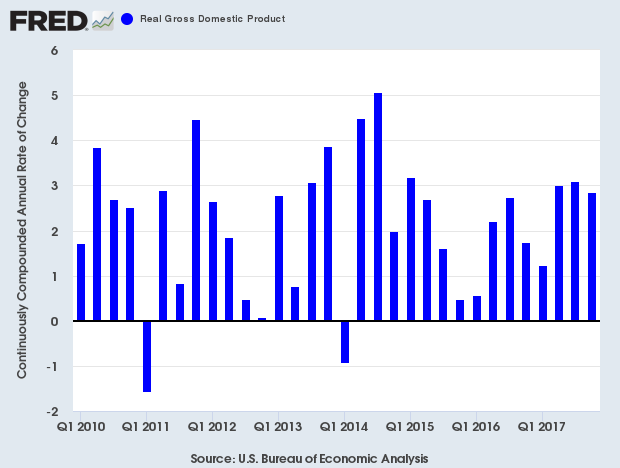
Bear in mind that Q4 began six months ago and ended three months ago, so this is old news. In one more month, we’ll get a look at Q1 GDP. The Atlanta Fed sees Q1 coming in at 1.8% while the New York Fed is at 2.9%.
-
Archives
- September 2026
- August 2026
- July 2026
- June 2026
- May 2026
- April 2026
- March 2026
- February 2026
- January 2026
- December 2025
- November 2025
- October 2025
- September 2025
- August 2025
- July 2025
- June 2025
- May 2025
- April 2025
- March 2025
- February 2025
- January 2025
- December 2024
- November 2024
- October 2024
- September 2024
- August 2024
- July 2024
- June 2024
- May 2024
- April 2024
- March 2024
- February 2024
- January 2024
- December 2023
- November 2023
- October 2023
- September 2023
- August 2023
- July 2023
- June 2023
- May 2023
- April 2023
- March 2023
- February 2023
- January 2023
- December 2022
- November 2022
- October 2022
- September 2022
- August 2022
- July 2022
- June 2022
- May 2022
- April 2022
- March 2022
- February 2022
- January 2022
- December 2021
- November 2021
- October 2021
- September 2021
- August 2021
- July 2021
- June 2021
- May 2021
- April 2021
- March 2021
- February 2021
- January 2021
- December 2020
- November 2020
- October 2020
- September 2020
- August 2020
- July 2020
- June 2020
- May 2020
- April 2020
- March 2020
- February 2020
- January 2020
- December 2019
- November 2019
- October 2019
- September 2019
- August 2019
- July 2019
- June 2019
- May 2019
- April 2019
- March 2019
- February 2019
- January 2019
- December 2018
- November 2018
- October 2018
- September 2018
- August 2018
- July 2018
- June 2018
- May 2018
- April 2018
- March 2018
- February 2018
- January 2018
- December 2017
- November 2017
- October 2017
- September 2017
- August 2017
- July 2017
- June 2017
- May 2017
- April 2017
- March 2017
- February 2017
- January 2017
- December 2016
- November 2016
- October 2016
- September 2016
- August 2016
- July 2016
- June 2016
- May 2016
- April 2016
- March 2016
- February 2016
- January 2016
- December 2015
- November 2015
- October 2015
- September 2015
- August 2015
- July 2015
- June 2015
- May 2015
- April 2015
- March 2015
- February 2015
- January 2015
- December 2014
- November 2014
- October 2014
- September 2014
- August 2014
- July 2014
- June 2014
- May 2014
- April 2014
- March 2014
- February 2014
- January 2014
- December 2013
- November 2013
- October 2013
- September 2013
- August 2013
- July 2013
- June 2013
- May 2013
- April 2013
- March 2013
- February 2013
- January 2013
- December 2012
- November 2012
- October 2012
- September 2012
- August 2012
- July 2012
- June 2012
- May 2012
- April 2012
- March 2012
- February 2012
- January 2012
- December 2011
- November 2011
- October 2011
- September 2011
- August 2011
- July 2011
- June 2011
- May 2011
- April 2011
- March 2011
- February 2011
- January 2011
- December 2010
- November 2010
- October 2010
- September 2010
- August 2010
- July 2010
- June 2010
- May 2010
- April 2010
- March 2010
- February 2010
- January 2010
- December 2009
- November 2009
- October 2009
- September 2009
- August 2009
- July 2009
- June 2009
- May 2009
- April 2009
- March 2009
- February 2009
- January 2009
- December 2008
- November 2008
- October 2008
- September 2008
- August 2008
- July 2008
- June 2008
- May 2008
- April 2008
- March 2008
- February 2008
- January 2008
- December 2007
- November 2007
- October 2007
- September 2007
- August 2007
- July 2007
- June 2007
- May 2007
- April 2007
- March 2007
- February 2007
- January 2007
- December 2006
- November 2006
- October 2006
- September 2006
- August 2006
- July 2006
- June 2006
- May 2006
- April 2006
- March 2006
- February 2006
- January 2006
- December 2005
- November 2005
- October 2005
- September 2005
- August 2005
- July 2005
 Eddy Elfenbein is a Washington, DC-based speaker, portfolio manager and editor of the blog Crossing Wall Street. His