-
Stryker Earns $1.96 per Share
Posted by Eddy Elfenbein on January 30th, 2018 at 4:38 pmAfter the bell, Stryker (SYK) reported Q4 earnings of $1.96 per share. That was one penny more than expectations. For the year, Stryker earned $6.49 per share.
Consolidated net sales of $3.5 billion and $12.4 billion increased 10.0% and 9.9% as reported in the quarter and full year and 8.7% and 9.8% in constant currency, as foreign currency exchange rates positively impacted net sales by 1.2% and 0.1%. Excluding the 0.7% and 2.7% impact of acquisitions, net sales increased 8.1% and 7.1% in constant currency, including 9.1% and 8.2% from increased unit volumes partially offset by 1.0% and 1.1% in lower prices.
Orthopaedics net sales of $1.3 billion and $4.7 billion increased 8.1% and 6.6% as reported in the quarter and full year and 6.8% and 6.5% in constant currency, as foreign currency exchange rates positively impacted net sales by 1.3% and 0.1%. There was no impact of acquisitions in the quarter and 0.3% impact of acquisitions in the full year. Net sales increased 6.8% and 6.2% excluding acquisitions and in constant currency, including 9.3% and 8.6% from increased unit volumes partially offset by 2.5% and 2.4% in lower prices.
MedSurg net sales of $1.6 billion and $5.6 billion increased 10.9% and 13.6% as reported in the quarter and full year and 9.8% and 13.4% in constant currency, as foreign currency exchange rates positively impacted net sales by 1.1% and 0.2%. Excluding the 1.3% and 5.6% impact of acquisitions, net sales increased 8.5% and 7.8% in constant currency, including 8.0% and 7.5% from increased unit volumes and 0.5% and 0.2% from higher prices.
Neurotechnology and Spine net sales of $0.6 billion and $2.2 billion increased 11.5% and 8.2% as reported in the quarter and full year and 10.3% and 8.3% in constant currency, as foreign currency exchange rates positively impacted net sales by 1.2% in the quarter and nominally for the full year. Excluding the 0.4% and 0.7% impact of acquisitions, net sales increased 10.0% and 7.6% in constant currency, including 11.7% and 9.1% from increased unit volumes partially offset by 1.7% and 1.5% in lower prices.
Here’s their outlook for 2018:
We expect 2018 organic sales growth to be in the range of 6.0% to 6.5%. For 2018, we will adopt ASU 2014-09 Revenue from Contracts with Customers, which impacts the timing of revenue recognition and requires the presentation of certain costs previously reported as selling expenses as a reduction of revenue, both of which are not anticipated to be material. The reclassification of selling costs will result in a reduction of net sales, but has no impact on operating income or net earnings. We expect adjusted net earnings per diluted share(3) to be in the range of $1.57 to $1.62 in the first quarter and $7.07 to $7.17 in the full year. If foreign currency exchange rates hold near current levels, we expect net sales to be favorably impacted by approximately 1.0% for the full year. When considered along with our hedging program, we expect modest favorability in net earnings per diluted share in the first quarter and full year.
-
Janet Yellen’s Fed Chair Tenure in Charts
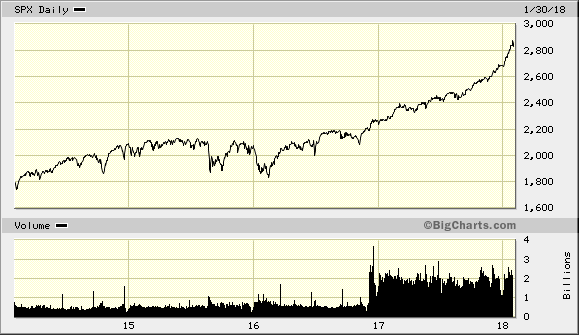
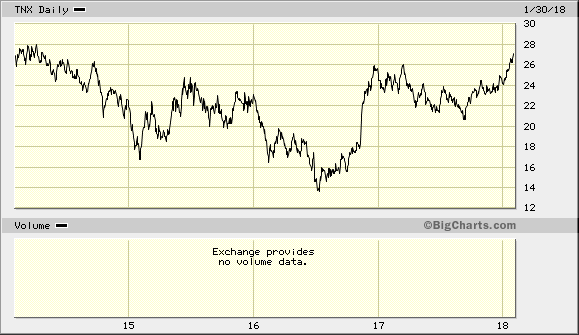
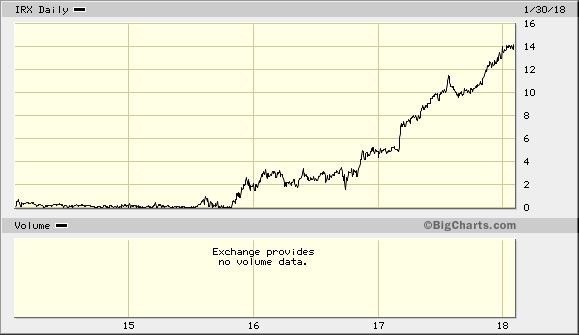
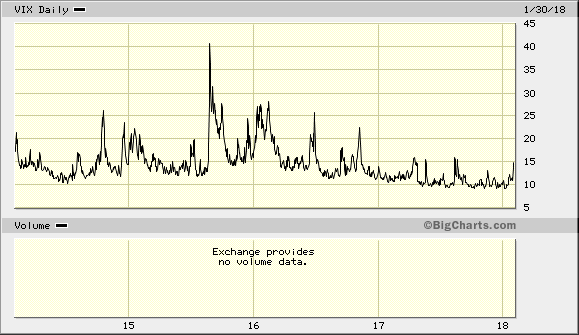
Posted by Eddy Elfenbein on January 30th, 2018 at 12:33 pmThe Federal Reserve begins its meeting today and this will be the final one with Janet Yellen as Fed chair. Let’s look at some charts detailing the last four years.
First up, the S&P 500. Not bad.
Here’s the 10-year Treasury yield:
90-day yield. This one gets interesting:
The VIX:
Gold:
Dollar/Euro
Unemployment:
Nonfarm payrolls:
Headline CPI:
Core CPI:
Oil:
Fed’s balance sheet:
2-10 Spread:
Dollar Index:
Real GDP:
Real Fed funds based on core CPI:
-
The Super Bowl Indicator Has Failed Recently
Posted by Eddy Elfenbein on January 30th, 2018 at 10:10 amFrom Gary Alexander at Navellier Market Mail:
Whether you favor the AFC’s New England Patriots or the NFC’s Philadelphia Eagles in Super Bowl LII, most investors are aware of the Super Bowl Indicator, which basically says that the market will go down in a year in which the AFC team wins, and it will go up if an “old-line NFL” team wins the Super Bowl.
Like any artificial retro-fit coincidental indicator, the Super Bowl Indicator worked pretty well for a very long time. From 1968 to 1982, the market mostly declined at a time when the AFC won most Super Bowls. Then, from 1983 to 1997, when the market mostly rose, the NFC won most of the Super Bowls.
The Super Bowl Indicator worked for 30 of the first 31 Super Bowls, missing the mark only in 1990. So: If a coin flip comes up heads 30 of 31 times, what are the chances it will come up heads the next time? The correct answer is 50%, but some will bet the trend (heads) while others will say, “Tails is overdue.” A whole industry (gaming) is built on the war between casinos filled with trend-followers vs. contrarians.
The Denver Broncos ended the Super Bowl Indicator’s 31-year 97% winning streak. In both 1998 and 1999, Denver won the Super Bowl, but the bull market of the late 1990s just kept charging higher. Then, in 2000, the St. Louis Rams (NFC) won, and the market fell. Then, in 2001, the Baltimore Ravens (an old-line NFL team) won, but the market kept on falling. In 2008, the NFC New York Giants won the Super Bowl, but 2008 turned into the worst market year since the 1930s. The Indicator had flipped!
One of the big problems with the Super Bowl Indicator is the slippery definition of “old-line NFL.” Some recent Super Bowl winners are currently aligned with the AFC, but they are also old-line NFL teams: The Indianapolis Colts (2007 winners) were once the Baltimore Colts, while the Baltimore Ravens (the 2013 champs) were once the Cleveland Browns. The AFC Pittsburgh Steelers (2006 and 2012 winners) are also from the old-line NFL. The market went up in all four of these years, but are these teams AFC or NFL?
I’m sure that much of this Super Bowl lore is pure entertainment. I’m not sure if anyone ever believed it, but some newspapers are desperate to fill their news pages in winter, so the Super Bowl Indicator was first offered (perhaps in jest) in 1978 by a New York Times sports reporter named Leonard Koppett, who mocked some other silly sports statistics in his Sporting News article, “Carrying Statistics to Extremes.”
For the next two decades, several more tongue-in-cheek articles came out, saying that NFC teams (like Washington or San Francisco) “saved investors” by pulling out last minute wins in the Super Bowl. In 1989, the staid Financial Analysts Journal stooped to ask: “Did Joe Montana Save the Stock Market?”
The secret of the original Super Bowl correlation is that the stock market goes up more than it goes down and NFL teams won more often than AFC teams. Since Super Bowl #1 in 1967, the Dow has risen in 37 of 51 years. In the first 51 Super Bowls, old-line NFL teams won 34 times, so there was a lot of overlap.
The reason that these two historical theories worked for a time, then didn’t work, is that retro-fit theories are manufactured to fit historical data, while the future is random. You can apply this lesson to the length of bull markets, the length of recoveries, the trading range of stocks, and many other market variables. Just because something happened in the past, there is no logical reason the same thing will repeat in the future.
-
Three Charts for this Morning
Posted by Eddy Elfenbein on January 30th, 2018 at 10:07 amHere are some charts I wanted to pass along.
The S&P 500 fell 0.67% yesterday. That was its biggest drop since September 5, which was the Tuesday following Labor Day.
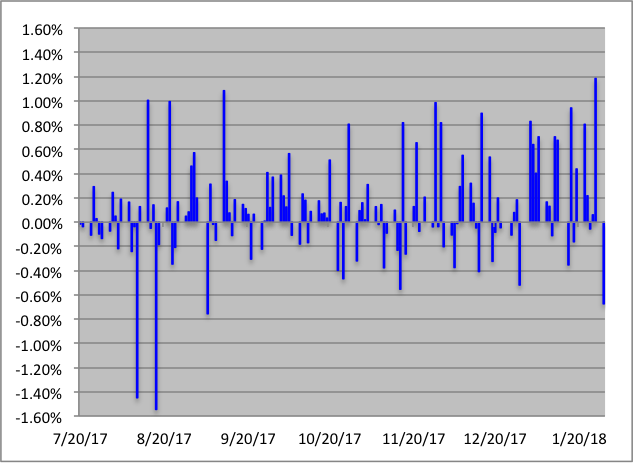
It looks like we may pass that today.
This shows the S&P 500’s dividend yield in black, being surpassed by both the 10-year (blue) and 2-year Treasury yields (red).

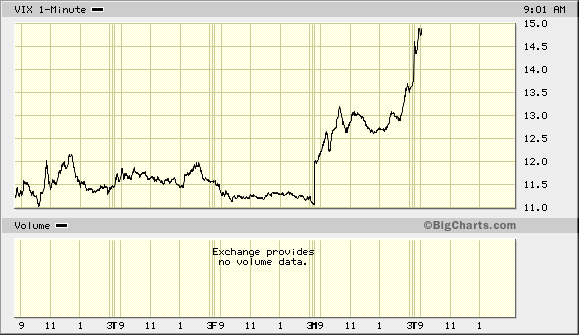
Yesterday, the VIX rose by 25%. It’s up again today.
-
Danaher Earns $1.19 per Share for Q4
Posted by Eddy Elfenbein on January 30th, 2018 at 9:57 amDananher (DHR) had a very good quarter for Q4. The company earned $1.19 per share. They had given us a guidance range of $1.12 to $1.16. Later, the CEO said earnings would be in the upper end of that range. What Danaher called “non-GAAP core revenue” rose by 5.5%.
For the whole year, Danaher made $4.03 per share. That’s up 11.5% over 2016. Non-GAAP core revenues grew by 3.5%. Danaher had operating cash flow of $3.5 billion.
The Company generated strong operating cash flow of $3.5 billion for the full year 2017.
Thomas P. Joyce, Jr., President and Chief Executive Officer, stated, “We are very pleased with our strong fourth quarter results. The team delivered 5.5% core revenue growth, solid margin expansion, and double-digit adjusted earnings per share growth. As we reflect back, 2017 was a year of accelerating revenue growth, solid margin improvement, continued growth investment, and great performance at our more recently acquired larger businesses. In addition, mid-teens growth in free cash flow helps position us for more significant capital deployment in 2018.”
Joyce continued, “As we look ahead, we believe that the strength of our portfolio, combined with the power of the Danaher Business System, provide us with the foundation for long-term shareholder value creation.”
For Q1, Danaher sees earnings range between 90 and 93 cents per share. For all of 2018, they’re projecting $4.25 to $4.35 per share. Wall Street had been expecting 93 cents and $4.35 per share.
-
Morning News: January 30, 2018
Posted by Eddy Elfenbein on January 30th, 2018 at 6:59 amChina Could Target U.S. Firms If Trump Levies Tarriff
Federal 5G Network Proposal Is Panned by F.C.C. and Industry
U.S. Regulator, DOJ Settle ‘Spoofing’ Charges Against European Banks
Market Euphoria May Turn to Despair If 10-Year Yield Jumps to 3%
Why It’s a Bad Idea to Measure Cryptocurrencies By Their Market Caps
Dell’s Problem: Bigger Not Always Better
Waymo Buys ‘Thousands’ More Chrysler Vans for Driverless Service
Elon Musk Is Selling Flamethrowers
Blackstone in Talks to Buy Thomson Reuters’ Financial Unit
JPMorgan Names Daniel Pinto, Gordon Smith as Co-Presidents, COO
Buy Now, Pay Later Helps JAB Billionaires Build Beverage Empire
Tyson Foods Has Invested in a Startup That Aims to Eradicate Meat from Live Animals
Ben Carlson: All-Time Highs, Risk & Consequences
Michael Batnick: Markets Can Never Be Perfectly Efficient
Joshua Brown: The Robots are Getting Owned
Be sure to follow me on Twitter.
-
The 10-Year Breaks Above 2.7%
Posted by Eddy Elfenbein on January 29th, 2018 at 10:41 amFor the first time since 2014, the 10-year is trading north of 2.7%.
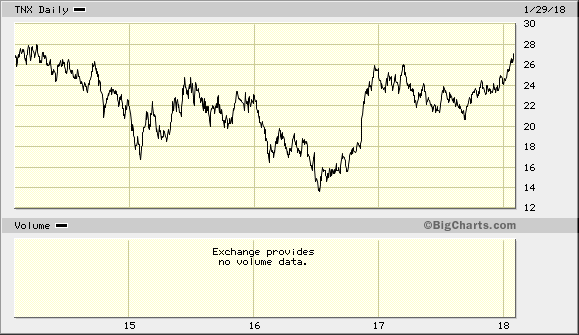
This means the economy is improving while investors are leaving safe assets for riskier ones. Over the last 18 months, the yield on the 10-year has nearly doubled.
-
Savings Rate Falls to 12-Year Low
Posted by Eddy Elfenbein on January 29th, 2018 at 10:10 amThis morning, we learned that personal income rose 0.4% in December. That was 0.1% better than consensus. For the year, personal income increased by 3.1%. That’s up from growth of 2.4% in 2016.
Personal spending rose by 0.4% last month which matched expectations. The number for November was revised upward to 0.8%. The savings rate fell to 2.4% which is a 12-year low.
-
Morning News: January 29, 2018
Posted by Eddy Elfenbein on January 29th, 2018 at 7:09 amHow to Launder $500 Million in Digital Currency
Tech Giants Brace for Europe’s New Data Privacy Rules
London’s Bankers Haven’t Been This Gloomy Since 2008
India Does Not Rule Out Fiscal Consolidation Pause This Year
U.S. Considers Building 5G Network Amid China Concerns
Oil Boom Gives the U.S. a New Edge in Energy and Diplomacy
Tanker Carrying LNG from Russian Arctic Arrives in Boston
Born From Frozen Camel Blood, Ablynx Is $4.8 Billion Prize
Shares in Prince Alwaleed’s Firm Soar, But Banks Remain Cautious
‘Jackpotting’ Targets U.S. ATMs to Make Them Spit Out Cash
VW Customers Don’t Give a Monkey’s About Diesel Cheating
Jeff Carter: Risks For Audit Are Too High
Roger Nusbaum: What The Hell Is Going On With Asset Prices? & Can 80/20 Replace 60/40?
Cullen Roche: 3 Things I Think I Think – Wrong!
Be sure to follow me on Twitter.
-
Give It Time…
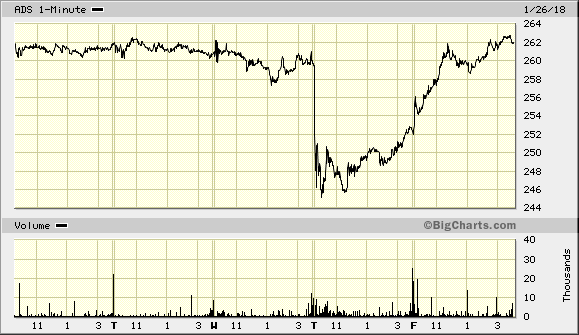
Posted by Eddy Elfenbein on January 26th, 2018 at 6:29 pmThe S&P 500 had a big day today and the index closed at another all-time high. I was impressed that AFLAC and Alliance Data Systems both rebounded off their drops.
AFLAC was at $91.69 before the article came out. It got as low as $83.70. Today, AFL closed at $90.99.
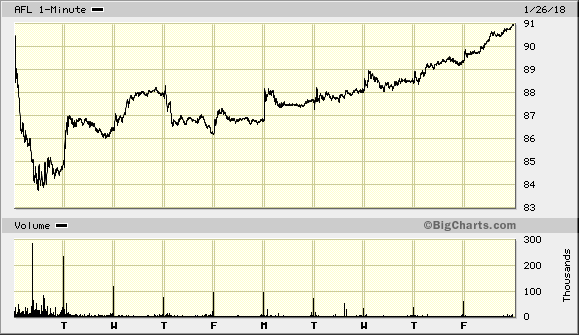
At one point yesterday, shares of ADS were down 5.6% on what I thought were good earnings. So much for my opinion. ADS rallied later yesterday and continued to rally today. Now the stock is up 0.87% from Wednesday’s close.
Here’s a nice report on Danaher.
We had new Buy List highs today from INGR, SYK, FISV, FDS, TMK, DHR, ROST, BDX and MCO.
-
Archives
- July 2026
- June 2026
- May 2026
- April 2026
- March 2026
- February 2026
- January 2026
- December 2025
- November 2025
- October 2025
- September 2025
- August 2025
- July 2025
- June 2025
- May 2025
- April 2025
- March 2025
- February 2025
- January 2025
- December 2024
- November 2024
- October 2024
- September 2024
- August 2024
- July 2024
- June 2024
- May 2024
- April 2024
- March 2024
- February 2024
- January 2024
- December 2023
- November 2023
- October 2023
- September 2023
- August 2023
- July 2023
- June 2023
- May 2023
- April 2023
- March 2023
- February 2023
- January 2023
- December 2022
- November 2022
- October 2022
- September 2022
- August 2022
- July 2022
- June 2022
- May 2022
- April 2022
- March 2022
- February 2022
- January 2022
- December 2021
- November 2021
- October 2021
- September 2021
- August 2021
- July 2021
- June 2021
- May 2021
- April 2021
- March 2021
- February 2021
- January 2021
- December 2020
- November 2020
- October 2020
- September 2020
- August 2020
- July 2020
- June 2020
- May 2020
- April 2020
- March 2020
- February 2020
- January 2020
- December 2019
- November 2019
- October 2019
- September 2019
- August 2019
- July 2019
- June 2019
- May 2019
- April 2019
- March 2019
- February 2019
- January 2019
- December 2018
- November 2018
- October 2018
- September 2018
- August 2018
- July 2018
- June 2018
- May 2018
- April 2018
- March 2018
- February 2018
- January 2018
- December 2017
- November 2017
- October 2017
- September 2017
- August 2017
- July 2017
- June 2017
- May 2017
- April 2017
- March 2017
- February 2017
- January 2017
- December 2016
- November 2016
- October 2016
- September 2016
- August 2016
- July 2016
- June 2016
- May 2016
- April 2016
- March 2016
- February 2016
- January 2016
- December 2015
- November 2015
- October 2015
- September 2015
- August 2015
- July 2015
- June 2015
- May 2015
- April 2015
- March 2015
- February 2015
- January 2015
- December 2014
- November 2014
- October 2014
- September 2014
- August 2014
- July 2014
- June 2014
- May 2014
- April 2014
- March 2014
- February 2014
- January 2014
- December 2013
- November 2013
- October 2013
- September 2013
- August 2013
- July 2013
- June 2013
- May 2013
- April 2013
- March 2013
- February 2013
- January 2013
- December 2012
- November 2012
- October 2012
- September 2012
- August 2012
- July 2012
- June 2012
- May 2012
- April 2012
- March 2012
- February 2012
- January 2012
- December 2011
- November 2011
- October 2011
- September 2011
- August 2011
- July 2011
- June 2011
- May 2011
- April 2011
- March 2011
- February 2011
- January 2011
- December 2010
- November 2010
- October 2010
- September 2010
- August 2010
- July 2010
- June 2010
- May 2010
- April 2010
- March 2010
- February 2010
- January 2010
- December 2009
- November 2009
- October 2009
- September 2009
- August 2009
- July 2009
- June 2009
- May 2009
- April 2009
- March 2009
- February 2009
- January 2009
- December 2008
- November 2008
- October 2008
- September 2008
- August 2008
- July 2008
- June 2008
- May 2008
- April 2008
- March 2008
- February 2008
- January 2008
- December 2007
- November 2007
- October 2007
- September 2007
- August 2007
- July 2007
- June 2007
- May 2007
- April 2007
- March 2007
- February 2007
- January 2007
- December 2006
- November 2006
- October 2006
- September 2006
- August 2006
- July 2006
- June 2006
- May 2006
- April 2006
- March 2006
- February 2006
- January 2006
- December 2005
- November 2005
- October 2005
- September 2005
- August 2005
- July 2005
 Eddy Elfenbein is a Washington, DC-based speaker, portfolio manager and editor of the blog Crossing Wall Street. His