-
Hershey Looks Good Here
Posted by Eddy Elfenbein on February 13th, 2018 at 11:46 amOne of the signs that we’re late in a stock cycle is that defensive stocks start to underperform the market. This makes perfect sense.
You can really see the effect by looking at a long-term chart of Hershey (HSY), a classic defensive stock. This is Hershey’s share price divided by the S&P 500 Total Return Index.
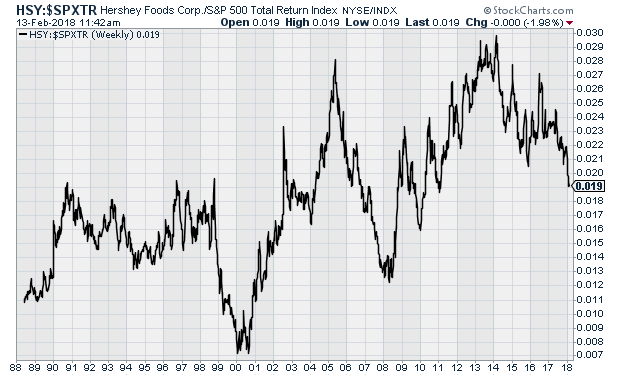
You can see that HSY has been a very good long-term winner. You can also see how the shares badly lagged in 1999-2000 and again in 2007-08. They’re doing so again. HSY has underperformed for four years, and it recently touched a seven-year low for relative strength.
Of course, that’s not the only analysis required, but it’s a good starting point. HSY is going for 17.2 times next year’s earnings and the stock’s yield is up to 2.6%.
-
NYT vs AOBC
Posted by Eddy Elfenbein on February 13th, 2018 at 11:00 amHere’s an interesting stock chart. This shows the price of the New York Times (in blue) along with American Outdoor Brands (in red). That’s the new name for Smith & Wesson.
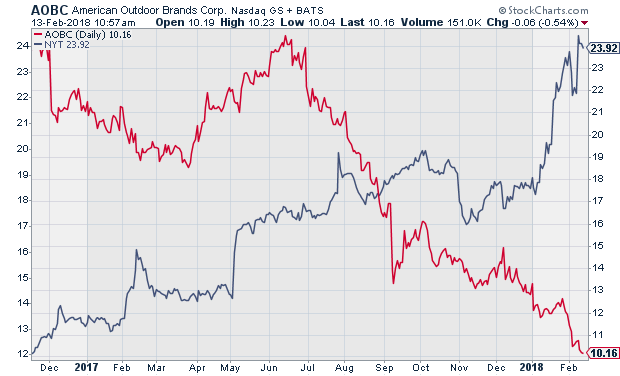
What gun stocks are for Democratic presidents, large media stocks are for Republican presidents.
-
Morning News: February 13, 2018
Posted by Eddy Elfenbein on February 13th, 2018 at 7:07 amFacebook Broke German Privacy Laws, Court Rules
U.S. CPI Report Takes on Bigger Importance After Markets Plunge
Trump’s Infrastructure Plan Puts Burden on State and Private Money
Treasury Yields Will Climb to 3.5% on Fed, Goldman Sachs Asset Management Says
5G Is Making Its Global Debut at Olympics, and It’s Wicked Fast
PepsiCo Leans More Heavily on Snacks as Beverages Fizzle
What Is AmerisourceBergen and Why Does Walgreens Want to Buy It?
Carl Icahn and Darwin Deason are trying to stop the Xerox Fujifilm deal
YouTube Revamped Its Ad System. AT&T Still Hasn’t Returned.
Remington Is Planning to File for Bankruptcy
Barnes & Noble Is Laying Off Workers Amid Declining Sales
Harley CEO Asks Investors for Patience as Sales, Stock Slide
Roger Nusbaum: Volatility Is Back In Town And It’s Angry
Joshua Brown: Larry Bonds & Passive My A**
Jeff Carter: Betting On Same Horse, Different Race
Be sure to follow me on Twitter.
-
Some Market Stats
Posted by Eddy Elfenbein on February 12th, 2018 at 1:59 pmThe market is having nice rebound today. The Dow is currently up 500 points. Measuring from Friday’s low, it’s up 1,350 points.
Here are several great stats from this Bloomberg article. Normally, I would use blockquotes, but there are so many good nuggets here:
Even after the rout, the math shows the S&P 500 remains less attractive than it has been 82 percent of the time since the index bottomed in 2009 when compared with yields on U.S. Treasuries.
Currently, the S&P 500’s earnings yield is around 6 percent, 3.1 percentage points more than the 10-year note. The post-crisis average has been 4 points.
So far, the S&P 500 has tumbled in seven of the 10 past days, and plunged into a correction (loosely defined as a 10 percent drop) faster than any time since 1950. In doing so, the index has blown through three round-number milestones, as well as technical support levels indicated by its 50-, 100- and (briefly) 200-day moving averages.
At 16.8 times forecast earnings, the S&P 500’s valuation multiple is now down from a high of 20 in late December. That’s one of the fastest declines since 2009, but it has yet to bring P/Es in line with the average ratio of 15.5 that marked the bottom of the last two corrections. To get there, the S&P 500 would have to fall to 2,417. That’s roughly 8 percent below Friday’s closing level.
Stocks still look cheap to Treasuries when viewed from a wider lens. The current yield spread is more than double the average since 1990 and compares with 2.66 percentage points since 2000. But a rise in 10-year yields to just 3.65 percent (from about 2.85 percent now) would reduce the equity advantage to the 20-year average.
The S&P 500 would have to fall to 2,417 for the P/E Ratio to reach 15.5, which marked the low of the last two corrections.
And this from MarketWatch:
“There have been 16 drawdowns of 10%+ since 1976. Of the 16 corrections, only five occurred around a recession,” Goldman wrote. “Of the remaining 11 non-recession episodes, 1987 was the only one that turned into a bear market.”
During the three months following past corrections, materials have beaten the S&P 500 by a median of 270 basis points. Industrials beat the index in 73% of the periods at a 270-basis point median. Telecom is the worst pick post-correction, lagging the S&P 500 in 64% of periods by a median of 410 basis points, Goldman found.
Low valuation and small-cap stocks historically perform best following a 10% decline, Goldman noted, with its valuation factor handing over a return 63% of the time at 350 basis points on average. Additionally, high volatility beats low volatility in a post-correction environment: low volatility lagged high volatility by 610 basis points on average in 87% of post-correction periods.
-
Morning News: February 12, 2018
Posted by Eddy Elfenbein on February 12th, 2018 at 7:11 amThe Fed is Officially in a Nailbiting Showdown With Wall Street
Mulvaney Says CFPB Under His Direction Is ‘Not Being Aggressive’
Record $23 Billion Flees World’s Largest ETF
Bitcoin Closes in on $9,000 as Regulatory Fears Peter Out
General Dynamics Buying CSRA for $6.8 Billion
Ford Revs Up Large SUV Production to Boost Margins, Challenge GM
Barclays Bank Unit Charged by SFO Over 2008 Qatar Loan Deal
Instacart Adds $200 Million to Defend Against Amazon Delivery
Unilever Threatens Online Ad Cuts to Clean Up Internet
After Settling With Uber, Waymo Faces Bigger Challenges
With Qualcomm in Play, San Diego Fears Losing `Our Flag’
Howard Lindzon: The Shift to Decentralization
Michael Batnick: An Unprecedented Decline
Ben Carlson: Some Random Observations On The Market Correction
Be sure to follow me on Twitter.
-
The S&P 500 Lost 5.16% this Week
Posted by Eddy Elfenbein on February 9th, 2018 at 6:19 pm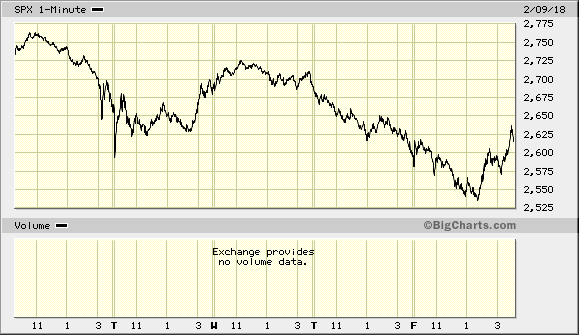
The week has come to an end. The S&P 500 gained 1.49% today. This was the second-best day for the index since the election. That fact seems odd because this week was so dramatic. The Dow was down 500 points today and then it was up 500 points.
For the year, the S&P 500 is down 2% which is very much in the normal range for six weeks in.
The relative performance of our Buy List has been very good this week. That’s always odd to say—the message is that we’re doing less awfully. Still, it reflects the fact that we have high-quality stocks and those don’t fall as hard in down markets.
At noon today, we were far ahead of the market, but our lead sagged as stocks recovered in the afternoon. For the week, the S&P 500 fell 5.16% while our Buy List lost 3.84%.
-
Moody’s Earned $1.51 per Share
Posted by Eddy Elfenbein on February 9th, 2018 at 9:48 amI expected Moody’s (MCO) to beat earnings and I was right. This morning, the credit ratings agency reported Q4 earnings of $1.51 per share. That was six cents better than estimates. Moody’s had quarterly revenue of $1.17 billion which topped expectations of $1.08 billion.
For the year, Moody’s made $6.07 per share which is a nice increase over the $4.94 they made in 2016. For 2018, Moody’s expects earnings to range between $7.65 and $7.85 per share. Wall Street had been expecting $6.89 per share.
This from the press release:
Moody’s expects full year 2018 revenue to increase in the low-double-digit percent range. Operating expenses are also expected to increase in the low-double-digit percent range.
Moody’s projects an operating margin of 43% to 44% and an adjusted operating margin of approximately 48%.
The effective tax rate is expected to be 22% to 23%.
Full year 2018 diluted EPS is expected to be $7.20 to $7.40. The Company expects full year 2018 adjusted diluted EPS to be $7.65 to $7.85. Both ranges include an approximate $0.65 benefit resulting from U.S. tax reform, as well as an estimated $0.20 benefit related to the tax accounting for equity compensation, in line with the benefit recognized in 2017. The majority of the latter benefit is expected to be recognized in the first quarter of 2018.
Like the rest of the market, shares of MCO had an eventful day. At its high, the stock was up more than 4% on the day, and two hours later, it was down nearly 2%. By the closing bell, Moody’s stood at $154.64 per share for a gain of 1.6%.
-
CWS Market Review – February 9, 2018
Posted by Eddy Elfenbein on February 9th, 2018 at 7:08 am“There is scarcely an instance of a man who has made a fortune by speculation and kept it.” – Andrew Carnegie
This week, the stock market’s slumber came to an end. On Monday, the S&P 500 plunged 4.1% for its biggest loss in more than six years.
But that’s not the unusual thing. In fact, a move like that happens, on average, about once a year. Big? Sure. Unprecedented? Hardly.
What is unprecedented was the market before Monday. The S&P 500 went an amazing 404 days without a 5% drawdown (meaning, we were never more than 5% from an all-time high.) That had never happened before. Ever.
The weird market behavior didn’t start on Monday. It ended on Monday.
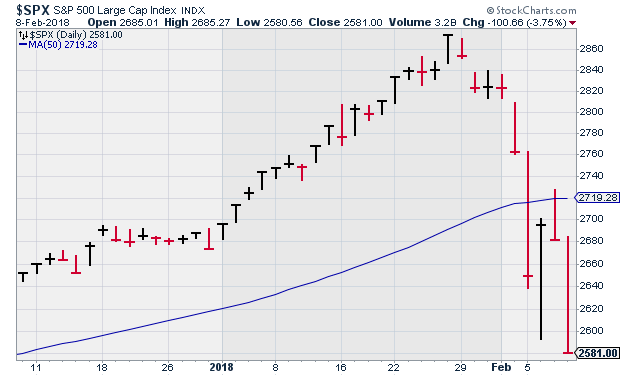
The S&P 500 recovered some lost ground on Tuesday, but it dropped a little on Wednesday. Then we got another big leg down on Thursday. The S&P 500 lost 3.75% on Thursday. Two of the three worst days in the market for the last 6-1/2 years happened within four days of each other. Two trillion dollars were erased. Investors got a reminder that stocks don’t always play nice.
In this week’s CWS Market Review, I’ll discuss what happened and what you need to do. (Hint: Chill.) I’ll also summarize a flurry of earnings reports from our Buy List stocks. Our earnings still look quite good. We got three dividend hikes this week. I also have a bunch of new Buy Below prices. But first, let’s look at Wall Street’s wake-up call.
Wall Street Awakens from Its Dream
For nearly two years, stock investing was as dull as can be. I know I mentioned this to you several times, but we barely got any ripples. Sure, there were some minor disruptions like Brexit and the election. But those squalls quickly passed.
The fact is, the stock market experienced historically low volatility. Not long ago, the Volatility Index dropped below 9! That’s really, really, REALLY low. This was combined with a relentless series of new highs. It seemed that nearly every day, stock prices went up by a teeny, tiny amount.
Last week, we finally felt some ripples. Then on Monday, the dam burst. The S&P 500 plunged 4.1%. That’s certainly a bad day, but it seems much larger because it’s such a jolt from the prevailing environment. Consider this stat: From September 6 until the end of January, the market’s largest single-day loss was 0.55%. That’s puny.
The S&P 500 is now officially in a correction which is defined as a drop of more than 10%. Since January 26, the S&P 500 has lost 10.16%. This is our tenth correction in the last 20 years. Two of those were full-fledged bear markets (down over 20%). What can I say? This is what markets do.
What to Do Now?
Let me pause here to make the most important point—our Buy List is fine. If you have a well-diversified portfolio of Buy List stocks, there’s no need to make any changes. When people get nervous, they flock toward high-quality stocks. That’s why our Buy List has outperformed lately. On Wednesday, our Buy List beat the S&P 500 by 0.31%. Then on Thursday, we creamed the index by 1.09%.
Later on in this newsletter, you’ll see how many of our stocks are releasing very good earnings reports, and some are giving us very nice dividend increases.
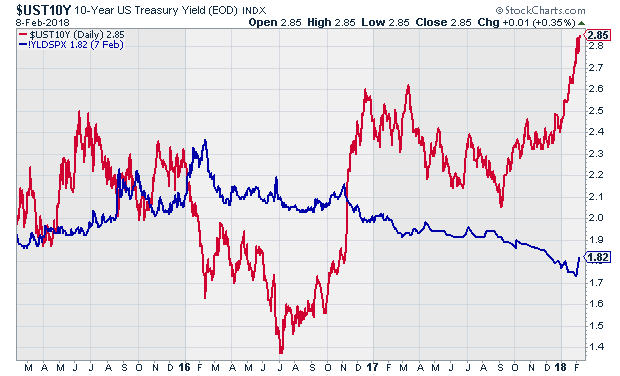
I try to shy away from blaming one factor for the stock market’s behavior. But I want to spend some time on one variable that I think has played an important role: the slow bear market in bonds. Since Labor Day, long-term bond yields have climbed steadily higher. On Thursday, the 10-year Treasury bond closed at 2.85%. That’s a four-year high.
When the 10-year was yielding 1.37%, as it was 18 months ago, the decision to buy stocks was an easy one. But now that bonds provide stiffer competition, the math changes.
While stocks are still attractive, it’s not such a no-brainer. See the chart below. The blue line is the yield of the S&P 500 while the red line is the yield on the 10-year Treasury. The gap has gotten much wider in recent months. This wasn’t going to be unnoticed forever.
The overall environment for business is still quite good. In fact, this earnings season is shaping up to being one of the best in years. The earnings “beat rate” is running at 78%. That’s the highest since Q3 2009.
The first quarter may be another good one for profits. During January, estimates were revised higher by 4.9%. On average, earnings estimates are cut by 2.1% during the first month of a quarter. I should add that initial jobless claims are very close to a 45-year low. We also got a surprisingly strong ISM Non-Manufacturing report this week.
Bond yields are still a long way from being a grave threat for stocks. I’ve run the numbers and found that stocks outperform bonds when the 10-year TIPs yield (the inflation-adjusted yield) is below 2.43%. Eighteen months ago, the 10-year TIPs yield was negative, but now it’s 0.76%. While yields are higher, they’re still a long way from being serious competition for stocks.
I’m also concerned that the futures market seems to believe the Federal Reserve will go ahead with three rate hikes this year. There’s even a growing chance of a fourth rate hike. That seems very unusual to me. Of course, stranger things have happened. In September, the futures market placed the odds of a March rate hike at 2%. Now it’s at 80%.
Let me caution investors to remain calm. Our strategy has worked and is still working. We’re simply going to experience a little more volatility. This is normal. What we had wasn’t. Continue to focus on high-quality names. Don’t get rattled by short-term moves. Make sure you’re diversified. Now let’s look at this week’s earnings reports.
Church & Dwight Beats the Street and Hikes Its Dividend
There are a lot of earnings reports to get to this week. Let’s start with Church & Dwight (CHD). On Monday, CHD reported Q4 earnings of 52 cents per share. I was impressed. The company had been expecting 50 cents per share. Organic sales rose 3.4% which was above their outlook of 2.5%. For the whole year, EPS rose 10% to $1.94 per share which also exceeded their outlook.
Make no mistake, this was a good quarter for CHD. Matthew Farrell, the CEO, said, “we are hitting on all cylinders.” That’s about right. The company also bumped up its quarterly dividend by 14%. I love seeing that. The payout rises to 21.75 cents per share from 19 cents per share. That makes the annual dividend 87 cents per share. Church & Dwight has paid out regular consecutive quarterly dividends for 117 years.
Now for guidance. For 2018, CHD expects EPS to range between $2.24 and $2.28. That’s growth of 16 to 18%. Wall Street had been expecting $2.14 per share. For Q1, Church & Dwight expects earnings of 61 cents per share on organic sales growth of 2%. Wall Street had been expecting 56 cents per share for Q1.
On Monday, Church & Dwight closed higher by 2.35%. It was one of only two stocks in the entire S&P 500 that gained value in the face of the selloff. Church & Dwight is a buy up to $54 per share.
On Tuesday morning, Becton, Dickinson (BDX) reported Q4 earnings of $2.48 per share. That beat the Street by seven cents per share. Revenues were up 2.7% on a currency-neutral basis. The company is very optimistic about the Bard acquisition. We’ve really done well here.
For 2018, Becton is looking for earnings to range between $10.85 and $11.00 per share. That’s a very good range, and it’s surprisingly narrow for a full-year forecast.
The market initially liked the report, and BDX spiked as high as $234 per share, but the shares ground lower as the week wore on. For now, I’m keeping my Buy Below at $228 per share.
After the bell on Tuesday, Cerner (CERN) gave us an earnings miss. For Q4, Cerner made 58 cents per share which was three cents below estimates. For the full year, Cerner made $2.38 per share.
I’m not too concerned about an earnings miss. Cerner currently expects Q1 earnings of 57 to 59 cents per share and 2018 earnings of $2.57 to $2.73 per share. Despite the miss, shares of Cerner held up relatively well this week. I’m dropping my Buy Below down to $67 per share.
Big Dividend Hikes from ICE and CTSH
Wednesday was a very busy day for us with four Buy List earnings reports. Before the bell, Intercontinental Exchange (ICE) reported Q4 earnings of 73 cents per share. That was one penny more than expectations. ICE also boosted its quarterly dividend by 20%. The payout will rise from 20 cents to 24 cents per share. This was ICE’s 12th consecutive year of record revenues.
“We are pleased to deliver our twelfth consecutive year of record revenue,” said ICE Chairman and CEO Jeffrey C. Sprecher. “We achieved this by executing on our strategy to deliver best-in-class trading, clearing, listings and information services while continuing to expand our range of content and distribution solutions to meet the evolving needs of the market. As we look to 2018 and beyond, we are focused on innovation and growth to serve our customers and build shareholder value.”
Scott A. Hill, ICE CFO, added: “In addition to investing in growth, we returned more capital to shareholders in 2017 than any year in our history enabled by another year of record revenue, disciplined expense management and strong cash flow. We remain committed to creating long-term value for our shareholders through operational execution and strategic investments to build on our track record of growth.”
The executives were optimistic on the conference call. Despite the good news, shares of ICE pulled back to $67 by Thursday’s close. I’m lowering my Buy Below price on ICE to $73 per share.
Also on Wednesday morning, Cognizant Technology Solutions (CTSH) reported Q4 earnings of $1.03 per share. That beat expectations by six cents per share. We also got a nice increase. CTSH is raising their dividend by 33% to 20 cents per share.
“Consistent and solid execution throughout 2017, along with continued investments to further accelerate the shift to digital during the year, gives us confidence that we can deliver a strong 2018,” said Francisco D’Souza, Chief Executive Officer. “As companies that are already leaders in their industries integrate their domain knowledge with today’s tremendously powerful technologies like artificial intelligence, analytics and cloud, we see a new generation of digital heavyweights emerging. Cognizant is resolved to be the go-to partner to these digital-industrial leaders and also to our fast-growing digital-native clients.”
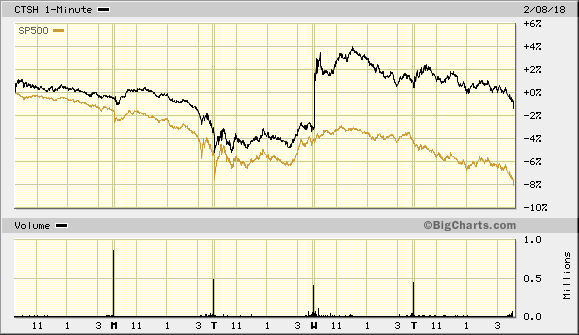
For Q1, they expect earnings of at least $1.04 per share. For all of 2018, they’re looking for earnings of at least $4.53. Wall Street had been expecting $1.01 for Q1 and $4.35 for the year. At one point, CTSH was up more than 7% on Wednesday, but the poor market on Thursday helped bring it back to $75.16. I’m raising my Buy Below to $81 per share.
After the closing bell on Wednesday, Fiserv (FISV) reported fourth-quarter earnings of $1.41 per share. That beat estimates by three cents per share. The company wrapped up its 32nd year in a row of double-digit EPS growth.
For 2018, they expect EPS between $6.05 and $6.30. Wall Street had been expecting $5.88 per share. They gained 3% in Thursday’s trading. For the second time this week, we had the #2 performing stock in the S&P 500. Fiserv is a buy up to $144.
Also on Wednesday, Torchmark (TMK) reported Q4 net operating income from continuing operations of $1.24 per diluted common share. That’s up from $1.15 per share last year. They beat the Street by a penny per share.
For the year, Torchmark made $4.82 per share in net operating income. That’s up from $4.49 in 2016. Their ROE came in at a very healthy 28.2%.
The company was impacted by the recent tax-reform legislation. Torchmark said that without the changes, they would have made $1.30 per share in Q4 and $4.88 per share for the whole year. I’m dropping my Buy Below to $89.
On Thursday morning Snap-on (SNA) reported Q4 earnings of $2.69 per share, three cents above Wall Street’s consensus. For the year, the company made $10.12 per share. On a strict valuation basis, Snap-on is reasonably priced. The stock dropped 6% on Thursday. I’m lowering my Buy Below to $167 per share.
Carriage and Smucker Report Next Week
Moody’s (MCO) is set to report later today. The company gave Q4 guidance of $1.28 to $1.43 per share. This is a solid stock. I’m expecting a beat.
We have two Buy List earnings reports next week. Carriage Services (CSV), our funeral home stock, is set to report on Wednesday, February 14. JM Smucker (SJM) will report its fiscal Q3 earnings on Friday, February 16. This will be for the quarter ending January 31. The jelly people now expect full-year earnings of $7.75 to $7.90 per share. For the quarter, Wall Street expects $2.12 per share.
That’s all for now. More earnings are coming next week. On Wednesday, there are two econ reports I’m looking out for. I want to see if retail sales have been strong since the holidays. We’ll also see the CPI report for January. So far, inflation has been tame, but there are worries that prices are rising. Then on Thursday, we’ll get the latest report on industrial production. Be sure to keep checking the blog for daily updates. I’ll have more market analysis for you in the next issue of CWS Market Review!
– Eddy
Syndication Partners
I’ve recently teamed up with the folks at Investors Alley to feature some of their content. I think they have really good stuff. Check it out!
2 Reasons You Need to Dump Apple Now
Apple (Nasdaq: AAPL) just set a record for the most profitable quarter in the company’s history. Not surprising since Apple executives said in November that they were expecting their “biggest quarter ever” and a return to double-digit revenue growth for the first time in years.
But not all is well with the world’s largest company by market capitalization. One needs look no further than the stock’s relative performance to the S&P 500 index over the last three-month period. Apple has been a definite laggard.
I expect that relative underperformance to continue. Here are two reasons why:
2 Set and Forget High-Yield Stocks with a Long History of Raising Dividends
To be a successful investor, instead of a short-term trader, you need to have a strategy based on the underlying fundamental financials of the companies in which you buy and own shares. There are different strategies to choose from including growth stocks where the companies are growing faster than the economy, value stocks where the market does not see the value of a company’s assets, and bets on future technologies with stocks such as Tesla or drug stock IPOs.
The strategy I employ and share with my Dividend Hunter readers is to earn dividend income from companies with stable and growing per share cash flows. I search the stock market universe for those companies whose shares have attractive yields, current dividends are well covered by free cash flow, and there is a plan or potential for continued cash flow growth.
With these companies you don’t need to check share prices every day. Once a quarter when earnings come out, you check the cash flow per share, the dividend announcement, and the income statement to see if the company is staying on plan. If that is the case, you continue to own the shares. This strategy lets you stay invested through the ups and downs of the stock market. When share prices do drop, your knowledge of the companies’ underlying financial strengths allows you to confidently purchase more shares. You get to adhere to the rarely-followed investing rule to buy low and earn more dividends.
Here are two stocks that just released their 2017 earnings result that illustrate the dividend growth investing strategy.
-
Morning News: February 9, 2018
Posted by Eddy Elfenbein on February 9th, 2018 at 7:03 amCentral Banks Are Telling Markets It’s Time to Grow Up
Trump ‘Energy Dominance’ Policy Pits Washington Against Moscow
New Budget Deal Adds More Stimulus – and Debt – to an Overextended American Economy
Google Fined by India Antitrust Watchdog
Why Qualcomm Turned Down Broadcom’s $121 Billion Offer—And What Comes Next
Nvidia Just Cleared a High Bar and Signaled It Has Plenty of Growth Left
Philip Morris: 2018 Guidance Calls For 34% To 38% EPS Growth
AT&T, Walmart Bolster Their Tax Savings in Paying Worker Bonuses
PepsiCo Dips Its Toes Into the Sparkling Water Market
To Power the Future, Carmakers Flip on 48-Volt Systems
Cryptocurrencies Come to Campus
Jim Rogers Says Next Bear Market Will Be Worst in His Life
Roger Nusbaum: Harry Markowitz’s Portfolio
Cullen Roche: How to Overcome Your Fear of Bonds
Mark Hines: Limiting Risk In A Volatile Market
Be sure to follow me on Twitter.
-
Morning News: February 8, 2018
Posted by Eddy Elfenbein on February 8th, 2018 at 7:10 amChina’s Yuan Toppled From Two-Year High as Trade Data Surprises
Bank of England Set to Hike Rates Earlier Than Expected
U.S. Shuts Down Cyber Crime Ring Launched by Ukrainian
Tesla Says It Is Making Progress on Model 3 Production Issues
Twitter Reports First Profit but User Growth Misses Estimates
Here’s How Amazon Prime’s New Whole Foods Delivery Will Work
In an Eco-Friendly Move, Dunkin’ Donuts Will Ditch Foam Cups by 2020
Murdochs Defend $3 Billion ‘Thursday Night Football’ Price Tag
Why Walmart Wants to Sell More Stuff for $10 and Up
Russian Watchdog Says to Examine Facebook in Second Half
‘Greed is Good’?: Waymo Turns to Gordon Gekko to Aid its Case Against Uber
Without Steve Wynn, Casino Empire Risks Losing More Than a Name
Jeff Carter: Economics, The Welfare of The Poor And Middle Class OR The Numbers Game
Howard Lindzon: Corrections and Crashes Happen …and Growth Is Good
Joshua Brown: The Best Hedge There Is
Be sure to follow me on Twitter.
-
Archives
- October 2026
- September 2026
- August 2026
- July 2026
- June 2026
- May 2026
- April 2026
- March 2026
- February 2026
- January 2026
- December 2025
- November 2025
- October 2025
- September 2025
- August 2025
- July 2025
- June 2025
- May 2025
- April 2025
- March 2025
- February 2025
- January 2025
- December 2024
- November 2024
- October 2024
- September 2024
- August 2024
- July 2024
- June 2024
- May 2024
- April 2024
- March 2024
- February 2024
- January 2024
- December 2023
- November 2023
- October 2023
- September 2023
- August 2023
- July 2023
- June 2023
- May 2023
- April 2023
- March 2023
- February 2023
- January 2023
- December 2022
- November 2022
- October 2022
- September 2022
- August 2022
- July 2022
- June 2022
- May 2022
- April 2022
- March 2022
- February 2022
- January 2022
- December 2021
- November 2021
- October 2021
- September 2021
- August 2021
- July 2021
- June 2021
- May 2021
- April 2021
- March 2021
- February 2021
- January 2021
- December 2020
- November 2020
- October 2020
- September 2020
- August 2020
- July 2020
- June 2020
- May 2020
- April 2020
- March 2020
- February 2020
- January 2020
- December 2019
- November 2019
- October 2019
- September 2019
- August 2019
- July 2019
- June 2019
- May 2019
- April 2019
- March 2019
- February 2019
- January 2019
- December 2018
- November 2018
- October 2018
- September 2018
- August 2018
- July 2018
- June 2018
- May 2018
- April 2018
- March 2018
- February 2018
- January 2018
- December 2017
- November 2017
- October 2017
- September 2017
- August 2017
- July 2017
- June 2017
- May 2017
- April 2017
- March 2017
- February 2017
- January 2017
- December 2016
- November 2016
- October 2016
- September 2016
- August 2016
- July 2016
- June 2016
- May 2016
- April 2016
- March 2016
- February 2016
- January 2016
- December 2015
- November 2015
- October 2015
- September 2015
- August 2015
- July 2015
- June 2015
- May 2015
- April 2015
- March 2015
- February 2015
- January 2015
- December 2014
- November 2014
- October 2014
- September 2014
- August 2014
- July 2014
- June 2014
- May 2014
- April 2014
- March 2014
- February 2014
- January 2014
- December 2013
- November 2013
- October 2013
- September 2013
- August 2013
- July 2013
- June 2013
- May 2013
- April 2013
- March 2013
- February 2013
- January 2013
- December 2012
- November 2012
- October 2012
- September 2012
- August 2012
- July 2012
- June 2012
- May 2012
- April 2012
- March 2012
- February 2012
- January 2012
- December 2011
- November 2011
- October 2011
- September 2011
- August 2011
- July 2011
- June 2011
- May 2011
- April 2011
- March 2011
- February 2011
- January 2011
- December 2010
- November 2010
- October 2010
- September 2010
- August 2010
- July 2010
- June 2010
- May 2010
- April 2010
- March 2010
- February 2010
- January 2010
- December 2009
- November 2009
- October 2009
- September 2009
- August 2009
- July 2009
- June 2009
- May 2009
- April 2009
- March 2009
- February 2009
- January 2009
- December 2008
- November 2008
- October 2008
- September 2008
- August 2008
- July 2008
- June 2008
- May 2008
- April 2008
- March 2008
- February 2008
- January 2008
- December 2007
- November 2007
- October 2007
- September 2007
- August 2007
- July 2007
- June 2007
- May 2007
- April 2007
- March 2007
- February 2007
- January 2007
- December 2006
- November 2006
- October 2006
- September 2006
- August 2006
- July 2006
- June 2006
- May 2006
- April 2006
- March 2006
- February 2006
- January 2006
- December 2005
- November 2005
- October 2005
- September 2005
- August 2005
- July 2005
 Eddy Elfenbein is a Washington, DC-based speaker, portfolio manager and editor of the blog Crossing Wall Street. His