-
Morning News: January 4, 2018
Posted by Eddy Elfenbein on January 4th, 2018 at 7:05 amResearchers Discover Two Major Flaws in the World’s Computers
How a Secretive Conclave Decides When U.S. Recessions Happen
Commodities Are on Their Longest Winning Streak in History
Bitcoin’s Cheap Energy Feast Is Ending
U.S. Auto Sales Slump in First Since 2009, But Party Isn’t Over
Competing With the Giants in Race to Build Self-Driving Cars
Tesla Reports New Setack for Model 3, With Output Lagging
AT&T Says It Will Launch 5G in a Dozen Cities This Year
Smaller Rite Aid Plans To Grow PBM’s Medicare Prescription Business
McDonald’s New ‘Archburger’ Will Use Fresh Beef Instead of Frozen
Spotify Makes Confidential Filing for IPO
Even a Billionaire Brother’s Love Has Limits
Roger Nusbaum: Random Roger Round Up
Howard Lindzon: One Man’s Bubble is Another’s Wealth Generating Event
Josh Brown: Pro-Am & Bess Levin on the Market’s Mute Button
Be sure to follow me on Twitter.
-
Dividends Rose 6.31% in Q4
Posted by Eddy Elfenbein on January 3rd, 2018 at 12:07 pmLast quarter was another good one for dividends for the S&P 500. Dividends rose by 6.31% over Q4 2016. This is the 31st quarter in a row of dividend increases for the index.
For the year, dividends were up 7.07% over 2016. Over the last seven years, dividends are up 115%. That’s actually a tiny bit slower than the S&P 500. In other words, the index has gotten cheaper on a yield basis.

The blue is the S&P 500 and it follows the left scale. The black is the rolling 12-month dividends and it follows the right scale.
For some reason the y-axis indicators didn’t show up, but both axes are scaled at a ratio of 50-to-1. That means that whenever the lines cross, the S&P 500’s dividend yield is exactly 2%. As you can see, it’s tracked near 2% fairly well for the last 15 years.
Both axes are logarithmic. The left goes from 600 to 3,000 while the right goes from 12 to 60.
-
The S&P 500 Breaks 2,700
Posted by Eddy Elfenbein on January 3rd, 2018 at 11:17 amFor the first time ever, the S&P 500 broke 2,700 this morning. The index was last below 27 in March 1954 (it was still below its 1929 high). That’s a 100-fold gain in 64 (and 89) years.
We only have about 4% or so to go for the S&P 500 Total Return Index to be five times where it was at the March 2009 low.
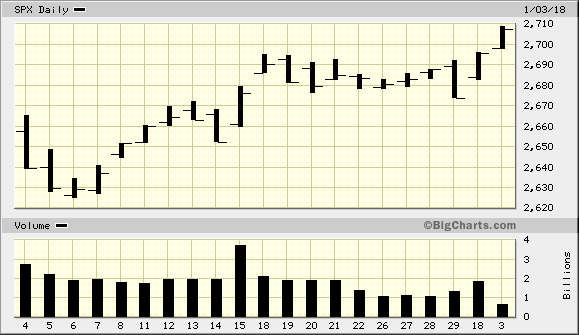
Yesterday’s market was interesting because high-beta stocks did well while low vol stocks lagged along. Today’s market is more balanced but small-caps are leading the pack.
Before the market opened, we learned that the ISM Manufacturing Index was 59.7 for December. That’s a good number, and it was up from 58.2 in November. We also learned that construction spending rose 0.8% in November. In the past year, construction spending was up 2.4%.
-
Morning News: January 3, 2018
Posted by Eddy Elfenbein on January 3rd, 2018 at 7:05 amGermany’s Jobless Rate Drops to Record Low as Economy Booms
MiFID Shake-Up Gets Real as Wary Traders See Volumes Dry Up
New in the West Bank: A Credit Boom Waiting for a Real Economy
Bitcoin Loses Some Dazzle as Second-Tier Crypto Coins Catch Up
Peter Thiel Is a Bitcoin Believer
Meet The Crypto Billionaires Getting Rich From Ripple’s XRP
American and Southwest Airlines Promise ‘Tax Bill Bonus’ for Employees
Amazon Will Buy Target This Year, Gene Munster Predicts
Tesla’s Scant Disclosures on the Model 3 Leave Wall Street Guessing
McDonald’s Tests New Fresh Beef Burger
A Saucy App Knows China’s Taste in News. The Censors Are Worried.
Jeff Carter: The Next Big Thing Is Hard
Michael Batnick: The Math Doesn’t Work
Cullen Roche: The 2018 Global Financial Asset Portfolio
Be sure to follow me on Twitter.
-
The S&P 500 Sectors in 2017
Posted by Eddy Elfenbein on January 2nd, 2018 at 8:30 amHere’s an interesting chart. This shows the relative strength of the major S&P 500 sectors during 2017.
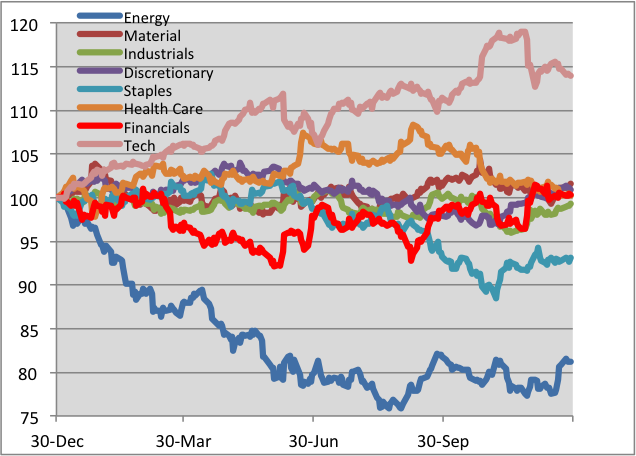
Sorry I had to cram the legend on there.
To be clear, this isn’t how well the sectors did overall. Instead, it’s the sectors divided by the S&P 500. In other words, a rising line means the sector is beating the market while a falling line means it’s trailing. I used the total return figures.
A few things stand out. First, this was a tough year for Energy stocks. They badly trailed the market during the first part of the year. (I didn’t include Real Estate, Utes or Telecoms. The chart is crowded enough as it is.)
The Tech Sector was the big winner; however, there were two pullbacks, one in June and another in November.
Most of the other sectors could fairly be said to be market performers. Healthcare was strong during much of the year, but it tailed off after Labor Day. Financials were weak through May but picked up steam later in the year.
I think I was most surprised by the weakness in Consumer Staples from May to November.
-
Morning News: January 2, 2018
Posted by Eddy Elfenbein on January 2nd, 2018 at 7:04 amBitcoin May Be Struggling — But Ethereum Just Posted a Fresh All-Time High
Europe’s Record Factory Growth Puts the Squeeze on Resources
OPEC Deal Doesn’t Stop Russia From Record Oil Output in 2017
China Bulls Out in Force as Stocks, Yuan Start Year With Gains
LeEco’s Jia Defies China Return Order, Sends Family Instead
California Rolls Its Own Recreational Pot Sales Out For 2018
The $15 Minimum Wage Movement Is Winning, And That’s Bad News For Cashiers
BP Takes $1.5 Billion Charge Related to U.S. Tax Overhaul
With Disney Deal Looming, Murdoch’s Empire Is Fractured
UPS: If The Founders Were Alive Today
Those Seatback Screens on Planes Are Starting to Disappear
Toasts to the Deals (and Other Winners) of 2017
Ben Carlson: Upside Risk Management
Jeff Miller: What Should Worry Investors in 2018?
Howard Lindzon: I Love 2018…and Trump Made American Stocks Below Average in 2017
Be sure to follow me on Twitter.
-
Morning News: January 1, 2018
Posted by Eddy Elfenbein on January 1st, 2018 at 7:56 amHow China Will Shake Up the Oil Futures Market
Goldman Sees Crypto, Credit Shadowing Robust 2018 U.S. Economy
Wall Street Eyes 2018 Gains with a Side of Caution
Start of a New Year of Trading, and Jobs Report from December
As U.S. Budget Fight Looms, Republicans Flip Their Fiscal Script
Tax Law Offers a Carrot to Gig Workers. But It May Have Costs.
A Retailers’ Guide to Curbing Online Gift Returns
How Do You Turn an Ad Into a Meme? Two Words: Dilly Dilly
Japan’s Nippon Life Eyeing M&A for Foreign Boutique Bond and Alternative Funds
8 Changes to Social Security in 2018
Louisiana Man Charged in ‘Nigerian Prince’ Scheme
Josh Brown: Snowballing into 2018
Michael Batnick: These Are the Goods
Be sure to follow me on Twitter.
-
The 2018 Buy List
Posted by Eddy Elfenbein on December 31st, 2017 at 6:17 pmHere are the 25 stocks for the 2018 Buy List. It’s locked and sealed, and I can’t make any changes for 12 months.
For tracking purposes, I assume the Buy List is a $1 million portfolio that’s equally divided among 25 stocks. Below are all 25 positions with the number of shares for each and the closing price for 2017. Whenever I discuss how the Buy List is doing, the list below is what I’m referring to.
Company Ticker Price Shares Balance AFLAC AFL $87.78 455.6847 $40,000.00 Alliance Data Systems ADS $253.48 157.8034 $40,000.00 Becton, Dickinson BDX $214.06 186.8635 $40,000.00 Carriage Services CSV $25.71 1,555.8149 $40,000.00 Cerner CERN $67.39 593.5599 $40,000.00 Check Point Software CHKP $103.62 386.0259 $40,000.00 Church & Dwight CHD $50.17 797.2892 $40,000.00 Cognizant Technology Solutions CTSH $71.02 563.2216 $40,000.00 Continental Building Products CBPX $28.15 1,420.9591 $40,000.00 Danaher DHR $92.82 430.9416 $40,000.00 FactSet Research Systems FDS $192.76 207.5119 $40,000.00 Fiserv FISV $131.13 305.0408 $40,000.00 Hormel Foods HRL $36.39 1,099.2031 $40,000.00 Ingredion INGR $139.80 286.1230 $40,000.00 Intercontinental Exchange ICE $70.56 566.8934 $40,000.00 JM Smucker SJM $124.24 321.9575 $40,000.00 Moody’s MCO $147.61 270.9844 $40,000.00 Ross Stores ROST $80.25 498.4424 $40,000.00 RPM International RPM $52.42 763.0675 $40,000.00 Sherwin-Williams SHW $410.04 97.5515 $40,000.00 Signature Bank SBNY $137.26 291.4177 $40,000.00 Snap-on SNA $174.30 229.4894 $40,000.00 Stryker SYK $154.84 258.3312 $40,000.00 Torchmark TMK $90.71 440.9657 $40,000.00 Wabtec WAB $81.43 491.2195 $40,000.00 Total $1,000,000.00 The five new stocks are Carriage Services, Check Point Software Technologies, Church & Dwight, FactSet Research Systems and Torchmark.
Also, thanks to the recent merger, Becton, Dickinson will take the place of CR Bard.
The five deletions are Axalta Coating Systems, Cinemark Holdings, Express Scripts, HEICO and Microsoft.
Danaher is now our largest stock, with a market cap of $65 billion. The Buy List is mostly large- and mid-cap stocks. Only two are smaller than $7 billion. Continental Building Products is about $1 billion, and Carriage Services is $410 million.
Only AFLAC and Fiserv have been on the Buy List all 13 years. This is Stryker’s 11th year. FactSet is returning for the third time to the Buy List.
Here’s a brief look at our five new stocks.
Carriage Services (CSV) is a Texas-based funeral-home operator. They currently operate 178 funeral homes in 29 states, and 32 cemeteries in 11 states. Barely anyone on Wall Street follows Carriage, but the numbers look good.
Check Point Software Technologies (CHKP) is an Israeli-based computer-security firm. It’s not cheap at 19.7 times this year’s earnings, but I think that’s not a bad price considering their growth.
Church & Dwight (CHD) is a company I’ve wanted to add for many years. They’re a consumer-products stalwart. C&D owns several well-known brands like Arm & Hammer, OxiClean and, of course, Trojan.
FactSet Research Systems (FDS) is a financial-data and software company. They help provide all the numbers that investors love to crunch. The stock was previously on the Buy List from 2006 to 2009 and again in 2013. I probably should have had them on the whole time.
Torchmark (TMK) is a stock I’ve wanted to add to the Buy List for years. This is a very well-run insurance company based in Texas. Torchmark specializes in serving the middle-income market. The company almost always grows its operating income by 7% to 10% per share each year.
The 2017 Buy List
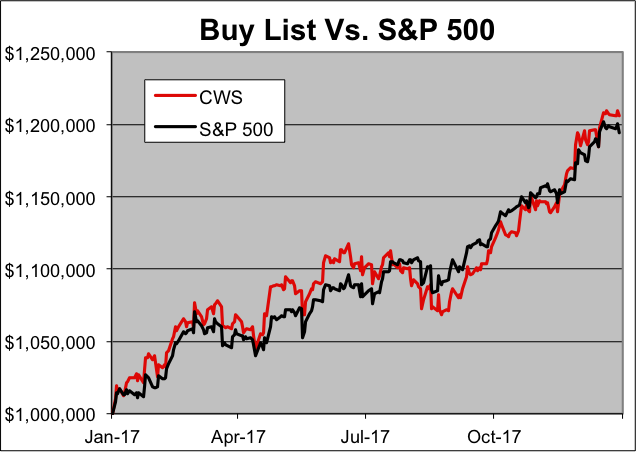
Posted by Eddy Elfenbein on December 31st, 2017 at 5:32 pmThe 2017 trading year is on the books! For 2017, the S&P 500 gained 19.42% while our Buy List gained 20.58%. However, if we include dividends (and total return is what really counts), then the S&P 500 gained 21.83% while out Buy List gained 21.79%.
In other words, we lost to the market by 0.04%! That comes to down to one penny over the whole year for every $25 invested.
I’m very competitive, so I hate losing to the market, even if it’s by a teeny amount. I will, however, add a few words in my defense. This was a difficult market to beat because a small number of very large companies did very well. That tended to distort the market’s overall return. About 55% of the stocks in the S&P 500 failed to beat the S&P 500.
Still, over the long haul, our Buy List has done very well. Over the last 12 years, the total compounded gain for the Buy List is 228.09%, compared with 176.11% for the S&P 500.
Our biggest winner this year was Moody’s (MCO), which gained more than 56%. HEICO (HEI) came in second. HEI was our #1 performer in 2016. Twenty-one of our 25 stocks finished in the black in 2017. Our biggest loser was Signature Bank (SBNY), which lost 8.6%.
For people who care about such things, the “beta” of our Buy List in 2017 was 1.0092. The correlation of the daily changes of the Buy List to the changes of the S&P 500 was 83.6%.
The chart below details the Buy List’s performance. I’ve listed each stock along with the number of shares and the starting and ending prices. For tracking purposes, I assume the Buy List is a $1 million portfolio that starts out equally divided among the 25 stocks.
Stock Shares 12/30/16 Beginning 12/29/17 Ending Profit/Loss AFL 574.7126 $69.60 $40,000 $87.78 $50,448.27 26.12% ADS 175.0547 $228.50 $40,000 $253.48 $44,372.87 10.93% AXTA 1470.5882 $27.20 $40,000 $32.36 $47,588.23 18.97% CERN 844.4163 $47.37 $40,000 $67.39 $56,905.21 42.26% CNK 1042.7529 $38.36 $40,000 $34.82 $36,308.66 -9.23% CBPX 1731.6017 $23.10 $40,000 $28.15 $48,744.59 21.86% CTSH 713.9033 $56.03 $40,000 $71.02 $50,701.41 26.75% BCR 178.0468 $224.66 $40,000 $331.24 $58,976.22 47.44% DHR 513.8746 $77.84 $40,000 $92.82 $47,697.84 19.24% ESRX 581.4799 $68.79 $40,000 $74.64 $43,401.66 8.50% FISV 376.3643 $106.28 $40,000 $131.13 $49,352.65 23.38% HEI 648.0881 $61.72 $40,000 $94.35 $61,147.11 52.87% HRL 1149.0951 $34.81 $40,000 $36.39 $41,815.57 4.54% INGR 320.1024 $124.96 $40,000 $139.80 $44,750.32 11.88% ICE 708.9685 $56.42 $40,000 $70.56 $50,024.82 25.06% MSFT 643.7078 $62.14 $40,000 $85.54 $55,062.77 37.66% MCO 424.3131 $94.27 $40,000 $147.61 $62,632.86 56.58% ROST 609.7561 $65.60 $40,000 $80.25 $48,932.93 22.33% RPM 743.0801 $53.83 $40,000 $52.42 $38,952.26 -2.62% SHW 148.8427 $268.74 $40,000 $410.04 $61,031.46 52.58% SBNY 266.3116 $150.20 $40,000 $137.26 $36,553.93 -8.62% SJM 312.3536 $128.06 $40,000 $124.24 $38,806.81 -2.98% SNA 233.5494 $171.27 $40,000 $174.30 $40,707.66 1.77% SYK 333.8619 $119.81 $40,000 $154.84 $51,695.18 29.24% WAB 481.8116 $83.02 $40,000 $81.43 $39,233.92 -1.92% Total $1,000,000 $1,205,845.20 Note that HEICO (HEI) split 5-for-4 on April 19.
Note on CR Bard (BCR). The company was bought out by Becton Dickinson (BDX). The deal was completed on December 29, the final trading day of the year. For the year-end price, we used the final price for BCR, which was $332.24, although BCR didn’t trade during the day on December 29.
Here’s how the Buy List performed throughout the year:
Here’s the data behind the dividend-adjusted returns. I’ve listed each stock’s beginning price, ending price and dividend-adjusted starting price. My source for dividend-adjusted prices is StockCharts.
 Eddy Elfenbein is a Washington, DC-based speaker, portfolio manager and editor of the blog Crossing Wall Street. His