-
Today Is a Big Day in Gold’s History
Posted by Eddy Elfenbein on August 16th, 2016 at 9:04 amAt Navellier Market Mail, Gary Alexander sums up why August 16 has been such an important day in the history of gold.
Today marks a red-letter day in the history of gold in America. On August 16, 1896, George Carmack discovered one of the largest gold strikes in history on Rabbit Creek in Canada’s Yukon Territory, just across the border from Alaska. A century ago this week (August 14, 1916), Denmark approved the sale of the Virgin Islands to America for $25 million in gold – another land-grab bargain made possible by taking advantage of cash-starved European nations during a World War. And on August 16, 1925, Charlie Chaplin’s silent film classic, The Gold Rush, inspired by the 1849 gold rush, opened to U.S. audiences.
The most dramatic golden event in U.S. history came 45 years ago on Monday, August 16, 1971, when the Dow Jones Industrial Average rose 33 points (+3.8%) the morning after President Richard M. Nixon appeared on national TV to “close the gold window” (refusing to honor the $35 per ounce price of gold), effectively devaluing the dollar. Nixon also imposed wage and price controls (in response to a 3% CPI inflation rate!), and a 10% surcharge on all imports. You would think this package of central controls of the economy in a free nation would have caused stocks to fall, but Nixon’s moves were very popular at the time.
A poll of 220 households by Albert E. Sindlinger & Co. on August 16 revealed that 75% of Americans favored the President’s proposals, while “most of those who dissented did so on the ground that Mr. Nixon’s actions should have come sooner.” Mr. Sindlinger said, “In all the years I’ve been doing this business – more than 15 – I’ve never seen anything this unanimous, unless maybe it was Pearl Harbor.”
I was on deadline at a major magazine writing about Nixon’s 1971 Dollar Crisis. I was shocked but not surprised by the announcement, since I had read Harry Browne’s 1970 book on the Coming Devaluation. I came to know at least three other people who were so shocked by Nixon’s move that they launched new businesses. All three of them intersected my life over the following decades: (1) New Orleans school teacher James U. Blanchard III formed The National Committee to Legalize Gold. Also: (2) David Nolan saw Nixon’s speech in his Colorado living room and decided to form the Libertarian Party; and (3) Robert D. Kephart, publisher of Human Events decided to publish an “Inflation Survival Letter” (which morphed into “Personal Finance”) to help investors survive the inflation that was certain to follow price controls. (Full disclosure: I eventually edited publications for Bob Kephart and Jim Blanchard during the 1980s).
It’s still hard to believe that it was illegal for Americans to own most forms of gold from 1933 to 1974. On April 5, 1933, FDR’s Executive Order 6102 demanded we surrender our gold for $20.67 per ounce. Those who stuffed this inert metal in a mattress or vault risked 5-10 years in prison and/or a $10,000 fine!
This gold story ends with a Pyrrhic victory for gold investors. On August 14, 1974, Congress authorized U.S. citizens to own gold for the first time in 41 years, as of December 31. This was a Pyrrhic victory since Americans missed all the gains from $20 (in 1933) to $195 (the gold price on December 30, 1974). Alas, gold then proceeded to fall sharply after it was legal to own, falling to $102.20 on August 30, 1976.
Here’s how gold performed in the early 1970s.
-
Morning News: August 16, 2016
Posted by Eddy Elfenbein on August 16th, 2016 at 7:14 amChina Said to Drop Total Quota for Shenzhen-Hong Kong Link
German ZEW Investor Confidence Recovers as Brexit Shock Settles
Offshore Wind Could Replace Hinkley Nuclear in U.K. at Same Cost
SEC Suspends Trading in OTC Stock After Value Soars to $35 Billion
Aetna to Drop Some Affordable Care Act Markets
Home Depot Lifts Profit Forecast As Housing Market Strengthens
BHP Billiton Reports Worst-Ever Annual Loss
Univision Among At Least Two Bidders For Gawker Media
Praxair Holds Merger Discussions With Germany’s Linde
Berkshire Takes Bigger Bite of Apple, Pares Wal-Mart
AIG Reaches Deal to Sell Mortgage-Insurance Unit to Arch Capital for About $3.4 Billion
Advance Auto Parts’ Earnings Fall Back
Roger Nusbaum: Markets Take the Week Off to Watch The Olympics
Cullen Roche: Auto Loans Aren’t a Repeat of the 2008 Financial Crisis
Be sure to follow me on Twitter.
-
Hormel Is Much More than Spam
Posted by Eddy Elfenbein on August 15th, 2016 at 12:15 pmBloomberg gives an in-depth look at Hormel Foods (HRL). Here’s a sample:
Spam, more than any other product, defines Hormel. Through its 125-year history, the company’s strategy has been simple: protein, preferably with a long shelf life. Its other brands—Dinty Moore beef stew, Mary Kitchen hash, Real Bacon toppings, Herb-Ox bouillon cubes and its eponymous chili—sound like the shopping list for a Cold War fallout shelter.
In 2014, Hormel filed a patent for a meat sandwich that lasts longer than 14 days. As Chief Executive Officer Jeffrey Ettinger put it, Hormel maintained “a very American-dominated portfolio with a lot of kind of traditional American food type items.”
This is not, in short, a brand given to taking risks or chasing trends.
But around 2007, Hormel quietly embarked on a venture that would take it deeper than it had ever been into the cupboards and kitchens of Americans, many of them immigrants, many of them young. It led to a series of acquisitions and a blitz of research and development that helped round out its pantry of products and inoculate it against the fickle modern food trends of a kale-and-quinoa world.
One of the first things it did was hire an anthropologist.
Read the whole thing.
-
The Volatility Killer
Posted by Eddy Elfenbein on August 15th, 2016 at 10:51 amThe S&P 500 is up to another all-time high today. Since Brexit, the S&P 500 has had 11 down days. It’s closed higher the following day 10 times.
Here are the daily changes since June.
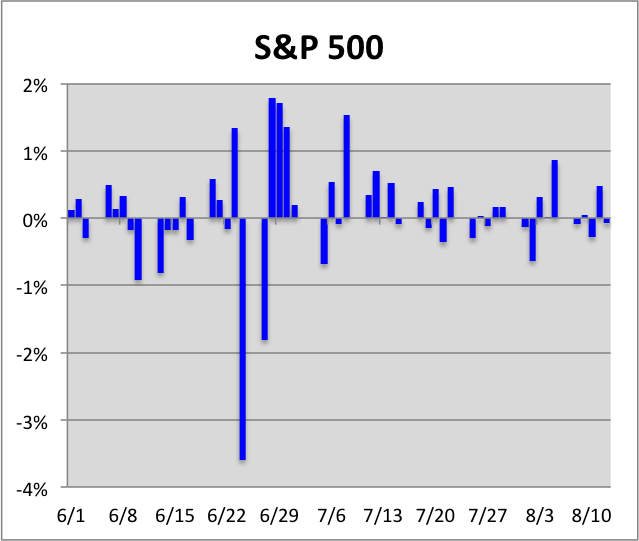
The last 43 down days for the S&P 500, the market has closed higher the following day 31 times.
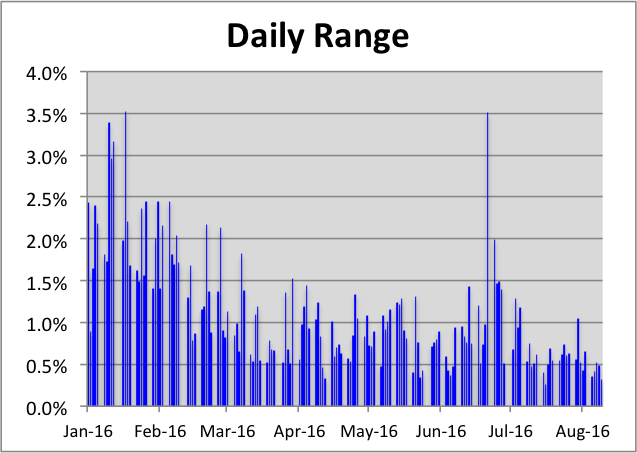
Here’s a look at the daily ranges this year, meaning the difference between the S&P 500’s high and low. Notice how much narrower it’s become all year. Brexit is an obvious exception, but that didn’t last long.
-
The Election Year Indicator
Posted by Eddy Elfenbein on August 15th, 2016 at 10:46 amI don’t place a lot of faith in these kinds of stats, but it’s interesting to note how Election Year Indicator has performed.
The Election Year Indicator states that when the stock market rallies in the final three months before the election, the incumbent party wins. If not, the challenger wins. The indicator has been right 19 times in the last 22 elections.
(T)he election years of 1984, 1988, 1996, 2004 and 2012 all had market corrections of 7 percent or more and yet finished the year positive.
(…)
(Since) 1928, only four election years had losses of greater than 3 percent.
This year, the market started with its worst loss in history.
When the stock market moves higher, the incumbent party usually wins. That has been the case in 12 of the 14 elections since 1928.
Conversely, in the eight elections since 1928 when the S&P moved lower, the incumbent party lost seven times. The stock market has correctly predicted the winning party 19 out of 22 elections, Stack said.
Perhaps people don’t vote their wallet; they vote their 401(k).
-
Morning News: August 15, 2016
Posted by Eddy Elfenbein on August 15th, 2016 at 7:10 amPBOC Says Money Supply Growth Will Rebound, No ‘Liquidity Trap’
Japan’s Economy Stalls in April-June, Casts Doubts on Abe’s Policies
Japan Is Said to Be Negotiating with Banks to Borrow At a Zero Rate
Dollar Extends Drop as Faltering Economy Pares Rate-Boost Wagers
FAA Clears Indonesian Carriers for Takeoff to the U.S.
How Millennials Became Spooked by Credit Cards
Tesla Removes ‘Autopilot’ From China Website After Beijing Crash
Lonza to Acquire InterHealth for as Much as $300 Million
Sharp Extends Gain After Foxconn Completes Capital Injection
A Tech Mogul’s Fight to Keep Control of a Newspaper Empire
At Aldi’s Empire of Austerity, a Fight Over Extravagant Spending
Jeff Miller: Have Stock and Oil Prices Decoupled?
Jeff Carter: Serendipity Doesn’t Happen By Being Passive
Be sure to follow me on Twitter.
-
CWS Market Review – August 12, 2016
Posted by Eddy Elfenbein on August 12th, 2016 at 7:08 am“Don’t gamble; take all your savings and buy some good stock and hold it till it goes up, then sell it. If it don’t go up, don’t buy it.” – Will Rogers
If I were to ask someone who only paid attention to major news headlines and gave zero attention to the stock market where they thought the market currently is, they’d probably think we’re in pretty rough shape. I doubt they’d say were in an all-time record high with low volatility.
But that’s the truth. In fact, on Thursday, all three major indexes closed at all-time highs. The last time that happened was on December 31, 1999. The stock market has shaken off nearly every reason to go down (Brexit, China, Zika, terrorism, politics). It’s almost as though the worse the news is, the better the stocks do.
Fortunately, we got some good news last week, with a strong jobs report. There’s also—finally—some decent news on wages. I’ll have more details for you in a bit. We also had a nice earnings beat from Cognizant Technology Solutions, although the outlook was on the cautious side.
Later on, I’ll preview two Buy List earnings reports for next week, Ross Stores and Hormel Foods. My numbers say Ross Stores should beat expectations. But first, let’s take a closer look at this boring, dull, lethargic stock market. Which, by the way, is at an all-time high.
The Current Market Is Boring, and That’s a Good Thing
I think I’m running out of stats to explain how drowsy this market is. Let me try a couple on you: In the last 27 days, the second-worst day for the S&P 500 was a loss of 0.36%. Oh the humanity! Every day but one has been better than that.
The daily range of the S&P 500, meaning the distance between the high and the low, has been less than 0.65% 19 times in the last 22 days. To put that in perspective, that didn’t happen once during the first 45 trading days of this year. Notice how much smaller the daily “candlesticks” have become in the chart above. The beginning of this year was like a different world.
Remember how poorly the market started out this year? It was one of the worst starts to a year in history. By February 11, the S&P 500 was down more than 10% for the year. But the funny thing is, this rally is still hated. The sentiment indicator from the American Association of Individual Investors shows that the number of bulls came in below average for a record 40th week in a row.
I’ll consolidate a great deal of market wisdom by telling you that the stock market likes to move at two speeds—fast/down and slow/up. Inexperienced investors are obsessed with the first speed. We pay attention to the second.
Interestingly, we had a good example of the fast/down speed after Brexit, but what inexperienced investors never seem to grasp is that by the time it’s clear what’s happening, it’s over. Consider that the S&P 500 is up nearly 10% from its post-Brexit low. Peter Lynch once said, “Far more money has been lost by investors preparing for corrections, or trying to anticipate corrections, than has been lost in corrections themselves.” That’s very true. Volatility will come back. Sometime. But don’t bother trying to predict when.
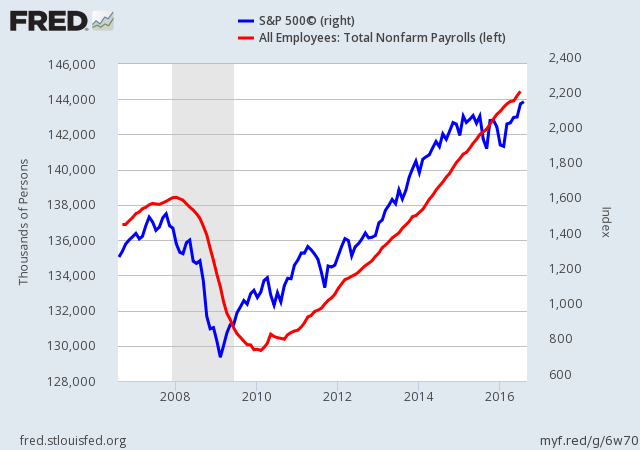
The U.S. Economy Created 255,000 Jobs Last Month
Last Friday, the government said that the U.S. economy created 255,000 net new jobs last month. That easily beat Wall Street’s forecast of 180,000. The numbers for May and June were revised higher as well.
When you smooth out all the bumps, we’ve been on a trend of creating about 220,000 to 230,000 jobs per month, and this report confirms that the trend is alive and well. That’s the red line in the chart below, with in the S&P 500 in blue. The unemployment rate stayed at 4.9%.
But what really caught my attention is that average hourly earnings rose by 0.3%. That’s not bad. This is a key number to watch, because the more folks make, the more they spend. Consumer spending is the main driver of the economy. We also want to pay attention to inflation. So far, inflation has been well contained, but that may be due to wage growth being sluggish.
For the first time in a while, I think the market is underestimating the odds of a Fed rate increase. This is a strange position for me to be in, since the markets and the Fed have consistently overestimated the timetable for rate hikes. If a robot endlessly said, “the rate-hike timetable will be pushed back,” it would look a lot more prescient than a lot of well-paid economists. Prices may start to creep higher, and that would get the Fed’s attention.
Right now, the futures market thinks there’s roughly a 50-50 chance of a rate hike coming at the Fed’s December meeting. Goldman Sachs recently said that the odds are 75%. I’m siding with Goldman on this. It’s not a lock-solid bet, but it is likely, especially if this jobs trend keeps up. If you recall, last December, the Fed raised rates for the first time in nearly a decade.
The final earnings numbers for Q2 are almost in. So far, 78% of companies in the S&P 500 have beaten their earnings expectations, while 56% have beaten on sales. Of our 16 Buy List stocks that have quarters ending in June, ten beat Wall Street’s estimate, three missed and another three matched estimates.
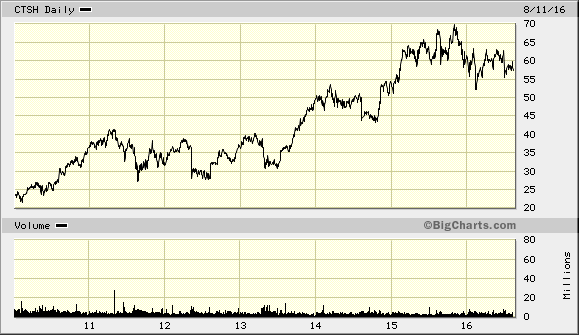
Cognizant Technology Solutions Is a Buy up to $63
Last Friday, Cognizant Technology Solutions (CTSH) became our final Buy List stock to report Q2 earnings. For the second three months of the year, the IT outsourcer earned 87 cents per share. That was five cents more than expectations. Quarterly revenue rose 9.2% to $3.37 billion, which matched consensus.
Overall, this was a good quarter for Cognizant. The company, however, was cautious about the rest of the year.
“Our second-quarter performance, as anticipated, represented broad-based revenue growth across service lines, geographies and industries, including healthcare and financial services,” said Francisco D’Souza, Chief Executive Officer. “While our revised guidance reflects the impact of near-term macroeconomic headwinds, our longer-term outlook and underlying business fundamentals remain strong. We continue to see an expanding market opportunity ahead and are well positioned to capitalize on the digital transformations taking place among enterprises around the world.”
“The shift to digital continues to intensify and accelerate,” said Gordon Coburn, President. “Our strong second-quarter revenue growth, adding incremental quarterly revenue of nearly $170 million, is the result of clients turning to Cognizant to help them define strategy and infuse new technologies to address key challenges and implement new business models. Our robust strategy and implementation capabilities have made us a key partner to clients as they fundamentally transform their businesses and navigate the shift to the digital economy.”
Gordon said that the pound’s fall post-Brexit knocked off about $40 million in revenue. He also noted that some major healthcare companies are holding back on spending, since they’re working through deals.
Cognizant sees Q3 coming in between 82 and 85 cents per share, whereas Wall Street had been expecting 86 cents per share. On the plus side, Cognizant reiterated their full-year guidance range of $3.32 to $3.44 per share.
On the revenue side, Cognizant sees Q3 ranging between $3.43 billion and $3.47 billion. Wall Street had been expecting $3.54 billion. The company also changed its full-year guidance range for revenue from $13.65 billion to $14.0 billion to $13.47 billion to $13.60 billion. Wall Street had been expecting $13.75 billion.
The stock had a frenetic day last Friday. Shortly after the open, CTSH dropped to a 3.2% loss for the day. Traders then did an about-face. By the afternoon, CTSH made up everything it had lost and peaked at a gain of 2.9%. Due to the conservative guidance, I’m going to lower our Buy Below on Cognizant to $63 per share. The company also added $1 billion to its stock-repurchase plan.
Earnings Preview for Ross Stores and Hormel Foods
Second-quarter earnings season is now over for our stocks on the March/June/September/December reporting cycle. However, we have three stocks that are one month off cycle; their quarters ended with July, and soon they’ll report earnings.
This Thursday, August 18, Ross Stores (ROST) will report its fiscal Q2 earnings after the market closes. When the last earnings report came out in May, the deep discounter said it expected Q2 earnings to range between 64 and 67 cents per share. Wall Street expects 67 cents per share. Ross also sees same-store sales rising by 1% to 2%. I think their guidance is quite conservative, and I expect to see an earnings beat.
I’ll be curious to see if Ross updates its full-year guidance, which is currently at $2.63 to $2.72 per share. I should add that Ross has been gobbling up tons of its own stocks. Ross pays a dividend, but it’s quite modest—just 13.5 cents per share, which works out to a yield of 0.87%.
Shares of ROST have rallied strongly over the last few weeks, and the stock hit another new all-time high on Thursday.
Hormel Foods (HRL) is also due to report its earnings on Thursday, August 18, but their report will come out before the opening bell. The Spam people said they expect full-year earnings between $1.56 and $1.60 per share. They’ve already made 83 cents per share for the first two quarters of the year.
One point of concern is Hormel’s shrinking margins. That caused the stock to get dinged hard earlier this year. Wall Street’s consensus for Hormel’s fiscal Q3 is for 35 cents per share, which is a 25% increase over last year.
HEICO (HEI), our quietest, smallest and best performer, is scheduled to report its fiscal Q3 earnings on Wednesday, August 24. I’ll have more details on HEI next week.
That’s all for now. There are a few key events to look out for next week. On Tuesday, the July CPI report comes out. Inflation has been rather subdued, but with some modest gains in wages, there soon could be a rise in consumer prices. I don’t think it’s likely, but we need to keep an eye the data. On Wednesday, the Fed will release the minutes from its last meeting. This is when the Fed said, “Near-term risks to the economic outlook have diminished.” I’ll be curious to hear more details. Be sure to keep checking the blog for daily updates. I’ll have more market analysis for you in the next issue of CWS Market Review!
– Eddy
-
Morning News: August 12, 2016
Posted by Eddy Elfenbein on August 12th, 2016 at 7:05 amStocks Hit New Highs, and That Could Be Just the Start
IMF Deal Boosts Egypt, Saudi Falls Despite Reform News
German Economy Grows Faster Than Expected; Italy Disappoints
Economic Doldrums? China Blames it on the Rain
EU Opens Antitrust Probe on Dow Chemical, DuPont Merger
Envisioning Bitcoin’s Technology at the Heart of Global Finance
Will Jet.com Be Enough to Move the Needle for Wal-Mart Stores Inc?
Hewlett Packard Enterprise Just Spent Millions on This Supercomputer Maker
Toshiba Reports Its First Profit in 6 Quarters
Macy’s, Kohl’s and Nordstrom’s 2Q 2016 Earnings Reports Deliver Some Positive Surprises
Electronic Marlboro Sucks Japanese Smokers Away From Japan Tobacco
Arianna Huffington to Leave the Huffington Post
Driven to Suicide by an ‘Inhuman and Unnatural’ Pressure to Sell
Josh Brown: Reaction: Jesse Livermore – Boy Plunger
Roger Nusbaum: This Is The New Normal
Be sure to follow me on Twitter.
-
Morning News: August 11, 2016
Posted by Eddy Elfenbein on August 11th, 2016 at 7:12 amMore Old Than Young: A Population Plague Spreads Around the Globe
IMF, Egypt Agree on $12 Billion Loan to Fix Ailing Economy
Australia Risks Chinese Anger Over Power Grid Sale
U.S. Budget Deficit Little Changed in July
The Bond Bubble Is About to Burst
Why the Big Three Airlines Are So Much the Same
Alphabet Unit Google’s VC Chief Bill Maris to Exit
Alibaba Results Boosted by More Users, Mobile Growth
Yelp Rises After Earnings Beat Estimates, Analysts Back Stock
Shake Shack’s Stock Gets Whacked As Investors React To Disappointing Sales
Ralph Lauren Is Losing the Battle for America’s Preppies
Valeant Under Criminal Investigation
Howard Lindzon: The NASDAQ Made America Great Again…
Josh Brown: Volatility Drives Us Mad and Steals Our Future
Be sure to follow me on Twitter.
-
Oil and Stocks Part Ways
Posted by Eddy Elfenbein on August 10th, 2016 at 11:30 amOne of the interesting developments this summer is that the previous relationship between oil and stocks seems to have broken down. For several months, the two asset classes were like waltzing partners. Wherever oil went, stocks weren’t far behind. Or maybe it was the other way around.
Either way, the relationship appeared solid. Even when both markets turned in early February, they turned together.
Lately, however, the two seem to have parted ways. It’s hard to place an exact starting point when this happened. I think something clearly broke down at the beginning of May. But by July, oil and stocks were no longer speaking.
According to the WSJ, the correlation fell to 0.77 although I’m not sure what time frame their figure indicates.
What does this all mean? That’s hard to say exactly. I think we’ve moved into an era where low oil prices are good — that is, until they’re not. There’s probably a point at which low oil is a net negative for the U.S. economy. I suspect that’s below $40 per barrel but that’s just a guess.
OPEC has noticed the lower price for oil and they’re going to hold a less-formal meeting next month. I strongly doubt they’ll come to any agreement on holding back production. The Iranians are recently off sanctions and they’re going to gun supply until they get back to pre-sanctions levels. The Saudis also don’t seem interested in cutting back production. My guess is that we’re going to see more downward pressure on oil this year.
-
Archives
- July 2026
- June 2026
- May 2026
- April 2026
- March 2026
- February 2026
- January 2026
- December 2025
- November 2025
- October 2025
- September 2025
- August 2025
- July 2025
- June 2025
- May 2025
- April 2025
- March 2025
- February 2025
- January 2025
- December 2024
- November 2024
- October 2024
- September 2024
- August 2024
- July 2024
- June 2024
- May 2024
- April 2024
- March 2024
- February 2024
- January 2024
- December 2023
- November 2023
- October 2023
- September 2023
- August 2023
- July 2023
- June 2023
- May 2023
- April 2023
- March 2023
- February 2023
- January 2023
- December 2022
- November 2022
- October 2022
- September 2022
- August 2022
- July 2022
- June 2022
- May 2022
- April 2022
- March 2022
- February 2022
- January 2022
- December 2021
- November 2021
- October 2021
- September 2021
- August 2021
- July 2021
- June 2021
- May 2021
- April 2021
- March 2021
- February 2021
- January 2021
- December 2020
- November 2020
- October 2020
- September 2020
- August 2020
- July 2020
- June 2020
- May 2020
- April 2020
- March 2020
- February 2020
- January 2020
- December 2019
- November 2019
- October 2019
- September 2019
- August 2019
- July 2019
- June 2019
- May 2019
- April 2019
- March 2019
- February 2019
- January 2019
- December 2018
- November 2018
- October 2018
- September 2018
- August 2018
- July 2018
- June 2018
- May 2018
- April 2018
- March 2018
- February 2018
- January 2018
- December 2017
- November 2017
- October 2017
- September 2017
- August 2017
- July 2017
- June 2017
- May 2017
- April 2017
- March 2017
- February 2017
- January 2017
- December 2016
- November 2016
- October 2016
- September 2016
- August 2016
- July 2016
- June 2016
- May 2016
- April 2016
- March 2016
- February 2016
- January 2016
- December 2015
- November 2015
- October 2015
- September 2015
- August 2015
- July 2015
- June 2015
- May 2015
- April 2015
- March 2015
- February 2015
- January 2015
- December 2014
- November 2014
- October 2014
- September 2014
- August 2014
- July 2014
- June 2014
- May 2014
- April 2014
- March 2014
- February 2014
- January 2014
- December 2013
- November 2013
- October 2013
- September 2013
- August 2013
- July 2013
- June 2013
- May 2013
- April 2013
- March 2013
- February 2013
- January 2013
- December 2012
- November 2012
- October 2012
- September 2012
- August 2012
- July 2012
- June 2012
- May 2012
- April 2012
- March 2012
- February 2012
- January 2012
- December 2011
- November 2011
- October 2011
- September 2011
- August 2011
- July 2011
- June 2011
- May 2011
- April 2011
- March 2011
- February 2011
- January 2011
- December 2010
- November 2010
- October 2010
- September 2010
- August 2010
- July 2010
- June 2010
- May 2010
- April 2010
- March 2010
- February 2010
- January 2010
- December 2009
- November 2009
- October 2009
- September 2009
- August 2009
- July 2009
- June 2009
- May 2009
- April 2009
- March 2009
- February 2009
- January 2009
- December 2008
- November 2008
- October 2008
- September 2008
- August 2008
- July 2008
- June 2008
- May 2008
- April 2008
- March 2008
- February 2008
- January 2008
- December 2007
- November 2007
- October 2007
- September 2007
- August 2007
- July 2007
- June 2007
- May 2007
- April 2007
- March 2007
- February 2007
- January 2007
- December 2006
- November 2006
- October 2006
- September 2006
- August 2006
- July 2006
- June 2006
- May 2006
- April 2006
- March 2006
- February 2006
- January 2006
- December 2005
- November 2005
- October 2005
- September 2005
- August 2005
- July 2005
 Eddy Elfenbein is a Washington, DC-based speaker, portfolio manager and editor of the blog Crossing Wall Street. His