-
Morning News: October 6, 2015
Posted by Eddy Elfenbein on October 6th, 2015 at 7:04 amEU Court Says Data-Transfer Pact With U.S. Violates Privacy
German Factory Orders Unexpectedly Fall Amid Economic Risks
Central Banks Lose Bond-Market Credibility as Woes Mount
2,000% Drug Price Surge Is a Side Effect of FDA Safety Program
VW to Delay, Cancel Non-Essential Investments Due to Scandal
SABMiller Said to Have Rejected Informal Offer From AB InBev
PepsiCo Earnings Beat Forecasts
Record ATM Fees Rise Toward $5
Jack Dorsey’s Twitter Return Raises Concerns Over Focus on Square
BP’s Record Oil Spill Settlement Rises to More Than $20 Billion
Interim DuPont CEO Promises Cuts
Fortune 500 Firms Hold $2.1 Trillion Overseas to Avoid Taxes
Shell Sees Signs of Oil Recovery Though `Rebalance’ to Take Time
Cullen Roche: What If Everyone Indexed?
Jeff Carter: A Textbook Case on Organized Internet Lynching
Be sure to follow me on Twitter.
-
VIX = 19.54; “All Clear!”
Posted by Eddy Elfenbein on October 5th, 2015 at 5:39 pmThis was an impressive day for Wall Street. Stocks opened higher and they kept rallying into the closing bell. The S&P 500 finished trading at 1,987.05, perhaps a nod to events 28 years ago this month. Since Friday’s low, the index is up 93 points.
Perhaps the best news is that the VIX closed at 19.54, which triggered my “all clear” warning. That doesn’t mean the market is about to surge higher, but it probably signals that the elevated volatility is behind us.
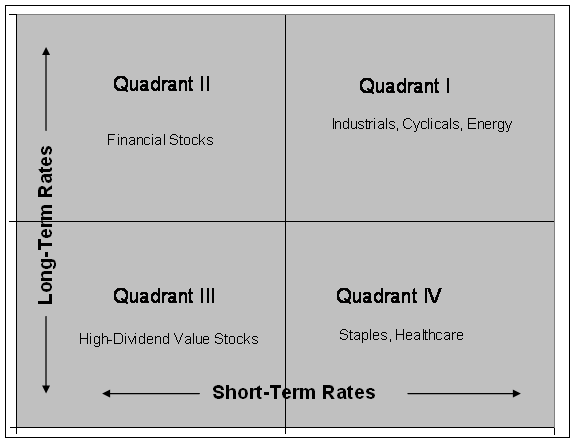
Today was a heavily cyclical day. For example, Wabtec (WAB) was up more than 4% today. Moog (MOG-A) also did well.
Students of the Elfenbein Theory will recognize today as a classic Quadrant 1 day.
-
Five Straight Days, Longest Win Streak All Year
Posted by Eddy Elfenbein on October 5th, 2015 at 12:28 pmThe stock market is looking very good so far today. But with our recent reversals, I don’t want to say anything is locked-in until the closing bell rings.
This looks to be our fifth up day in a row which is the longest streak this year. The S&P 500 has been as high as 1,977 today which is more than 100 points above last Tuesday’s low. That’s a huge turnaround. All sectors but Healthcare are up today. The Cyclicals are leading the way. One of our favorite Consumer Staples, Hormel Foods (HRL), just touched a new 52-week high.
One of the few things that’s down today is the VIX. It’s currently just below 20, and it has a good chance of closing there today. That’s been my trigger for our “all clear” signal. The VIX has been above 20 for the last 30 days which is the longest streak since early 2012.
Wall Street is still adjusting to the bad jobs report on Friday. The futures market has almost completely walked away from the idea of the Fed raising rates this year. The futures now see one rate hike in March, and another one late next year. Just a few days ago, the six month Treasury was near 0.3%. Today, it’s below 0.05%. This has been a major change in the market’s outlook.
-
Morning News: October 5, 2015
Posted by Eddy Elfenbein on October 5th, 2015 at 7:10 amStocks Rise As Investors See Fed Delaying Hike
World Bank: Less Than 10% Of The World Will Be Poor This Year
India Agrees to Fast-Track German Business Deals
U.K. Services Downturn May Keep BOE Cautious on Interest Rates
As Pacific Trade Negotiators Haggle, U.S. Officials Remain Hopeful
It’s Turning Into a Brutal Game of Survivor for ETFs
Bernanke: More Execs Should Have Gone to Jail After Financial Crisis
Glencore Follows Hong Kong Rally With Jump in London Trading
Activist Firm Trian Makes a Big Bet on GE
Potash Corp. Withdraws $8.8 Billion Offer for German Rival K+S
American Apparel Files for Bankruptcy Protection After Losses
Legal Troubles, Market Realities Threaten Uber’s Global Push
Saudi Aramco Cuts Crude to Asia, U.S. Amid Weak Demand
Joshua Brown: The Speculative Urge is Connected to Sporadic Reinforcement
Jeff Miller: What Is Behind the Recent Market Volatility?
Be sure to follow me on Twitter.
-
S&P 500 Sector Correlation
Posted by Eddy Elfenbein on October 3rd, 2015 at 10:03 amHere’s a bit of a wonky post, and I should give due warning to any math-phobes out there.
The S&P 500 has ten sectors. I took the ten sector indexes for this year and divided each one by the S&P 500. I took the results and calculated the correlation each one has to all the others.
To reiterate, I only used the data for this year, and this is the correlation of the relative strength of the indexes, not the indexes themselves.
Here are the results:
Sector Energy Discr. Staples Finan Health Indust. Tech Materials Telecom Utes Energy -86.0% -41.5% -64.6% -72.3% 81.5% -40.2% 92.6% 58.8% 18.7% Discr. -86.0% 12.9% 46.7% 70.4% -84.2% 46.3% -81.1% -58.5% -51.0% Staples -41.5% 12.9% 10.4% -6.1% -11.3% -13.7% -55.2% 2.5% 69.4% Finan. -64.6% 46.7% 10.4% 60.2% -68.4% 0.7% -58.0% -57.0% -24.9% Health -72.3% 70.4% -6.1% 60.2% -83.5% 10.9% -64.7% -72.3% -49.4% Indust. 81.5% -84.2% -11.3% -68.4% -83.5% -34.9% 81.7% 68.2% 46.0% Tech -40.2% 46.3% -13.7% 0.7% 10.9% -34.9% -30.7% -25.3% -40.5% Materials 92.6% -81.1% -55.2% -58.0% -64.7% 81.7% -30.7% 57.1% 2.8% Telecom 58.8% -58.5% 2.5% -57.0% -72.3% 68.2% -25.3% 57.1% 46.0% Utes 18.7% -51.0% 69.4% -24.9% -49.4% 46.0% -40.5% 2.8% 46.0% We see a number of clusters. Notice how the Industrials, Energy and Materials sectors hang together with Telecom nearby. That’s our Cyclical cluster.
Also, Healthcare and Consumer Discretionary are clearly related with Finance as a not-too-distant cousin. These are Defensive stocks. Notice also how the Cyclical sectors and Defensive sectors are negatively correlated with one other. The market leans toward one or the other, but not both.
Consumer Staples and Utility stocks form a third cluster. This is a little surprising. I would have expected Staples and Healthcare to be closer together, but that’s not been the case this year. I’d normally call these Income stocks, but that may not be the best name this year. Within this group, the Staples have a very slight relationship with Defensive stocks while the Utes have a distant correlation with the Cyclicals.
The Tech sector is interesting because it’s an island to itself. Tech isn’t strongly correlated with any sector. Nor is it negatively correlated with anyone. It’s almost as if Tech is an entirely different asset class. Tech does have a passing relationship with Consumer Discretionary, but not with the other Defensive sectors.
There’s some blurring and overlap with these categories so I urge you not to be overly mechanistic with this data. Correlations come and go. I also have some issues with the categories. For example, Visa is considered a tech stock. The Biotechs are under Healthcare but as their name suggests, they’re really both Healthcare and Tech. I’m sure some Biotechs are more correlated with Internet stocks than with J&J. The REITs are included with Finance. Next year, S&P 500 plans to spin REITs out as an eleventh category. That’s a good idea. They behave much more like Utilities than they do large banks. (Did you know Weyerhaeuser is technically a REIT?)
Huge Reversal Today
Posted by Eddy Elfenbein on October 2nd, 2015 at 4:14 pmThe stock market opened much lower today, but it rallied strongly throughout the day.
From bottom to top, the S&P 500 gained 57.66 points or 3%. The index closed today at 1,951.36. This was the market’s fourth up day in a row.
22 Straight Quarters of Higher Dividends
Posted by Eddy Elfenbein on October 2nd, 2015 at 10:41 amDividends continued to grow last quarter, at least on a per-share basis. In Q3, the S&P 500 paid out $10.79 per share in dividends. That’s the index-adjusted figure (every $1 in the S&P 500 is worth about $8.81 billion).
Dividends increased last quarter for the 22nd quarter in a row. The rate of increase, however, slowed to 7.67%. That’s the second-slowest rate in the last 19 quarters. The only reason Q4 of 2013 was lower was due to unusually high comps caused by the new tax law. In Q4 2012, companies paid out lots of divs to take advantage of the lower rate.
As I’ve noted before, this bull market has been one of dividends as much as it’s been one of stocks. What’s interesting is how closely the S&P 500 has tacked a 2% dividend yield over the last few years.
Check out the chart below. This shows the S&P 500 in blue and it follows the left scale. The trailing four-quarter dividends are in black and they follow the right scale. I scaled the two lines at a ratio of 50-to-1. In other words, whenever the lines cross, the index’s dividend yield is exactly 2%.
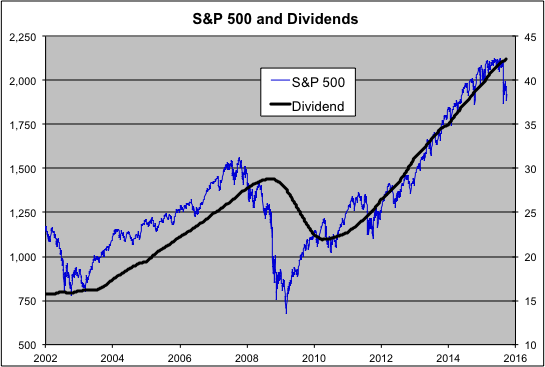
A few items stand out. For one, notice how much more stable the black line is than the hectic blue line. From 2004 to 2007, the S&P 500 maintained a dividend around 1.8%. Then everything fell apart during the financial crisis. But stock prices fell far more than dividends. Notice how the blue line tends to move, up or down, before the black lines. By Q2 2010, dividends started to rise again.
Once the dividend trend got going, stock prices largely kept pace with dividends. That’s one of the reasons why I’ve been reluctant to say that this market is a bubble despite many voices insisting that it is.
The S&P 500 will probably pay out $43 per share in dividends this year. That’s a 90% increase from what was paid out in 2010.
Thanks to the market’s recent dip and higher dividends, the S&P 500 paid yielded 2.21% on a trailing four-quarter basis. That’s the highest in four years. To get a 2% dividend yield, the index would have to rally to 2,125. That’s about a 10% leap from where we are now.
Terrible Jobs Report for September
Posted by Eddy Elfenbein on October 2nd, 2015 at 10:26 amThe U.S. economy created only 142,000 net new jobs last month. That’s a big miss. Wall Street had been expecting 200,000 jobs. Plus, the numbers for July and August were revised lower.
We’ve had weak reports before, like in March of this year. Also, the non-farm payrolls reports have a wide error range.
The unemployment rate stayed at 5.1%. Looking at the decimals, the unemployment rate came very close to rounding down to 5%. The economy only needed to create 400 more jobs for that to happen. We now have the lowest unemployment rate since April 2008. The unemployment rate is lower now than at anytime between 1974 and 1988.
CWS Market Review – October 2, 2015
Posted by Eddy Elfenbein on October 2nd, 2015 at 7:08 am“In a roaring bull market, knowledge is superfluous and experience is a handicap.” – Benjamin Graham
The third quarter has mercifully come to an end. Ye shall not be missed. This was the worst quarter for Wall Street in four years. All told, the S&P 500 lost 6.94% in Q3.
But here’s an interesting fact: The market’s pain was overwhelmingly concentrated within a four-session span that ranged from August 20 to August 25. In fact, if we isolate just two of those days, Friday, August 21 and Monday, August 24, the S&P 500 lost 7.00%. In other words, outside those two successive days, the market was up by a teeny bit last quarter.
Naturally, you could say this is cherry-picking the data, and to some degree, that’s correct. But it highlights an important point I often stress to investors: selloffs are quick and sharp while recoveries are slow and steady. In fact, sell-offs are often mostly over at just about the time people are wondering if we’re in one.
That was certainly true this week. Billionaire Carl Icahn made headlines by saying that the stock market is in “dangerous territory.” (Icahn outlined his thoughts in a video entitled “Danger Ahead.”) Of course, his warning comes more than a month after the market’s August turbulence and more than four months after the market’s May peak. Investing is the one area of human activity where people are unnerved by lower prices.
In this week’s CWS Market Review, we’ll take a closer look at our Buy List’s performance so far. The bad news is that we’re down for the year. The good news is that we’re not as down as much as everyone else. Of course, being a bit less bad than everybody else will get you far on Wall Street. We also had a blow-out sales report from Ford Motor (F). The automaker just registered its best September in eleven years. I’ll also explain why the market’s recent “retest” was so unbalanced. But first, let’s see how well our Buy List has fared this year.
Three Quarters Down, and We’re Beating the Market
On Wednesday, September 30, the S&P 500 closed at 1,920.03. That gave the index a YTD loss of 6.74%. If you add in dividends, the index was down 5.29%.
The 21 stocks on our Buy List finished the third quarter with a YTD loss of 2.22%. Once you include dividends, the loss was 1.37%, so we’re running about 4% ahead of the overall market. For tracking purposes, I assume the Buy List is a $1 million portfolio at the start of the year. The portfolio is divided equally among the 20 stocks, so we start with $50,000 in each position. The Buy List now includes 21 stocks as a result of eBay’s spinning off of PayPal.
As always, the rules of the Buy List forbid me from making any changes during the year. Each December, I announce our portfolio changes and we have five new buys and five sells. (This December, there will be six sells due to PayPal). After that, the Buy List is locked and sealed for the next 12 months.
We had a nice run of beating the S&P 500 for seven years in a row until we lost to the market last year. (It was close: 13.69% to 11.80%.) Fortunately, we’re back to our market-beating ways in 2015.
This is the tenth year for the Buy List. If you were to group all 9.75 years together, our Buy List has gained 147.84% to the S&P 500’s 89.10%. Basically, we turned every $2 into $5. Bear in mind, we did this with very little trading.
(Side note: When I give the performance of the long-term Buy List, I calculate it by assuming annual rebalancing. I realize that very few investors do this, nor is it necessary. But I believe it’s the fairest way to state our long-term results.)
At the end of three quarters, our best-performing stock is Fiserv (FISV), with a 22% gain. This quiet stock just goes up and up. In second place is one of our new additions this year, Hormel Foods (HRL), with a 21.5% gain. The Spam company has held up quite well recently. That’s what I like about consumer staples. When times get rough, people cut back on luxuries but not on things like Dinty Moore (yep, a Hormel brand).
The also-rans of this year’s Buy List are dominated by four underachievers: Oracle (ORCL), Qualcomm (QCOM), Bed Bath & Beyond (BBBY) and Moog (MOG-A). Oracle was down 19.7% at the end of Q3, while the other three were all down by more than 25%.
This highlights another important fact of investing. Your worst positions will often be down more than your best positions are up. Not always, but it’s true often enough. Remarkably, 15 of our 21 stocks have outperformed the market this year. The problem is that the duds really weigh down our performance. That’s why diversification is so important. Investors should always make sure their portfolios are broadly diversified. Now let’s turn to one of our more frustrating stocks, but one I still like.
Ford’s Best September in Eleven Years
Beleaguered Ford Motors (F) finally got some good news this week. Ford reported sales growth of 23% last month. That’s a very good number. Wall Street had been expecting 19%. With interest rates low and gas prices down, buying and driving a new car isn’t much of an obstacle for many Americans.
Sales of Ford’s F-Series pickups were up 16%, and their SUV’s did especially well. Commercial-van sales were up 86%. This was their best month in 29 years. These numbers suggest that Ford closed Q3 on a strong note. The automaker had a very good report for Q2, beating the Street by 10 cents per share, but that hasn’t helped the stock.

Shares of Ford have been rocked back and forth ever since the market broke down in late August. The stock briefly dripped below $13 per share before rallying to nearly $15 two weeks ago. It dropped back again to $13 per share earlier this week. There’s also the looming threat of a strike at an F-150 plant in Kansas City. Don’t worry. I’m inclined to believe some agreement will be reached before Sunday’s deadline.
I still like Ford a lot, and I’m surprised the shares are so low. The company has stood by its earnings forecast all year, and the dividend is sound. Ford remains an attractive buy up to $15 per share.
Wait Till the VIX Hits 20
A few weeks ago, I told you that the coast will be clear once the Volatility Index (^VIX) closes below 20. Since then, the VIX has come close a few times, but it hasn’t yet closed below that target. We can use that as a rough indicator for the market’s state of mind.
In last week’s CWS Market Review, I wrote, “I wouldn’t be surprised if the S&P 500 tries to ‘retest’ its low of 1,870.” That’s exactly what happened. This past Tuesday, the S&P 500 dropped down to an intra-day low of 1,871.9, which is less than five points above the intra-day low from August 24.
Technical analysts pay attention to when the market goes back to “test” its previous low points. The theory goes that if the test fails, you can expect the downtrend to continue. But if the old low holds, hat bodes well for the start of a new uptrend. So far, the old low has held. (So far.)
What’s interesting about this retest is how unbalanced it is. Let me explain. When the market gets nervous, investors run for cover in more stable stocks, and that generally means large-caps. As a result, the mammoth-cap stocks have not been the ones resetting their lows. Rather, it’s been the little guys. They’ve not only been testing the lows, the lows have been falling left and right. The small-cap Russell 2000 recently fell for eight days in a row.
Bloomberg notes that 42% of the stocks in the S&P 500 have slipped below their August 25 low. In fact, if we look at three Mongo-caps, ExxonMobil (XOM), Microsoft (MSFT) and Apple (AAPL), they’ve combined for nearly 20% of the index’s gain since the recent low. The S&P 500 Equal Weighted Index has already made a new low. In other words, for most stocks, the market’s correction is still going strong.
Is this a sign of more bad times to come? Will the big-caps finally give in? I can’t say for sure, but the good news is that we don’t need to worry about timing the market to do well. Instead, our strategy is to focus on strong companies that are going for good prices.
One of the stocks I like right now on our Buy List is AFLAC (AFL). The selling at Moog (MOG-A) has gotten to be a bit much. The stock is especially attractive below $55 per share. Again, I like Ford Motor (F). If you can get it below $14, you got a good deal. Now let’s look at some other Buy List stocks.
Buy List Updates
If you recall, Ball Corp. (BLL), one of our Buy List stocks, wants to take over Rexam. The problem is that the anti-trust authorities in Europe aren’t too wild about the idea. I can’t say that’s entirely surprising, since the companies are the #1 and #2 can-makers.
This week, the EU formally raised its objections to the deal. That’s actually good news because now Ball has something concrete to work with. They can alter the deal to meet the approval of regulators. Most likely, this means Ball will have to sell off some assets. Ball and Rexam have a deadline of December 9 to respond to the EU’s objections. Ball sounds very confident that the merger will eventually be approved. This will be a good deal for Ball.
I also want to lower my Buy Below prices for two of our stocks. The selling pressure has been rough this last month, and I want my Buy Below prices to reflect that. I’m lowering PayPal’s (PYPL) Buy Below to $34 per share. I’m also lowering Wabtec’s (WAB) to $95 per share. Last week, I said I especially like Wabtec when it’s below $90 per share.
Finally, let me note that Bank of America Merrill Lynch just upgraded Microsoft (MSFT) from underperform to neutral. They raised its target price from $39 to $47 per share. This stock is going for a good price.
That’s all for now. The big September jobs report is due out later today. Earnings season kicks off next week when Alcoa reports Q3 earnings on Thursday. None of our Buy List stocks report next week, but Wells Fargo (WFC) will be our first stock to report the following Wednesday, October 14. Seventeen of our stocks will report over the following three weeks. Also next week, the Fed will release the minutes of their last meeting. This was the controversial “no go” meeting. It will be interesting to hear what was discussed. Be sure to keep checking the blog for daily updates. I’ll have more market analysis for you in the next issue of CWS Market Review!
– Eddy
Morning News: October 2, 2015
Posted by Eddy Elfenbein on October 2nd, 2015 at 6:27 amECB President Mario Draghi Says Eurozone Returning to Growth After Policy Moves
Pacific Trade Ministers Vow to Reach Deal But Extra Time Needed
Global Stocks Rise Ahead of U.S. Jobs Report
Stocks Rally With Crude Before Payrolls as China Nerves Subside
Oil Rises as Russian Strikes in Syria Raise Middle East Tension
A Key Tenet of Janet Yellen’s ‘Lowflation’ Call Might Be Off the Mark
At Morgan Stanley, Clues on Succession
Sprint Expected to Cut Jobs, Up to $2.5 Billion in Costs
First Data to Raise Up to $3.7 Billion in IPO
United’s Chief Says Airline Must Improve
Chick-fil-A Brings Its Sandwich, and Its Values, to New York
U.A.W. Contract Vote at Fiat Chrysler Takes a Populist Tone
China Billionaire With Canal Dream Confronts Biggest Loss of ’15
Howard Lindzon: The Carl Icahn Bottom of 2015?
Roger Nusbaum: Say Goodbye to the 4% Rule?
Be sure to follow me on Twitter.
-
Archives
- June 2026
- May 2026
- April 2026
- March 2026
- February 2026
- January 2026
- December 2025
- November 2025
- October 2025
- September 2025
- August 2025
- July 2025
- June 2025
- May 2025
- April 2025
- March 2025
- February 2025
- January 2025
- December 2024
- November 2024
- October 2024
- September 2024
- August 2024
- July 2024
- June 2024
- May 2024
- April 2024
- March 2024
- February 2024
- January 2024
- December 2023
- November 2023
- October 2023
- September 2023
- August 2023
- July 2023
- June 2023
- May 2023
- April 2023
- March 2023
- February 2023
- January 2023
- December 2022
- November 2022
- October 2022
- September 2022
- August 2022
- July 2022
- June 2022
- May 2022
- April 2022
- March 2022
- February 2022
- January 2022
- December 2021
- November 2021
- October 2021
- September 2021
- August 2021
- July 2021
- June 2021
- May 2021
- April 2021
- March 2021
- February 2021
- January 2021
- December 2020
- November 2020
- October 2020
- September 2020
- August 2020
- July 2020
- June 2020
- May 2020
- April 2020
- March 2020
- February 2020
- January 2020
- December 2019
- November 2019
- October 2019
- September 2019
- August 2019
- July 2019
- June 2019
- May 2019
- April 2019
- March 2019
- February 2019
- January 2019
- December 2018
- November 2018
- October 2018
- September 2018
- August 2018
- July 2018
- June 2018
- May 2018
- April 2018
- March 2018
- February 2018
- January 2018
- December 2017
- November 2017
- October 2017
- September 2017
- August 2017
- July 2017
- June 2017
- May 2017
- April 2017
- March 2017
- February 2017
- January 2017
- December 2016
- November 2016
- October 2016
- September 2016
- August 2016
- July 2016
- June 2016
- May 2016
- April 2016
- March 2016
- February 2016
- January 2016
- December 2015
- November 2015
- October 2015
- September 2015
- August 2015
- July 2015
- June 2015
- May 2015
- April 2015
- March 2015
- February 2015
- January 2015
- December 2014
- November 2014
- October 2014
- September 2014
- August 2014
- July 2014
- June 2014
- May 2014
- April 2014
- March 2014
- February 2014
- January 2014
- December 2013
- November 2013
- October 2013
- September 2013
- August 2013
- July 2013
- June 2013
- May 2013
- April 2013
- March 2013
- February 2013
- January 2013
- December 2012
- November 2012
- October 2012
- September 2012
- August 2012
- July 2012
- June 2012
- May 2012
- April 2012
- March 2012
- February 2012
- January 2012
- December 2011
- November 2011
- October 2011
- September 2011
- August 2011
- July 2011
- June 2011
- May 2011
- April 2011
- March 2011
- February 2011
- January 2011
- December 2010
- November 2010
- October 2010
- September 2010
- August 2010
- July 2010
- June 2010
- May 2010
- April 2010
- March 2010
- February 2010
- January 2010
- December 2009
- November 2009
- October 2009
- September 2009
- August 2009
- July 2009
- June 2009
- May 2009
- April 2009
- March 2009
- February 2009
- January 2009
- December 2008
- November 2008
- October 2008
- September 2008
- August 2008
- July 2008
- June 2008
- May 2008
- April 2008
- March 2008
- February 2008
- January 2008
- December 2007
- November 2007
- October 2007
- September 2007
- August 2007
- July 2007
- June 2007
- May 2007
- April 2007
- March 2007
- February 2007
- January 2007
- December 2006
- November 2006
- October 2006
- September 2006
- August 2006
- July 2006
- June 2006
- May 2006
- April 2006
- March 2006
- February 2006
- January 2006
- December 2005
- November 2005
- October 2005
- September 2005
- August 2005
- July 2005
 Eddy Elfenbein is a Washington, DC-based speaker, portfolio manager and editor of the blog Crossing Wall Street. His