-
Barron’s: Wells Fargo Looks Cheap
Posted by Eddy Elfenbein on September 5th, 2015 at 2:09 pmIn this weekend’s Barron’s, Wells Fargo (WFC) is highlighted as a good buy right now:
Wells Fargo, in particular, is looking like a bargain now. The stock (WFC) has fallen 12% in the past month to a recent $51 versus an 8% drop for the S&P 500; it now offers a 3% dividend yield. It trades at 11.2 times next year’s expected earnings and is in a strong position to benefit from the growing U.S. economy and the improving housing market.
Wells Fargo could reach $63.56 if it traded at 14 times expected 2016 earnings, where some high-quality regional banks are currently trading. The bank has raised its dividend with the Fed’s blessing every year since 2010, and investors expect more of the same in the years ahead.
“We’re almost assured of continued dividend growth,” says longtime holder Hank Smith, chief investment officer at Haverford Trust. “They should be giving shareholders low-double-digit dividend growth over the next three to five years.”
Few companies have the kind of low-cost and low-risk funding stream of Wells Fargo, which can fund its entire loan book and then some with its $1.2 trillion worth of deposits, which cost the bank only eight cents for every $100 as of the end of the second quarter. Meanwhile, the bank’s $889 billion in loans yield an average of 4.2%.
The company generates about 55% of its income from its community banking division, serving households and small businesses; about 35% is a product of its wholesale banking unit, which mostly serves corporations and governments; and the bulk of the rest comes from its wealth management and brokerage businesses.
Wells Fargo doesn’t have large investment banking and trading desks like its peers which may hold down earnings growth in exuberant times but also gives the bank some unique advantages.
The simplicity of the bank’s business model is increasingly a benefit in an era of greater regulation, says Jason Clark, a portfolio manager at AFAM Capital, which holds the stock in client accounts. “Given all the oversight, it’s probably good that they’re not heavily dependent on investment banking,” he says.
-
August Jobs: +173,000, 5.1% Unemployment
Posted by Eddy Elfenbein on September 4th, 2015 at 8:32 amThe August jobs report is out. The economy created 173,000 net new jobs last month. That was below expectations of 220,000. But there were revisions of 44,000 for May and June. The unemployment rate declined to 5.1%. That’s the lowest since April 2008.
The unemployment rate is lower today than it was at any time from May 1974 to March 1997. Except for one month, March 1989.
-
CWS Market Review – September 4, 2015
Posted by Eddy Elfenbein on September 4th, 2015 at 7:10 am“The best time to invest is when you have money.” – John Templeton
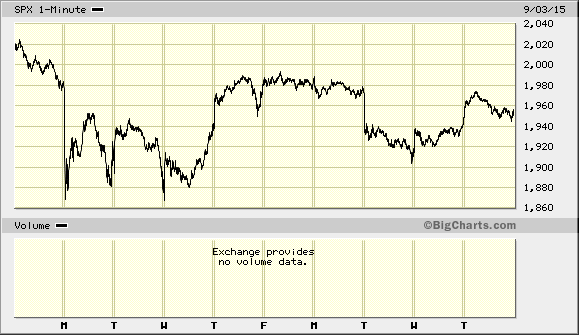
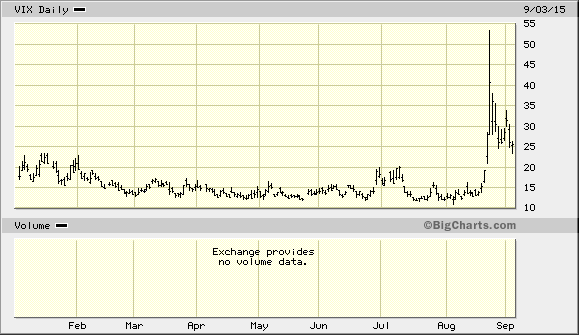
The late-summer squall on Wall Street is still with us. Once again, I want to caution you to expect more wild swings. We’re not out of this just yet. Since I last wrote you, the S&P 500 has jumped as high as 1,993 and as low as 1,903. Until the Volatility Index (^VIX) closes below 20, you can expect more of this.
The good news is that there’s been more good news, which confirms our hypothesis that this is a market event far more than it is an economic one. That’s not a guarantee that the market will bounce back, but it does increase the odds. Looking at the recent spate of positive economic data, this week’s Beige Book report from the Federal Reserve was quite good. Personal income and spending are also doing well. The August jobs report is due out later this morning, and I expect more steady gains (check the blog for the latest).
I’m also pleased that our Buy List, while down, has held up quite well versus the broader market. In fact, through Thursday, our Buy List is in the black for the year with a gain of 0.35%. Sure, that’s small, but it’s better than the S&P 500’s YTD loss of 5.23%. There’s no magic to what we’ve done. We’ve focused on top-quality stocks and held onto them during jittery markets. That’s why I want investors to keep their heads now and focus on bargains.
In this week’s CWS Market Review, I’ll take a much closer look at the positive economic news. The U.S. economy isn’t in great shape, but we’re far from heading off a cliff. Things are improving, just slowly. I’ll also run down some of my favorite bargains on our Buy List; plus I have four Buy Below price changes for you. But first, let’s look at the touch-and-go relationship between Wall Street and Main Street.
Don’t Worry about China or the Fed
The economy and the stock market have an uneasy relationship. They’re somewhere between distant cousins and frenemies, and it’s a big mistake to confuse them. There have been lots of times when the stock market has rallied while the economy has sputtered along. Or there have been times when the market has gotten rattled even though the economy kept on humming (think 1987).
The current correction, which is what Wall Street calls a 10% decline, is closer to the latter case—good economy, bad market. In fact, most of the factors weighing on the market are truly secondary to the economy. For example, the mess in China has spooked U.S.-based investors, but as James Surowiecki recently pointed out in the New Yorker, China’s not about to sink us.
Given how much we hear about China’s economic importance, you might think that these problems would have a big impact on the U.S. They won’t. In fact, total U.S. exports to China are just a hundred and sixty-five billion dollars, less than one per cent of G.D.P. There are certainly firms—including commodity producers, microchip makers, and fast-food companies—for which China is a huge market today. But for most firms the prospect of selling billions of products to Chinese consumers remains more of a promise than a reality. Goldman Sachs, for instance, estimates that just two per cent of the S. & P. 500’s revenues come from sales to China.
Or you may have heard that we’re going to be in big trouble once China starts dumping U.S. Treasury bonds. Please. I’ve heard about this for years, and it won’t happen in any serious way. Yes, China has pared back on its Treasuries, but that’s to support the yuan. If China tried to dump Treasuries, it would hurt China a lot more than it would hurt the U.S. The reason the U.S. has been able to sell so much debt to China is because, well, they want it to buy it.
The other concern, what the Federal Reserve will do with interest rates, only impacts the economy after a few rate increases. I still think the Fed will start raising rates later this month, but I’m hardly worried about it. The futures market thinks the Fed may wait some more. Since the start of September, the odds of a rate hike at this month’s meeting have dropped from 38% to 30%. I think the Fed has made it clear that they’re unmoved by the whelps of pain emanating from Wall Street. I can hardly blame them.
Last week, I noted that Q2 GDP growth was revised higher to 3.7%. We’re starting to get a look at numbers for Q3. This week’s ISM Manufacturing Index for August came in at 51.7. That’s the lowest in two years, but it’s still over 50 which indicates an expanding factory sector.
Last Friday, the Bureau of Economic Analysis released the personal income and spending reports for July. Personal income rose by 0.4%, and spending increased by 0.3%. Those are solid numbers. The Census Bureau said that construction spending rose by 0.7% in July. It’s always nice to see a rise here because it suggests more activity to come. Construction spending for May and June were revised higher as well.
On Wednesday, the Fed released its Beige Book report which is a survey of the Fed’s 12 districts. The report is a bit wonky, but it provides good insight on how well the economy is doing. Most of the districts reported improved economic activity, and they see things as continuing to get better. The report also noted that the real-estate market is improving across all 12 districts.
I’m writing this to you on Friday morning. Later today, we’ll get the jobs report for August. Frankly, the importance of the monthly jobs report has faded over the past few years. The reason is that the trend has been clear. For the last five years, non-farm payrolls have grown at a fairly steady rate (around 2%). The August report should show more of the same. I’ll be curious to see what the report says for average hourly earnings. Wage growth has been stuck near 2% for the last several years. I’d like to see some acceleration. Higher wages means wealthier customers.
In Europe, Mario Draghi strongly hinted that the ECB is ready to expand its bond-buying program. That gave a short-lived boost to our stock market. What’s interesting is how misaligned Europe and the U.S. are. While the Fed is poised to pull in the reins, the Europeans are stuck where Bernanke was a few years ago. The euro fell to a 12-year low against the dollar earlier this year. It’s recovered since then, but it may be ready to head down again. This is important because a stronger dollar puts pressure on commodity prices. You may recall how often I talked about the strong dollar trade. The ECB meets on Friday, and we’ll get to hear more on their plans.
Our Buy List Continues to Lead the Market
There hasn’t been much news about our Buy List stocks. Wait. Scratch that. There hasn’t been any news about our stocks. Personally, I’m fine with that. We own high-quality businesses, and they should be focused on sales and profits more than on a hyperactive stock market.
It’s worthwhile to take a look at how our Buy List has performed relative to the rest of the market over the past few weeks. When the market started to drop, our Buy List held up much better than the rest of Wall Street. That’s to be expected since investors naturally gravitate toward higher quality during rough patches. At the moment, a good rule of thumb for investors is that as long as the VIX closes above 20, the S&P 500 will remain volatile. This chart should give you an idea of how dramatic the VIX surge has been.
When the market bounced strongly on August 26 and 27, our Buy List lagged behind. That’s because fast money poured into stocks they thought could fly the furthest. That’s not our kind of stocks. That’s also why you can expect these mini-rallies to be strongly challenged by the bears.
Since then, our stocks have quietly outpaced the market. I don’t obsess over such a short term—remember that we haven’t had a single earnings report since Ross Stores (ROST)—but I wanted to give you an idea of what to expect with our stocks. I don’t get too excited when we beat the market in a given week. Nor do I get too down when we lag. As long as sales, earnings and dividends are growing, I feel fine.
Last week, I held off making any changes to our Buy List prices. I felt that the market was too volatile, and there were bound to be more wild swings. I still feel that way, but I want to add a few tweaks to our Buy Belows to give you a good sense of what’s a good entry point at the moment.
Four New Buy Below Prices
I’ve been struck by the decline in Signature Bank (SBNY). If you don’t own this bank, you ought to think about adding it. SBNY is a solid long-term position, and it’s nearly 16% off its high from six weeks ago. I almost feel like we’re in a secret club that knows about Signature while nobody else does. Signature has delivered record profits for the last 23 quarters in a row.
The bank finally got some media attention this week. There was a very nice article in the WSJ. Here’s a sample:
Recent results have been particularly strong: The bank’s loans and deposits both grew by more than 32% in 2014, compared with 4.2% loan growth and 4.6% deposit growth for similar banks, according to SNL Financial. The bank’s net interest margin, an important measure of lending profitability largely tied to interest rates, was higher than most of its peers at about 3.27% in the second quarter.
This week, I’m dropping my Buy Below on Signature by $17 to $139 per share.
On Tuesday, Ford Motor (F) reported its best sales for August in nine years. U.S. sales were up 5%. The F-Series totaled sales of 71,332. According to Morgan Stanley, the F-Series makes up 90% of Ford’s total profit. It’s been a year since Ford started its plan to change to aluminum-body pickups. There have been some missteps, but the overhaul is done and the company is starting to see the benefits. I’m going to lower my Buy Below on Ford Motor to $15 per share.
Wells Fargo (WFC) has also been unusually weak, even compared with the recent downturn. I think the stock is a good bargain here. I’m not alone. Sandler O’Neill just upgraded Wells to a Buy. They have a price target of $59 per share. I’m lowering my Buy Below on Wells Fargo to $56 per share.
Going by Thursday’s close, Microsoft (MSFT) yields 2.85%. But I expect the software giant to bump up its dividend soon. The quarterly payout is currently 31 cents per share. I think they’ll raise it to 34 cents, give or take. If 34 cents is right, that gives the stock an expected yield of 3.13%. I’m lowering my Buy Below on Microsoft to $47 per share.
That’s all for now. The stock market will be closed on Monday for Labor Day. In the U.S., the Labor Day weekend traditionally marks the end of summer, and trading volume typically picks up in September. Next Wednesday, we’ll get the report on jobs openings for July. Initial jobless claims will be on Thursday, and latest report on the budget deficit will be on Friday. Be sure to keep checking the blog for daily updates. I’ll have more market analysis for you in the next issue of CWS Market Review!
– Eddy
-
Morning News: September 4, 2015
Posted by Eddy Elfenbein on September 4th, 2015 at 7:06 amWhat Draghi Said on QE, Market Volatility, Greece
Putin Pitches for Foreign Investment in Russia’s Far East
The Fed’s Election-Defining Decision
The Jobs Report and the August Curse: Jobs Day Guide
Why the U.S. Gets the Most Out of Cheap Oil
Hedge Funds Faced a Test in August, and Faltered
Chinese Company to Buy Avolon in $7.6 Billion Deal
VW’s Unassuming CFO Emerges From Boardroom Wars as Chairman
General Mills to Sell Green Giant, Le Sueur for $765 Million
Man Asks Kickstarter for $20,000, Gets Over $9 Million
Japanese Banks Among Bidders for GE’s Local Finance Unit
How a Boeing Sales Flop Became the World’s Hottest Secondhand Jetliner
Philip Falcone, Former Head of Vast Fund, Tries a 3rd Act
Cullen Roche: Three Things I Think I Think – Crashing Up & Down Edition
Roger Nusbaum: Defensive Expectations
Be sure to follow me on Twitter.
-
A Little Context for NFP
Posted by Eddy Elfenbein on September 3rd, 2015 at 3:29 pmThe big August jobs report comes out tomorrow. This is a good example of where it pays to take a step back and look at the big picture.
The trend in non-farm payrolls has been perfectly clear for five years. Non-finance people would be amused to learn how much that red line is debated.
-
Morning News: September 3, 2015
Posted by Eddy Elfenbein on September 3rd, 2015 at 7:16 amECB to Cut Inflation Forecast But Keep Powder Dry
Xi Says China No Threat, Announces Military Cuts at Parade
Gross Says Fed Move May Be ‘Too Little Too Late’ Amid Turmoil
U.S. Treasury’s Lew Says China Will Be Held Accountable on Currency
U.S. Private Payrolls Rise Steadily; Productivity Revised Up
U.S. Productivity Increased at Fastest Pace Since 2013
U.S. Bank Earnings Up 7.3% in Second Quarter, FDIC Says
Those Inflation Targets Keep Getting Harder to Hit
Novartis to Begin Selling Copy of Amgen’s Neupogen in U.S.
Security Startup Tanium Said to Reach $3.5 Billion Valuation
With U.S. Factory and Boston Transit Deal, Inroad for Chinese Rail Firm
Spielberg’s DreamWorks Studio Expected to End Distribution Pact With Disney
Japan Display CEO Hints at Strong Apple Orders Ahead of New iPhone Launch
Jeff Carter: Are Market Black Swans Like Startup Unicorns?
Joshua Brown: When 499 of the S&P 500 Fall in a Day
Be sure to follow me on Twitter.
-
Morning News: September 2, 2015
Posted by Eddy Elfenbein on September 2nd, 2015 at 7:14 amU.S. Auto Sales Pace Accelerates
Australian Dollar Hits Six-Year Low on China
Putin’s Got a New Problem With China
Solar Win in Coal’s Back Yard Shows Cheap Way to Beat Blackouts
Welcome to Quantitative Tightening as $12 Trillion Reserves Fall
Boston Fed Chief Says Interest-Rate Hike Will Be Gradual
Citi Sells Hungary Consumer Banking Business to Erste Group
McDonald’s Planning to Start Selling All-Day Breakfast on Oct. 6
Lego First-Half Sales Growth Beats Rivals as Asia Drives Sales
Volkswagen Extends CEO Martin Winterkorn’s Contract
Klarna Powers Mobile Payments For Overstock.com in U.S. Push
Amgen to Help Develop Novartis’s Pipeline of Alzheimer’s Drugs
Dollar Tree Swings to a Loss After Deal for Family Dollar
Howard Lindzon: The ‘Gig’ Bear Market of 2015… and the Bull Market in Volatility of Volatility
Cullen Roche: The 1998 Playbook
Be sure to follow me on Twitter.
-
August was Good for Ford
Posted by Eddy Elfenbein on September 1st, 2015 at 2:59 pmFord‘s (F) sales in the U.S. rose 5.4% last month. The stock is down today but not as much as everything else.
Ford said its sales were driven by demand for new cars, sport-utility vehicles and trucks. Ford SUV sales were the strongest in 12 years in August, while the F-series truck brand logged its best sales month of the year with a 4.7% increase. In all, Ford sold 234,237 vehicles in August, well above the 225,834 that automotive information website Edmunds.com had forecast.
-
Bad Markets Cause Volatility, Not Vice Versa
Posted by Eddy Elfenbein on September 1st, 2015 at 12:22 pmToday, I wanted to talk about the stock market’s volatility which has received a lot of attention recently. Many investors misunderstand the character of volatility. The key fact to understand is that volatility is not a factor separate and apart from the market’s recent direction. Markets do not go down due to volatility. Rather, bad markets are the primary cause of volatility.
As I’ve explained before, movements in the stock market are generally not symmetrical. Bull markets tend to be long and slow while bear markets are short and quick. Even in secular bear markets, most of the pain is confined within a short period of time.
The single-best days of the market almost always come after the single-worst days. These spikes aren’t really bullish moves so much as they’re counter rallies in rough markets. In fact, when the market is at a new high, the daily movements are far more subdued than they are normally.
You’ll often see the VIX quoted which is the Volatility Index. For newer investors, let me explain what the VIX is. In the formula to calculate options prices, one of the variables is volatility. As a result, we can take the current options price and work backward to find the implied price of volatility. And just like everything else, volatility can be bought and sold.
Warning: Math Ahead
The VIX shows the one-month standard deviation for the S&P 500, but the number is annualized (don’t ask me why). To get that number to a monthly figure, just divide the VIX by 3.464. That’s the square root of 12. Fans of math will remember that the standard deviation rises by N^0.5.
The VIX closed yesterday at 28.43. That means traders see the S&P 500’s one standard deviation over the next month as being 8.2%.
For some context, the stock market has historically gained about 1/30 of 1% each trading day. The daily standard deviation is about 1%. That means that about 97% of each daily move is, on average, complete noise.
After one month, assuming 21 trading days, the market averages a gain of 0.7% with a plus/minus of about 5.5%. After a year, the market averages 8.4% with a standard deviation of 16%. Even after four years, the market’s average gain and standard deviation are equal at about 33%. In other words, it’s perfectly reasonable for the stock market to be in the red even after four years.
Of course, these numbers are merely explanatory. The market doesn’t move according to the bell curve, which furthers my point about volatility.
I took the last 25 years’ worth of data on the S&P 500 and VIX. I then compared the VIX to the S&P 500’s position versus its 52-week high. The relationship is very strong. The further below the 52-week high, the higher the VIX.
Here’s what my chart below means. When the market is at its 52-week high, the average VIX is 15.16. When it’s 0% to 1% below its 52-week high, the VIX averages 14.92. The bigger the fall, the higher the VIX.
 Eddy Elfenbein is a Washington, DC-based speaker, portfolio manager and editor of the blog Crossing Wall Street. His