-
10-Year TIPs Yield and Stock Returns
Posted by Eddy Elfenbein on August 14th, 2015 at 12:52 pmI’ve been crunching the numbers on stock returns and the 10-year TIPs yield.
Intuitively, this relationship makes sense. TIPs are a decent measure of expected bond values, so the lower their yields, the better the return ought to be for stocks.
One problem is that there’s not a lot of data. I went to FRED and took all 10-year TIPs data, which only goes back to 2003. I then compared it with the Wilshire 5,000 Total Return Index. I wish we had more data. In time, that will come.
I compared the TIPs yield on one day and with the equity return the following day. I divided the TIPs into eight different buckets. Here’s what I got, listed by ascending TIP yield.
TIPs Yield Days Annualized Return < -0.5 217 26.36% -0.5 to 0 172 25.21% 0 to 0.5 448 10.38% 0.5 to 1.0 347 15.47% 1.0 to 1.5 379 11.88% 1.5 to 2.0 807 7.20% 2.0 to 2.5 676 11.09% Over 2.5 105 -43.93% So when TIPs pay nothing, or less than nothing, people turn to stocks. When TIPs start offering a real alternative, stocks are abandoned. The TIPs tipping point seems to be at 2.43%. Above that, stocks turn negative.
These numbers are pretty impressive. As I said before, I’d like to see a lot more data but we just don’t have it yet. I’m also concerned that the disruptions caused by the financial crisis mucked up some the relationship. Still, over the long term, this should hold up. As always, the data will say.
When the 10-year TIPs is 1.63% or higher, the stock market is basically flat (about 0.57% per year, which is less than TIPs could have gotten you).
Industrial Production Rebounds
Posted by Eddy Elfenbein on August 14th, 2015 at 11:21 amAfter falling for five months in a row, industrial production has rebounded for two months in a row. IP rose by a healthy 0.6% in July.
Economists surveyed by The Wall Street Journal had expected a 0.4% increase in industrial production last month and capacity utilization of 78.0%.
Manufacturing output, which accounts for almost three-quarters of overall industrial production, rose 0.8% in July. The improvement was nearly entirely due to better automotive production. Auto and auto parts manufacturing increased 10.6%. Production elsewhere in manufacturing edged up just 0.1%.
CWS Market Review – August 14, 2015
Posted by Eddy Elfenbein on August 14th, 2015 at 7:08 am“Forecasts may tell you a great deal about the forecaster; they tell you nothing about the future.” – Warren Buffett
In the past few weeks, several concerns of investors have been resolved. The mess in Greece didn’t become a larger problem. The selloff in China hasn’t metastasized. At least, not yet. Second-quarter earnings were pretty good. The strong dollar did some damage but not as much as was feared.
Even worries about the Federal Reserve are beginning to subside. The Wall Street Journal surveyed several economists and found that 82% of them expect the Fed to raise rates next month. Only 13% expect the Fed to wait until December. It’s finally going to happen, and is the bond market scared? Not at all. Long-term rates have been falling.
Given the resolution of these previously uncertain issues, that leaves us with a fairly dull market. Fine by me! I like dull markets. In this issue, I’ll go into a little more detail on the market’s recent behavior and why higher rates are nothing to fear. I’ll also preview two Buy List earnings reports for next week. Later on, I’ll update you on two Buy List stocks that just announced big new share buybacks. But first, let’s look at the July jobs report.
Don’t Let Higher Rates Scare You out of Stocks
Last Friday, the government reported that the U.S. economy created 215,000 net new jobs in July. That was basically in line with what economists had been expecting. The unemployment rate stayed at 5.3%.
For me, the bigger news isn’t so much the jobs news as that it almost certainly confirms that the Fed is due to raise rates next month. Earlier, I cited the WSJ’s poll of economists. One caveat is that the September meeting will be followed by a press conference from Fed Chairwoman Janet Yellen. No press conference is scheduled for the October meeting. The assumption is that Yellen wants to raise rates in conjunction with a press conference. That makes sense, and it’s why only 3% of economists think the Fed will make a move in October.
This would be the first time in nine years that the Fed would raise rates. To borrow a phrase from the Harding administration, a rate increase will be an important step in our “return to normalcy.” Zero-percent rates and all the bond buying were emergency measures. That time has passed.
But I want to remind investors that a rate hike is by no means awful news for stocks. Let’s remember that short-term rates will still be quite low. In fact, they’ll still be below inflation, and they will most likely remain that way for quite some time.
From 2004 to 2006, the Federal Reserve raised interest rates by 0.25% at 17 consecutive meetings. Yet the stock market kept on rallying. Stocks rallied through higher rates in 1988-89, and again in 1999-2000. In the latter example, the market survived the first four 0.25% rate hikes. The fifth, however, was too much to bear; and for good measure, the Fed added a sixth increase, which was 0.5%. The market soon nosedived.
My point is that the beginning of a rate-hike cycle is nothing to fear. Investors should understand that this will alter some fundamentals of business. For example, yield spreads will narrow. What we need to be concerned with is the possible excesses of a tightening cycle. When that happens, short-term rates run 3% or 4% more than inflation. We’re a long way off from that happening.
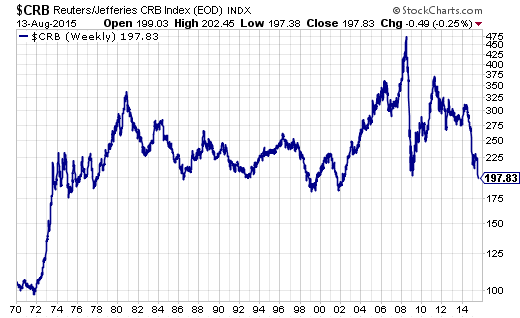
If anything, the commodity markets are working to hold down inflation. July was a terrible month for commodities. The CRB Index (see above) is toying with a 40-year low. Sugar, for example, is at a multi-year low. Oil prices are now at a six-year low. Yesterday, light sweet crude fell to $42.23 per barrel. That’s the lowest price since March 2009 when the bull market began. The rout may not be over. OPEC countries are continuing to pump out oil at a very rapid clip. The old cartel might be finished. Now let’s look at some earnings reports coming out next week.
Earnings Next Week from Hormel Foods and Ross Stores
We have two Buy List stocks that ended their quarters in July, Hormel Foods and Ross Stores. Both stocks are due to report earnings next week.
Hormel Foods (HRL) will report its fiscal third-quarter earnings before the opening bell on Wednesday, August 19. Hormel is shaping up to be one of our better stocks this year. Through Thursday, the shares are up 16.1% YTD. I always enjoy watching these humdrum stocks thrive.
There had been concerns that avian flu would ding Hormel’s earnings. The company conceded that it was a problem, but the damage was limited. I like hearing companies give us bad news straight. For fiscal Q2, Hormel made 67 cents per share which was four cents better than estimates. For now, the company is sticking by its full-year EPS forecast of $2.50 to $2.60 per share. I think they can hit it.
Wall Street expects fiscal Q3 earnings of 55 cents per share. My numbers say that’s about right. Don’t expect a big earnings beat here. Last week, the shares touched a new 52-week high of $61.32. This is a solid, long-term investment.
In the last year, Ross Stores (ROST) has been a huge winner for us. From July 16, 2014 to Thursday’s close, the deep discounter’s stock is up more than 70%.
I was a little concerned about Ross’s latest guidance. The company said it expects earnings to range between $1.19 and $1.24 per share. Frankly, I think they’re low-balling us. I know Ross likes to do that, and naturally, we know how this game is played.
Perhaps as much as earnings, I want to see same-store sales. This is huge for all retailers. In their last report, Ross had same-store sales growth of 5%. But they told us to expect 2% to 3% growth for this coming report. Incidentally, the Commerce Department released a good retail-sales report this week. For July, retail sales rose by 0.6%. The report for June was revised higher from a 0.3% drop to flat. This may bode well for Ross’s earnings.
Shares of Ross split 2-for-1 in June, and the stock has continued to climb higher. Last Thursday, Ross broke $55 per share for the first time. For now, I’m going to keep our Buy Below at $52 per share. I’ll also certainly raise it next week, but I want to see their numbers first.
Buy List Bargains and Additional Updates
Periodically, I like to highlight some of our Buy List stocks that look especially attractive at the moment. Bear in mind that I consider any Buy List stock that’s below its Buy Below price to be a buy.
Last month, I mentioned that Bed Bath & Beyond (BBBY) is cheap below $65 per share. But that’s a more speculative buy. The shares have performed terribly since April. I think the selling is overdone.
Microsoft (MSFT) continues to be a good buy here. I thought the last earnings report was quite good, but the stock hasn’t done much. My Buy Below is at $49, but if it you can get it below $46, you got a good deal. The current yield is 2.65%.
I also like Signature Bank (SBNY) below $142. The bank had another solid earnings report, but the shares dropped nearly 12% from the July high to the August low. Take advantage of any pullback.
By the way, the only three stocks that have been Buy List members all ten years are AFLAC, Bed Bath & Beyond and Fiserv (FISV). Since the Buy List started in 2006, Fiserv has gained 312% for us. On Thursday, it made another new high.
I also wanted to pass along a few updates to some other Buy List stocks.
This week, Moog (MOG-A) announced that it’s expanding its share-buyback program by four million shares. Their original program authorized them to repurchase nine million shares of their stock. They had already plowed through 8.3 million. The total is now being expanded to 4.7 million.
“Our cash flow has been strong over the last few years,” said John Scannell, Chairman and CEO. “This has afforded us the opportunity to return nearly $600 million of value to our shareholders in the form of a share-repurchase program that we initiated in early 2014. We are pleased to have the flexibility to continue this program.”
Moog had a good earnings report recently. They earned $1.05 per share for their fiscal third quarter, 11 cents better than estimates. Unfortunately, the company lowered its full-year forecast for the third time. Moog now expects full-year earnings of $3.50 per share.
The good news is that Moog said it expects to make $4 per share next fiscal year (ending September 2015). That’s impressive, and I didn’t see it coming. It’s no secret that I haven’t been impressed with Moog this year, but the new guidance and expanded share buyback are positive signs. I’m keeping my Buy Below on Moog at $72 per share.
AFLAC (AFL) also announced a big share buyback. Let me add that one of my criticisms of share buybacks is that it too easily lets companies put out feel-good press releases. But when high-quality companies like Moog or AFLAC do it, I don’t feel quite so manipulated. These companies have the cash flow to back it up.
AFLAC said it´s adding 40 million shares to its current program, which is down to a puny 16 million. This means the company plans to buy back 56 million shares, which is about 13% of the outstanding stock. That’s a nice chunk of change.
Commenting on the news, Chairman and Chief Executive Officer Daniel P. Amos stated: “I am very pleased with this action by our board of directors. Whether we’re talking about our operations in Japan or the U.S., as an insurance company, our primary mission is to fulfill our obligations to our policyholders. At the same time, we are listening to our shareholders and understand the importance of capital deployment. In our second quarter of 2015 earnings release, we reinforced our plan to repurchase $1.3 billion of our common stock in 2015 and believe that over the next few years, we’ll be able to increase the capital available for deployment.”
AFLAC had a good earnings report for Q2, plus they raised guidance. The stock has finally woken up from its long slumber. On Monday, AFL closed at $64.92 per share which is its highest close in 17 months.
Speaking of all these buybacks, on Wednesday, the S&P 500 had its biggest intra-day turnaround in three years. What caused all the buying? Apparently, companies were in on it. Goldman Sachs said that they had their busiest day since 2011 buying back shares for their corporate clients. Since the bull market began, companies have bought back more than $2 trillion worth of stock.
When PayPal (PYPL) split off from eBay, I set our initial Buy Below at $42 per share. I wanted to give the Buy Below a little “air,” just in case the shares popped after the spin-off, and that’s pretty much what happened on the first day. Now that a little time has passed, I want to lower our Buy Below on PayPal to $40 per share. Don’t misunderstand me—I like PYPL a lot. I’m just reeling in our Buy Below.
That’s all for now. Next week, the Fed will release the minutes of their most recent meeting. I think the evidence is clear that a rate hike is on its way. On Wednesday, the July CPI report comes out. There have been some signs that core inflation has crept higher this year. I’m curious to see if this trend is still in play. We also have two Buy List stocks due to report earnings. Be sure to keep checking the blog for daily updates. I’ll have more market analysis for you in the next issue of CWS Market Review!
– Eddy
Morning News: August 14, 2015
Posted by Eddy Elfenbein on August 14th, 2015 at 6:44 amAs Greek Bailout Deal Passes, Alexis Tsipras Faces Rebellion
China’s Renminbi Devaluation May Initiate New Phase in Global Currency War
Jobless Claims in U.S. Holding Just Above a Four-Decade Low
In Good Times or Bad, Brazil Banks Profit
In a Show of Confidence, Americans Boost Spending
Solar is Having a Great Year, Except on Wall Street
General Electric Sells GE Capital Bank’s Online Platform to Goldman Sachs
King Digital Entertainment’s Profit Down
Maersk Adjusts To Weakness in Shipping and Oil Markets
Cisco’s Money Can’t Buy It Love
Apple Said to Delay Live TV Service to 2016 as Negotiations Stall
VW Has Spent Two Years Trying to Hide a Big Security Flaw
Cullen Roche: The China Slowdown in Perspective
Jeff Carter: Flexible Work and Flexible Employees
Be sure to follow me on Twitter.
Morning News: August 13, 2015
Posted by Eddy Elfenbein on August 13th, 2015 at 5:23 amChina Central Bank Tries to Soothe Global Markets, Says No Reason For Yuan To Fall Further
Deutsche Bank Employees Charged in Emissions Trading Case
India Court Overturns Nestlé Maggi Noodles Ban
The Fed Is on Thinner Ice Than It Realizes, and It May Be Setting Us Up for Recession
Alibaba Revenue Misses Expectations; $4 Billion Stock Buyback Is Planned
Cisco Rises in Germany as Sales Top Estimates on Americas Growth
Lenovo Faces Motorola Hangover, Cuts 3,200 Jobs as Sales Slide, Profit Tumbles
Maersk Soars as Earnings Show Company Defying Market Headwinds
Drinks Bottler Coke HBC Sales Up Slightly
News Corp Posts Loss on Education Write-Down
NBCUniversal Invests $200 Million in Vox Media
Data-Storage Startup Pure Storage Files for IPO
Roche Buys ‘Superbug’ Diagnostics Firm For Up to $425 Million
Cullen Roche: Is More Information Making Us Worse Investors?
Joshua Brown: A New “Headwind” is Born
Be sure to follow me on Twitter.
How the Market Behaves at All-Time Highs
Posted by Eddy Elfenbein on August 12th, 2015 at 3:31 pmFinance people tend to be numbers people. I’d certainly include myself in that group. You can mention any financial topic and there are dozens of studies, charts and regressions on it. Name it and the numbers have been crunched.
This obscures an important point. All these numbers do is explain a few basic truths about the market. What can be told with numbers only reinforces what can be said with words, and usually only a few words.
The important truths about the market aren’t many and they aren’t complicated. Investors need to understand them. On Monday, for example, I highlighted the recent behavior of Royal Caribbean (RCL). The stock dove in October due to fears of Ebola. It’s recovered and gone on to soar to new heights.
With our RCL example, the important truth is that stocks oscillate between large, quick downdrafts and long, slow up trends. The downs are fast and dramatic, the recoveries are slow and boring. Yet, it’s the boring part that makes all the difference. People spend too much time worrying about the painful declines and not enough time on riding out the long rallies.
Earlier this year, I looked at all the daily closes for the S&P 500 going back to the 1930s. I found that all the days where the market went up or down by more than 1.17% canceled each other out. The entire gain came from the low volume days. You hear a lot about tail risk, but the important part of the distribution is the tall heads.
(Incidentally, the market’s returns aren’t merely fat-tailed, they’re tall-headed as well. That’s “leptokurtic” if you’re looking to impress people.)
Most of the market’s big one-day gains have come right after big one-day losses. I asked Ryan Detrick, a must-follow on Twitter, to look at how the S&P 500 has behaved when it’s at a new all-time high. As I suspected, the market is far calmer than it normally is, and the return has been better as well.
Since 1950, there have been 1,026 trading days following a new high. (Technically, we could say the study goes back to 1929 because it took until 1954 for the index to make a new high.) That’s about 6.2% of the time, or one new high in every 16.1 days.
Of those 1,026 new highs, the market rose the following day nearly 56% of the time. That compares with 53% for all days.
To me the arresting fact is the standard deviation. For all market days, the standard deviation is 0.965%. But when the market’s at a new high, it’s only 0.611%. That’s more than 36% less volatility.
In the last 60 years, the S&P 500 has risen by more than 2% following a new high just three times. The normal market sees 2% up days more than four times more frequently. It’s probably more appropriate to say that volatility rises when the market is off its high than to say that volatility is lower at the top.
In the last 60 years, the biggest rally off a new high came on January 6, 1999 when the S&P 500 gained 2.21%. Of all days, that’s only the 265th best day.
If you had invested solely in those 1,026 days (with no transaction costs), you would have made 95.6%. Those 1,026 days are equal to about four years. The annualized return works out to 18%.
Let’s consider this hypothetical. Let’s say the entire stock market only offered two rewards. For 95% of the time, the market gained 1.2% a month. For 5% of the time, it lost 10% a month. Those are your only two outcomes.
That’s a good way to think about market behavior. The annualized outcome of our hypothetical is about 7.5%, but there are pronounced dips along the way. If you invest for several years, you’ll likely experience more than a few down months bunched together. The long-term trend, however, is unmistakable.
You’ll notice that market commentators spend far too much time talking about the inevitable declines than they do on what drives the vol gains. As a successful investor, view downturns as both necessary and fleeting.
Morning News: August 12, 2015
Posted by Eddy Elfenbein on August 12th, 2015 at 7:18 amGreek Bank Bailout Funds Depend on Business Plan, Stress Test
Gold Recovers as Yuan-Struck Investors Seek Safe Haven
IEA Sees Oil Glut Through 2016 After Reaching 17-Year High
Google CEO Sundar Pichai Symbolizes the New India
Fidelity National Agrees to Buy SunGard for $9.1 Billion
GE to Sell Health-Care Lending Operations to Capital One for $9 Billion
Ford Moves Commercial Truck Production to Ohio From Mexico
Alibaba Growth Slowest in Three Years
Pearson Sells 50% Stake in the Economist Group
On-Demand Startup Zirtual Will Be Back in Business Thanks to Startups.co
Indian Government Seeks Almost $100 Million in Damages From Nestlé
Who’s Behind the 96 Million ‘Shade Balls’ That Just Rolled Into L.A.’s Reservoirs?
American Apparel Warns It Needs to Raise Money
Cullen Roche: The Dunning Kruger Effect in Finance
Jeff Carter: Competitive Devaluation; Not the Way To Run an Economy
Be sure to follow me on Twitter.
Moog Adds Four Million Shares to Buyback Plan
Posted by Eddy Elfenbein on August 11th, 2015 at 8:48 pmAfter the bell, Moog (MOG-A) said they’re adding four million shares to their existing share buyback program.
The original plan was to buy back nine million shares. So far, they’ve bought back 8.3 million.
After giving effect to the increase in authority, the Company will be able to acquire an aggregate of 4.7 million shares of its Class A and Class B common stock at management’s discretion. The timing of repurchases will depend upon several factors, including various debt covenants, market and business conditions. The Company does not expect the pace of purchases to match that of the previous 18 months, in part due to compliance requirements with financial covenants included in its debt agreements. The program may be discontinued at any time.
“Our cash flow has been strong over the last few years,” said John Scannell, Chairman and CEO. “This has afforded us the opportunity to return nearly $600 million of value to our shareholders in the form of a share repurchase program that we initiated in early 2014. We are pleased to have the flexibility to continue this program.”
On Friday, the stock got down to $64.28 per share. That’s the lowest price since April 25, 2014.
Morning News: August 11, 2015
Posted by Eddy Elfenbein on August 11th, 2015 at 6:58 amGreece, Lenders Clinch Bailout Deal After Marathon Talks
German Economic Sentiment Unexpectedly Deteriorates in August
Yuan Devaluation Worsens Debt Woes for Local Governments and Companies
Japan Restarts Nuclear Reactor, 4 Years After Fukushima. What’s At Stake?
U.S. Government Bonds Post Big Selloff
Small Business Owners’ Optimism Bumping Along
Officials Downstream From Colorado Mine Spill Demand Answers
Pichai Tapped to Run Restructured Google Within Alphabet
Shake Shack Reports Higher Quarterly Sales and Profits
U.S. Postal Service Narrows Its Loss
Symantec Agrees to Sell Data Storage Unit to Carlyle
Tax Scam Losses Exceed $20 Million
Roger Nusbaum: Investors Don’t Want Their MTV
Howard Lindzon: The Race to $1 Trillion…Google and Financial Engineering
Be sure to follow me on Twitter.
Buffett Buys Precision Castparts
Posted by Eddy Elfenbein on August 10th, 2015 at 2:39 pmThe big news is that Warren Buffett is buying Precision Castparts (PCP) for $37.2 billion. This is his biggest deal ever.
Berkshire Hathaway, his $354 billion industrial empire, said on Monday that it would buy Precision Castparts for $32 billion. The move will help move Mr. Buffett’s company — which includes earlier acquisitions ranging from the Burlington Northern Santa Fe railroad to Fruit of the Loom underwear — further into the industrial sector. Including debt, the transaction is worth $37.2 billion.
Not only is the acquisition Mr. Buffett’s most ambitious — just weeks from his 85th birthday, but it is also a standout in what has been a banner year for mergers, with more than $2.7 trillion in deals already announced.
Deal watchers and fans of Berkshire Hathaway have long expected the conglomerate to strike huge deals with regularity. The company generates an enormous amount of cash from its various operations, sitting on nearly $67 billion as of June 30.
And Mr. Buffett has long spoken about his “elephant gun,” the huge pile of cash that Berkshire Hathaway has reserved for big deals, and his itchy trigger finger.
Berkshire is paying $235 per share for Precision Castparts. That’s a 21% premium. PCP’s fiscal year ends in March. Wall Street expects earnings of $13.94 for the calendar year of 2016. That means Buffett is paying 16.86 times next year’s earnings for PCP. That seems like a good price but not a screaming bargain.
What’s interesting is that Buffett is buying this stock after it’s had several great years. Since 1978, PCP is up over 158,000% to the S&P 500’s 2,100%.
From December 31, 1999 to December 31, 2013, PCP gained 4,003%. The S&P 500, in contrast, gained 25.8%. PCP has lagged the market since then, but Buffett clearly doesn’t have a problem with buying a stock that’s run up so much.
-
Archives
- June 2026
- May 2026
- April 2026
- March 2026
- February 2026
- January 2026
- December 2025
- November 2025
- October 2025
- September 2025
- August 2025
- July 2025
- June 2025
- May 2025
- April 2025
- March 2025
- February 2025
- January 2025
- December 2024
- November 2024
- October 2024
- September 2024
- August 2024
- July 2024
- June 2024
- May 2024
- April 2024
- March 2024
- February 2024
- January 2024
- December 2023
- November 2023
- October 2023
- September 2023
- August 2023
- July 2023
- June 2023
- May 2023
- April 2023
- March 2023
- February 2023
- January 2023
- December 2022
- November 2022
- October 2022
- September 2022
- August 2022
- July 2022
- June 2022
- May 2022
- April 2022
- March 2022
- February 2022
- January 2022
- December 2021
- November 2021
- October 2021
- September 2021
- August 2021
- July 2021
- June 2021
- May 2021
- April 2021
- March 2021
- February 2021
- January 2021
- December 2020
- November 2020
- October 2020
- September 2020
- August 2020
- July 2020
- June 2020
- May 2020
- April 2020
- March 2020
- February 2020
- January 2020
- December 2019
- November 2019
- October 2019
- September 2019
- August 2019
- July 2019
- June 2019
- May 2019
- April 2019
- March 2019
- February 2019
- January 2019
- December 2018
- November 2018
- October 2018
- September 2018
- August 2018
- July 2018
- June 2018
- May 2018
- April 2018
- March 2018
- February 2018
- January 2018
- December 2017
- November 2017
- October 2017
- September 2017
- August 2017
- July 2017
- June 2017
- May 2017
- April 2017
- March 2017
- February 2017
- January 2017
- December 2016
- November 2016
- October 2016
- September 2016
- August 2016
- July 2016
- June 2016
- May 2016
- April 2016
- March 2016
- February 2016
- January 2016
- December 2015
- November 2015
- October 2015
- September 2015
- August 2015
- July 2015
- June 2015
- May 2015
- April 2015
- March 2015
- February 2015
- January 2015
- December 2014
- November 2014
- October 2014
- September 2014
- August 2014
- July 2014
- June 2014
- May 2014
- April 2014
- March 2014
- February 2014
- January 2014
- December 2013
- November 2013
- October 2013
- September 2013
- August 2013
- July 2013
- June 2013
- May 2013
- April 2013
- March 2013
- February 2013
- January 2013
- December 2012
- November 2012
- October 2012
- September 2012
- August 2012
- July 2012
- June 2012
- May 2012
- April 2012
- March 2012
- February 2012
- January 2012
- December 2011
- November 2011
- October 2011
- September 2011
- August 2011
- July 2011
- June 2011
- May 2011
- April 2011
- March 2011
- February 2011
- January 2011
- December 2010
- November 2010
- October 2010
- September 2010
- August 2010
- July 2010
- June 2010
- May 2010
- April 2010
- March 2010
- February 2010
- January 2010
- December 2009
- November 2009
- October 2009
- September 2009
- August 2009
- July 2009
- June 2009
- May 2009
- April 2009
- March 2009
- February 2009
- January 2009
- December 2008
- November 2008
- October 2008
- September 2008
- August 2008
- July 2008
- June 2008
- May 2008
- April 2008
- March 2008
- February 2008
- January 2008
- December 2007
- November 2007
- October 2007
- September 2007
- August 2007
- July 2007
- June 2007
- May 2007
- April 2007
- March 2007
- February 2007
- January 2007
- December 2006
- November 2006
- October 2006
- September 2006
- August 2006
- July 2006
- June 2006
- May 2006
- April 2006
- March 2006
- February 2006
- January 2006
- December 2005
- November 2005
- October 2005
- September 2005
- August 2005
- July 2005
 Eddy Elfenbein is a Washington, DC-based speaker, portfolio manager and editor of the blog Crossing Wall Street. His