-
Ross Stores Splits 2-for-1
Posted by Eddy Elfenbein on June 12th, 2015 at 9:31 amShares of Ross Stores (ROST) have split 2-for-1 today. Shareholders have twice as many shares while the share price has fallen in half.
I always try to be as transparent as possible with our Buy List. For tracking purposes, I assume the Buy List is a $1 million portfolio at the start of the year. That’s 20 positions of $50,000 for each stock. For Ross Stores, that meant 530.4477 shares at $94.26 (the closing price on December 31).
To adjust for the split, the Buy List portfolio now holds 1,060.8954 shares of Ross with $47.13 as the purchase price.
-
CWS Market Review – June 12, 2015
Posted by Eddy Elfenbein on June 12th, 2015 at 7:08 am“If you have trouble imagining a 20% loss in the stock market, you shouldn’t be in stocks.” – Jack Bogle
The good news is that good news is once again bad news. Before, bad news was actually good news because the bad news was worse than had been expected. Since the expectations of bad news had in fact been expected, that was actually good news.
Follow?
Don’t worry. I’ll try to untangle the mess for you. On Planet Wall Street, the rules of what’s good or bad are constantly changing. It’s like a $20 trillion game of Calvinball.
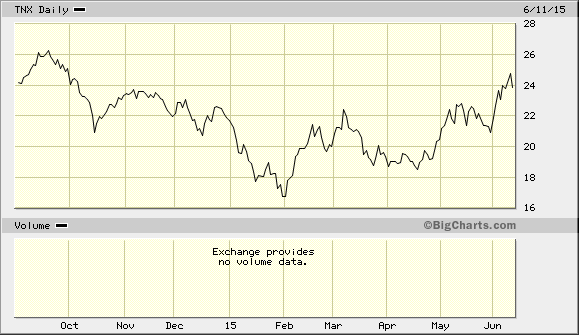
In this week’s CWS Market Review, I’ll take a closer look at the May jobs report. The headline numbers were pretty good, but there’s still a lot of weakness out there. I’ll also discuss the bond market’s recent drop. The yield on the 10-year Treasury is flirting with nine-month highs (see below). On Wednesday, as the bond market was retreating, stocks had their best day in more than a month. Bonds and stocks are decoupling. As I explained in last week’s issue, this is part of an important rotation unfolding on Wall Street that’s impacting our portfolios.
Speaking of which, I’ll preview upcoming earnings reports from Oracle (ORCL) and Bed Bath & Beyond (BBBY). The tech world will be especially interested in how Oracle has been doing. This week, we got a 9% dividend increase from CR Bard (BCR). I love a good Buy List dividend hike! The medical-equipment company has increased its dividend every year since 1972. Not many companies can say that but we like those long-term winners on our Buy List. But first, let’s take a step back and look at the macro picture.
More Americans Are Working, but Wage Growth Is Slow
Last Friday, the government said that the U.S. economy created 280,000 net new jobs in May. That’s a strong report; economists had been expecting an increase of 222,000. On top of that, the poor payroll number for April was revised higher by 34,000, while the May figure was revised a little bit lower.
The increase in jobs is especially good considering the big cutbacks in the energy sector. The plunge in crude hit the energy sector hard. Jobs in drilling and mining fell by 17,000 last month. That’s the fifth month in a row of job losses in that sector. Energy stocks are still looking rough.
For the overall jobs market, the problem area continues to be wage growth. More people are working, but folks aren’t seeing much in the way of raises. In May, wages rose by only 0.3%. In the last year, wages are up 2.3%. That’s not much, and it’s actually the best year-over-year increase since 2013. Though, as Josh Brown reminded us this week, wage growth usually comes in the latter stages of an economic recovery.
What really concerns Wall Street is inflation. Despite numerous predictions that inflation is about to come back, prices are still well contained. However, a tighter jobs market should lead to higher wages, which will in turn lead to higher prices. There’s been news recently of high-profile employers like McDonald’s (MCD), Walmart (WMT) and Target (TGT) raising worker pay. This week’s JOLTS report showed that job openings jumped to a record high (the data series began in 2000).
Former Fed Chairman William McChesney Martin famously described the Fed’s job as taking away the punchbowl once the party gets going. It looks like the Fed is getting ready to take away the punchbowl before the party has even started. Heck, I don’t think the invitations have even been sent out!
But that hasn’t stopped the bond market from taking its cue. On Wednesday, the 10-year Treasury yield came within a whisker of breaching 2.50%. The 10-year hasn’t yielded that much since last September. This is part of the market’s rotation. Stocks and bonds are moving in completely different directions.
To go back to my introduction, we’ve reached another classic impasse on Wall Street when good news may actually be bad news. Or more specifically, good economic news is bad news for the financial markets, since it means that the Fed is more inclined to hike interest rates.
But I want to reiterate my view since it seems to be in the minority on Wall Street, and that’s that the economy is doing better than a lot of people realize. Please don’t take this as a political stand. Rather, I’m looking at the numbers. For example, the retail-sales report for May was pretty good. Last month, sales rose 1.2%. Excluding gasoline, retail sales were up 1.0%. The numbers for March and April were revised higher as well.
I was also pleased to see that Corelogic reported that homes in foreclosure are at their lowest level since November 2007. Foreclosures are 67% below their peak. That’s very good news. The broad economic stats for Q2 should be quite good. The Atlanta Fed has a GDP model. Currently, the model sees GDP growth for Q2 coming in at 1.9%. I think it will be closer to 3%.
The weakness in the bond is perhaps the strongest clue that the economy is getting better. It’s also interesting to note that financial stocks have been leading the market over the past few weeks. The Financial Sector ETF (XLF) has been outperforming the overall market since late April (think Quadrant 2 from last week’s chart).
Earnings Preview for Oracle and Bed Bath & Beyond
I’m pleased to see that our Buy List continues to lead the overall market this year. A few of our stocks like Cognizant Technology (CTSH), Wells Fargo (WFC) and Fiserv (FISV) are having excellent years so far. I expect more good results when the second-quarter earnings season begins next month. Before that happens, two of our Buy List stocks, Oracle and Bed Bath & Beyond, are due to report earnings. These are our only two stocks that report on the February/May/August/November reporting cycle.
Oracle (ORCL) is set to report their fiscal Q4 earnings after the closing bell on Wednesday, June 17. This will be a closely-watched earnings report for the entire tech sector.
Three months ago, Oracle reported earnings of 68 cents per share, which matched expectations. The problem was that they were clipped by the strong dollar. There’s been a lot of that going around. But the best news was that the software giant raised its dividend by 25%.
For Q4, Oracle said they see earnings ranging between 90 and 96 cents per share. Wall Street had been expecting 88 cents per share. I’ve been especially impressed with how well Oracle’s cloud business has been progressing.
Unfortunately, shares of Oracle have been locked between $43 and $45 for much of the last three months. I don’t feel confident saying Oracle will beat their earnings forecast. The question mark is the impact of currency. Outside that, I have a great deal of confidence in Oracle. I also want to see what they have to say for Q1 (which ends in August). Wall Street currently expects 62 cents per share.
I like Oracle a lot, but I want to be cautious here before we see solid evidence. Oracle remains a buy up to $46 per share. I want to keep a tight range here.
Bed Bath & Beyond (BBBY) is due to report fiscal Q1 earnings on Wednesday, June 24, exactly one week after Oracle. The home-furnishings store is in an odd spot. The company generates tons of cash. They’ve been using much of it to buy back stock. Unlike many other companies, BBBY actually reduces their share count. I like that. What I don’t like is their spending tons of money on a stock that’s no longer such a bargain.
The company told us to expect fiscal Q2 earnings to range between 90 and 95 cents per share. I’m not wild about that guidance. BBBY sees comp-store sales rising between 2% and 3% for the quarter and the entire fiscal year. For full-year earnings, BBBY expects flat to mid-single digits. Let’s say that means 0% to 5%, so that implies an EPS range of $5.07 to $5.32. Wall Street had been expecting $5.43 per share.
Honestly, I’m a little frustrated with BBBY, but I won’t give up on them. I’m especially interested to hear what guidance they have to offer.
Updates on Other Buy List Stocks
Don’t forget that Ross Stores (ROST) has split 2 for 1. You should now have twice as many shares. The deep discounter is a good buy up to $52 per share.
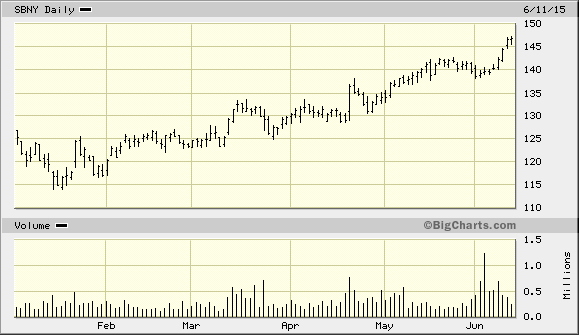
Last week, I highlighted Signature Bank (SBNY) as one of our Buy List stocks that looks especially attractive. The stock has now rallied for five days in a row, and it’s gained more than 5.2% in the last week. On Thursday, the bank hit another 52-week high. SBNY is now our second-best performer on the year. This week, I’m nudging up my Buy Below price on Signature to $150 per share.
Remember that stodgy, old-fashioned, boring dinosaur Snap-on (SNA)? Yep, new all-time high on Thursday.
Two weeks ago, I told you to expect another dividend increase soon from CR Bard (BCR). This week, Bard announced a 9% dividend increase. The quarterly payout will rise from 22 to 24 cents per share. That means the yearly dividend is 96 cents per share, which works out to a yield of 0.56%. That’s still pretty small.
I was able to predict Bard’s dividend increase based on my uncanny powers of prognostication, and also due to the fact that Bard has increased their dividend every year since 1972.
Bard also authorized a $500 million share buyback , which is about 4% of Bard’s overall market cap. My view is that Bard should put more of that towards the dividend, but I’m not about to complain. The company has performed very well for us.
That’s all for now. The Federal Reserve meets again next week. Don’t expect any move on interest rates, but Janet Yellen will a hold a post-meeting presser. The Fed will also update its economic projections, which tend to be pretty bad. The more interesting news will be the industrial production report, which comes out on Monday. IP has fallen for the last five months in a row. I hope this streak came to an end in May. Also, the CPI report for May will come out on Thursday. Be sure to keep checking the blog for daily updates. I’ll have more market analysis for you in the next issue of CWS Market Review!
– Eddy
-
Morning News: June 12, 2015
Posted by Eddy Elfenbein on June 12th, 2015 at 7:02 amIMF Quits Greek Debt Talks; No Deal In Sight Due To Continuing Disagreements
Fearful ECB Starts Countdown on Greek Funding Lifeline
Merkel Urges Greece and Creditors To Keep Pushing For Deal
Kuroda Seen Capping Yen Slide as Officials Hint Limit Close
You Need 35 Quadrillion In This Currency to Buy $1.00
Five Reasons Why Twitter’s CEO Needed to Fire Himself
Shares of Axovant, Alzheimer’s Drug Developer, Surge on Trading Debut
Goldman Gets Serious About High-Speed Trading
Airbus Forecasts Stronger Long-Term Aircraft Demand
Organic Farmers Object to Whole Foods Rating System
Rupert Murdoch to Put Media Empire in Sons’ Hands
These Are Wall Street’s Must-Read Books of the Summer
Joshua Brown: The Keynesian Ugly Contest
Ben Carlson: The Struggle to Define Risk
Be sure to follow me on Twitter.
-
Morning News: June 11, 2015
Posted by Eddy Elfenbein on June 11th, 2015 at 7:11 amGerman Central Bank Chief Says Time Running Out For Greece
German Holders of Greek Bonds Can Seek Compensation: European Court of Justice
New Zealand Dollar Sinks To 5-Yr Low on Rate Cut
China May Investment Up 11.4% Year-on-Year
Luxury Goods Face a Global Reckoning
Alibaba’s Ma Sees $1 Trillion in Transactions in Five Years
EU Opens Investigation Into Amazon’s e-Book Selling
J. Crew Names New Head of Women’s Design, Eliminates 175 Jobs
Top Executive at Kleiner Perkins to Make Rare Silicon Valley Shift, to Menlo Ventures
American Billionaire Takes On Samsung
Sidewalk Labs, a Start-Up Created by Google, Has Bold Aims to Improve City Living
No Need to Be Industry Number One, Says Spotify Founder
Jamie Dimon: I’m Not Sure Elizabeth Warren Understands Banking
Howard Lindzon: Goldman Sachs and ShittyBank…
Credit Writedowns: Are Bond Investors Crying Wolf?
Be sure to follow me on Twitter.
-
Morning News: June 10, 2015
Posted by Eddy Elfenbein on June 10th, 2015 at 7:02 amGreece Looks to Merkel to Break Impasse as Plan Snarls Talks
U.S. Shifts Stance on Drug Pricing in Pacific Trade Pact Talks, Document Reveals
Did A Judge Just Undermine The Administrative State With SEC Ruling?
DoubleLine’s Gundlach Sees Odds of Fed Hike By December Under 50%
Wall St. Courts Start-Ups It Once May Have Ignored
Tokio Marine Holdings to Acquire HCC Insurance Holdings in $7.5 Billion Transaction
Bayer to Sell Diabetes Unit to KKR Unit for $1.15 Billion
Spotify Raises $526 Million Amid Battle With Apple
Jack Ma Says Alibaba Has No Plans To Invade America, It’s The Other Way Around
Sears — Retailing Takes A Back Seat To Real Estate
Gen X Was Right: Reality Really Does Bite
Zara Owner Profits Up on Sales Surge
Regulators Pressed For Exit of Deutsche Co-Chiefs
Roger Nusbaum: Does It Make My Portfolio Better?
Joshua Brown: The 2nd Stage of Recovery: Wage Negotiating Power
Be sure to follow me on Twitter.
-
Morning News: June 9, 2015
Posted by Eddy Elfenbein on June 9th, 2015 at 7:14 amGreece Delivers Reform Plan to EU, Warns on Cost of Failure
Pensions in Greece Feel the Pinch of Debt Negotiations
Iceland to Lift Capital Controls Imposed After Financial Crisis
The $6.5 Trillion China Rally That’s Making Stock-Market History
GE to Sell Buyout Unit to Canada Pension Fund for $12 Billion
McDonald’s Sales Top Estimates After Europe Outperforms U.S.
Six Reasons Why Anshu Jain Quit Deutsche Bank
Apple Works to Refocus Its Devices at Nexus of Entertainment
Chipotle’s Hourly Workers Are Getting Paid Sick Leave And Vacation
HSBC to Cut 50,000 Jobs in Quest For Higher Dividends
Uber Spends Heavily to Establish Itself in China
Mergers Might Not Signal Optimism
Howard Lindzon: The Profit Bubble…Late is the New Early
Jeff Carter: Have American Marketers Pulled a Fast One?
Be sure to follow me on Twitter.
-
eBay Lower on Downgrade
Posted by Eddy Elfenbein on June 8th, 2015 at 1:46 pmShares of eBay (EBAY) are down about 4% after the online auction house was downgraded by Piper Jaffray.
The firm reiterated an “underweight” rating with a $50 price target.
Analysts believe investor optimism will rise into the PayPal spin-off this fall, but will fall after the move.
Piper added that half of PayPal’s payments will be through mobile devices by the end of 2016 amid greater competition from Google’s (GOOGL) Android Pay and Apple’s (AAPL) Apple Pay.
eBay gave guidance for the PayPal spinoff. They see sales growth of 0% to 5% for eBay with operating margin between 32% and 34%. For next year, they again project revenue growth of 0% to 5% but operating revenue of 31% to 35%. For PayPal, they project revenue growth of 15% to 18% with operating margin between 20% and 21%.
-
Morning News: June 8, 2015
Posted by Eddy Elfenbein on June 8th, 2015 at 7:14 amIf You Think Greece’s Crisis Will End Soon, Think Again
Japan GDP Revised to Annualized 3.9% on Surge in Capital Spending
Dollar Falls From Its 13-Year High Against Yen
Souring China Business Climate Risks U.S. Investment Treaty Talks
Bond-Market Game of Chicken With Fed Is Riskier Than Ever
Lending Euros to Warren Buffett Can Hurt Your Financial Health
G.E. Nears Private Equity Sale to Canadian Pension Fund
G.E. Nears Deal on Major Step In Retreat From Banking
Britain’s FTSE Recovers Two-Month Low After Diageo Shares Rally on Bid Report
Hermes EOS Backs Deutsche Bank CEO Change
Sears Holdings’ Sales Swoon Continues, Though Profit Improves
Syngenta Rejects Second Takeover Approach From Monsanto
Protections for Late Investors Can Inflate Start-Up Valuations
Jeff Carter: Fair and Balanced
Jeff Miller: Weighing the Week Ahead: Time for a Consumer Rebound?
Be sure to follow me on Twitter.
-
May NFP = +280,000
Posted by Eddy Elfenbein on June 5th, 2015 at 10:05 amThis morning’s jobs report was a good one. The U.S. economy created 280,000 net new jobs last month. The number for March was revised higher by 34,000 and April was revised up by 32,000. The economy created 501,000 jobs in April and May.
The jobs-to-population ratio ticked up to 59.41%. That’s the best reading in nearly six years. The fact remains that a lot of people have dropped out of the labor force. They’re not even looking for a job.
The workforce participation rate appears to be stabilizing, and it bumped up a tiny bit last month. As a result, the unemployment rate rose to 5.5% despite the growth in jobs.
-
CWS Market Review – June 5, 2015
Posted by Eddy Elfenbein on June 5th, 2015 at 7:08 am“I can assure you that any specific projections I write down will
turn out to be wrong, perhaps markedly so.” – Janet YellenThanks for the tip, Janet, but frankly, we were already pretty skeptical of the Fed’s forecasting abilities. To be fair, the Fed’s lackluster track record precedes Yellen’s tenure. But the track record is clear: the Federal Reserve has consistently been overly optimistic on the U.S. economy.
Lately, the Fed has sounded far more aggressive on the need to raise interest rates, while the markets are much more doubtful. When in doubt, I side with the markets over economists. Last year, Janet Yellen implied that rate hikes would happen by the middle of 2015. Well, we’re nearly there, and short rates are still flat as a pancake. It looks like the Fed may not move until the fall. Some folks, like Christine Lagarde at the IMF, think the Fed should wait until next year.
Wall Street is slowly beginning to realize that higher rates are on the way, though they may tarry. In response to the expectation for higher rates, there’s been a pronounced rotation developing just below the surface. This is very important, and I want all investors to understand what’s happening. In this week’s CWS Market Review, we’ll take a closer look at this rotation and how it impacts our portfolios. I’ll also take an early look at Q2 earnings, plus I have some updates on our Buy List stocks. But first, let’s examine the internal shift spreading across the canyons of lower Manhattan.
The Elfenbein Theory of the Stock Market
On my blog two weeks ago, I unveiled the “Elfenbein Theory Which Explains the Entire Stock Market.” I expect my Nobel Prize shortly. Until then, you can read the full post here.
The quick version is that there’s a general pattern to sector rotations in the stock market. These patterns tend to mirror the movement of interest rates, both long-term and short-term. Here’s the matrix I used:
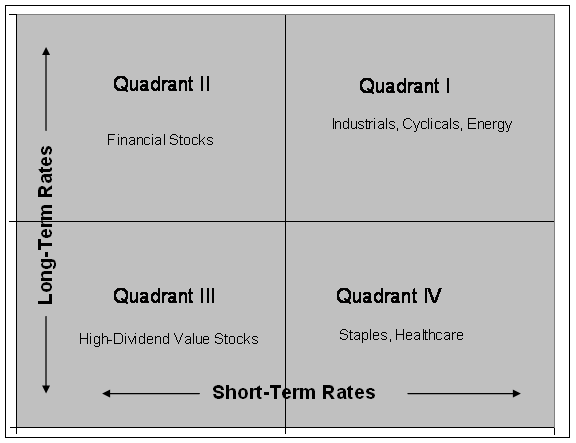
As the stock market has accepted that interest rates will rise, this has caused a shift within the market. It’s interesting that this shift is happening while the overall market has been rather placid. It goes to show that just looking at the major market indexes only tells you part of the story.
What’s happening is that stocks with high-dividend yields have generally lagged the market, while sectors closely tied to the economic cycle have done well. You can see this most clearly by looking at the relative performance of areas like REITs and Utility stocks.
When interest rates move up, investors naturally shun the safety of dividends in hopes of finding more growth elsewhere. Check out this intra-day chart of the Dow Utility Average (in black) along with the Dow Transportation Average (in gold). The two lines have nearly become mirror images!
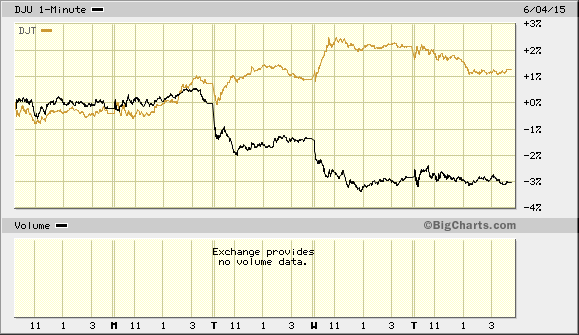
The important point isn’t that Transports have done well while Utes haven’t. It’s that the Trannies have done well specifically when Utes haven’t. That, my friends, is the key.
What it means is that investors are leaving dividends behind and moving towards cyclical areas. By cyclicals, I mean sectors like Transportation (trucking has been especially strong). This would also include the Tech sector, which has done pretty well this year. The best performer this year on our Buy List is Cognizant Technology Solutions (CTSH), with a 22.4% gain.
There’s an important but subtle distinction about this rotation. The market’s strength has mostly been in areas we call the “early cyclicals.” That’s shorthand for “everything but commodities,” and that’s why the Energy and Material areas are still rather weak. ExxonMobil (XOM) is hovering just above its 52-week low.
An important area to watch is the Consumer Discretionaries. These are large-ticket items, so they tend to be cyclical. But these items are often financed by consumers, so the sector has some correlation with financial stocks. I urge investors not to be overly mechanistic when thinking about the market because a lot of lines get blurred.
When we look at the short end of the yield curve, sure enough, we see some hints that the market is pricing in a rate increase. One price I like to watch is the spread between the six-month and one-year Treasury yields. This is a good clue as to what the six-month yield will be six months from now. From 2012 through 2014, there was a barely a difference between the six-month and one-year yields. Most of the time, the spread was about four or five basis points (or 0.04% to 0.05%). That’s basically nothing, and a few times, there was no spread at all.
This year has been a different story. The spread between six-month and one-year Treasuries recently hit 20 basis points, or 0.2%. That may not sound like much, but it’s the widest spread in more than five years. In short, the bond market is saying, “We’re not asking for much for the next six months, but after that, you’d better start paying up.”
The futures market now thinks there’s a 60% probability the Fed will raise rates by December. That pretty much comports with the yield spread I just mentioned. Interestingly, the Fed meets again on June 16-17. Don’t expect a rate hike then, but I’m sure the committee members will be focused on one soon. But that discussion hinges on the economy.
It’s clear that the broader economy once again faced a slowdown this winter. This was the third time in the last five years that Q1 GDP growth was negative. The more recent data, however, have been more optimistic.
This week, we learned that the ISM Manufacturing Index expanded for the first time this year. The Employment and Non-Manufacturing Indexes both showed expansions, but at a lower rate than last month. The trade deficit for April declined to $40.9 billion. That was $3 billion less than economists were expecting. Also, the Fed’s “Beige Book” was broadly positive.
I’m writing to you on Friday morning ahead of the big May jobs report. On Wednesday, ADP, the payroll firm, said that 201,000 private-sector jobs were created last month. For Friday’s report, the consensus on Wall Street is for a gain of 220,000 net new jobs. According to the last report, 223,000 new jobs were created in April. The unemployment rate ticked down to 5.4%, which was the lowest in six years.
By the way, can you imagine how people would have reacted in, say, 2012 to the news that unemployment would be at 5.4% and the Fed still wouldn’t have raised rates? How the world has changed. Naturally, the unemployment rate is somewhat distorted by the fall in the workforce participation rate. Some of that is demographics, but not all. Sadly, there are a lot of able-bodied people who have dropped out of the work pool entirely.
Sorry, But the Earnings Recession Isn’t Over
Second-quarter earnings season is still a few weeks away, but let’s look at where we stand. Q1 earnings were pretty bad, a 5.5% drop from last year’s Q1. The only good part is that analysts had been expecting even worse. This came after a 5.4% earnings drop for Q4.
Wall Street currently expects earnings for the S&P 500 of $28.57. That’s the index-adjusted figure (each point in the S&P 500 is about $8.85 billion). That represents a 2.6% drop from last year’s Q2. When all the numbers are in, I think there’s a good chance that Q2 earnings will only be down slightly from last year. Unfortunately, this would be the third quarter in a row of falling earnings.
After that, Wall Street expects earnings to rise by 1.3% for Q3. Then earnings start to rip higher. Wall Street expects double-digit growth for Q4 and all of 2016. That, of course, is a long way off but it suggests that once the near-term issues of the strong dollar and weakness in Europe pass, the earnings outlook is bright.
Now for some Buy List stocks that look especially attractive at the moment. While Wabco (WAB) is technically a transport, it does well when rails do well. The stock has been a great performer for us this year. I also like Signature Bank (SBNY). This is another one that doesn’t make a lot of noise, but it’s very good. Among the tech stocks, I still like Qualcomm (QCOM). It’s especially good if you see it below $69 per share.
Updates on our Buy List Stocks
Ross Stores (ROST) is due to split 2-for-1 next Friday, June 11. This week, I’m lowering my Buy Below to $104 per share. The Buy Below will split along with the stock, so the after the split, Ross will be a buy up to $52 per share. This is a very good stock.
This week, I want to make some minor adjustments to our Buy Below prices. I’m lowering Oracle’s (ORCL) Buy Below to $46 per share. I’m also lowering Bed Bath & Beyond (BBBY) to $75 per share. There’s nothing wrong with either stock. I simply don’t want investors chasing after them. Both stocks are due to report earnings later this month. They’re our only two Buy List stocks on the February/May/August/November reporting cycle.
I also want to raise my Buy Below price on Fiserv (FISV) to $82 per share. Fiserv tends to be pretty quiet, so I forget how good it is. I also want to raise the Buy Below on eBay (EBAY) to $65 per share. The shares have done very well since the last earnings report.
That’s all for now. Next week looks to be a slow week, but there will be a few key economic reports. On Tuesday, the Department of Commerce will report on wholesale inventories. On Wednesday, the Treasury Department will update us on the budget. The numbers here have been improving. Then on Thursday, the Census Bureau will report on retail sales for May. Be sure to keep checking the blog for daily updates. I’ll have more market analysis for you in the next issue of CWS Market Review!
– Eddy
-
Archives
- August 2026
- July 2026
- June 2026
- May 2026
- April 2026
- March 2026
- February 2026
- January 2026
- December 2025
- November 2025
- October 2025
- September 2025
- August 2025
- July 2025
- June 2025
- May 2025
- April 2025
- March 2025
- February 2025
- January 2025
- December 2024
- November 2024
- October 2024
- September 2024
- August 2024
- July 2024
- June 2024
- May 2024
- April 2024
- March 2024
- February 2024
- January 2024
- December 2023
- November 2023
- October 2023
- September 2023
- August 2023
- July 2023
- June 2023
- May 2023
- April 2023
- March 2023
- February 2023
- January 2023
- December 2022
- November 2022
- October 2022
- September 2022
- August 2022
- July 2022
- June 2022
- May 2022
- April 2022
- March 2022
- February 2022
- January 2022
- December 2021
- November 2021
- October 2021
- September 2021
- August 2021
- July 2021
- June 2021
- May 2021
- April 2021
- March 2021
- February 2021
- January 2021
- December 2020
- November 2020
- October 2020
- September 2020
- August 2020
- July 2020
- June 2020
- May 2020
- April 2020
- March 2020
- February 2020
- January 2020
- December 2019
- November 2019
- October 2019
- September 2019
- August 2019
- July 2019
- June 2019
- May 2019
- April 2019
- March 2019
- February 2019
- January 2019
- December 2018
- November 2018
- October 2018
- September 2018
- August 2018
- July 2018
- June 2018
- May 2018
- April 2018
- March 2018
- February 2018
- January 2018
- December 2017
- November 2017
- October 2017
- September 2017
- August 2017
- July 2017
- June 2017
- May 2017
- April 2017
- March 2017
- February 2017
- January 2017
- December 2016
- November 2016
- October 2016
- September 2016
- August 2016
- July 2016
- June 2016
- May 2016
- April 2016
- March 2016
- February 2016
- January 2016
- December 2015
- November 2015
- October 2015
- September 2015
- August 2015
- July 2015
- June 2015
- May 2015
- April 2015
- March 2015
- February 2015
- January 2015
- December 2014
- November 2014
- October 2014
- September 2014
- August 2014
- July 2014
- June 2014
- May 2014
- April 2014
- March 2014
- February 2014
- January 2014
- December 2013
- November 2013
- October 2013
- September 2013
- August 2013
- July 2013
- June 2013
- May 2013
- April 2013
- March 2013
- February 2013
- January 2013
- December 2012
- November 2012
- October 2012
- September 2012
- August 2012
- July 2012
- June 2012
- May 2012
- April 2012
- March 2012
- February 2012
- January 2012
- December 2011
- November 2011
- October 2011
- September 2011
- August 2011
- July 2011
- June 2011
- May 2011
- April 2011
- March 2011
- February 2011
- January 2011
- December 2010
- November 2010
- October 2010
- September 2010
- August 2010
- July 2010
- June 2010
- May 2010
- April 2010
- March 2010
- February 2010
- January 2010
- December 2009
- November 2009
- October 2009
- September 2009
- August 2009
- July 2009
- June 2009
- May 2009
- April 2009
- March 2009
- February 2009
- January 2009
- December 2008
- November 2008
- October 2008
- September 2008
- August 2008
- July 2008
- June 2008
- May 2008
- April 2008
- March 2008
- February 2008
- January 2008
- December 2007
- November 2007
- October 2007
- September 2007
- August 2007
- July 2007
- June 2007
- May 2007
- April 2007
- March 2007
- February 2007
- January 2007
- December 2006
- November 2006
- October 2006
- September 2006
- August 2006
- July 2006
- June 2006
- May 2006
- April 2006
- March 2006
- February 2006
- January 2006
- December 2005
- November 2005
- October 2005
- September 2005
- August 2005
- July 2005
 Eddy Elfenbein is a Washington, DC-based speaker, portfolio manager and editor of the blog Crossing Wall Street. His