-
Morning News: April 9, 2015
Posted by Eddy Elfenbein on April 9th, 2015 at 7:19 amIt’s 1950 for Cameron as BOE Extends Period of Record-Low Rates
Why This Earnings Season Could Be The Worst Since 2009
Wall St. Is Told to Tighten Digital Security of Partners
Blankfein’s Bet on Goldman Sachs Bond Trading Seen Reaping Gains
What the Shell-BG Deal Says About Oil Prices and Deal Making
Dimon Says JPMorgan Must Be Ready for Greek Exit From Euro Area
Dimon Says Once-in-3-Billion-Year Treasury Move Warning Shot
Google Plots New YouTube Subscription Service as Soon as This Year
Zynga Cofounder Pincus Returns as CEO Two Years After Stepping Down
Google Buying Twitter Would Be Like Microsoft Buying Yahoo
Why TNT Acquisition Is A Good Deal For FedEx
Alcoa Posts Strong Q1 Profit But Revenue Lacks Luster
Samsung Expects Record Galaxy Shipments, S6 Edge Shortage
Credit Writedowns: Is Greece’s Debt Odious?
John Hempton: So What Exactly Do You Get With Bank of the Internet Stock?
Be sure to follow me on Twitter.
-
Bed Bath & Beyond Earns $1.80 Per Share
Posted by Eddy Elfenbein on April 8th, 2015 at 4:22 pmBed Bath & Beyond (BBBY) earned $1.80 per share for fiscal Q4 which is largely what was expected. Their outlook, however, was weak. The company sees Q1 earnings between 90 and 95 cents per share. The stock is off by 3% in the after-hours market.
From the earnings report:
For the fourth quarter of fiscal 2014, the Company reported net earnings of $1.80 per diluted share ($321.1 million) compared with net earnings for the fourth quarter of fiscal 2013 of $1.60 per diluted share ($333.3 million). Net sales for the fourth quarter of fiscal 2014 were approximately $3.337 billion, an increase of approximately 4.2% from net sales of approximately $3.203 billion reported in the fourth quarter of fiscal 2013. Comparable sales in the fourth quarter of fiscal 2014 increased by approximately 3.7%, compared with an increase of approximately 1.7% in last year’s fiscal fourth quarter. Comparable sales for the fourth quarter of fiscal 2014 include an approximate 0.2% unfavorable impact from the change in the Canadian currency exchange rate.
For the fiscal full year ended February 28, 2015, the Company reported net earnings of $5.07 per diluted share ($957.5 million) compared with $4.79 per diluted share ($1.022 billion) in the full year of fiscal 2013. Net sales for fiscal 2014 were approximately $11.881 billion, an increase of approximately 3.3% from net sales of approximately $11.504 billion in fiscal 2013. Comparable sales for both fiscal 2014 and fiscal 2013 increased by approximately 2.4%.
Cost Plus World Market was excluded from the comparable sales calculations through the end of the fiscal first half of 2013 and is included beginning with the fiscal third quarter of 2013. Linen Holdings is excluded from the comparable sales calculations and will continue to be excluded on an ongoing basis because it represents non-retail activity.
Share Repurchase Program
During the fourth quarter of fiscal 2014, the Company repurchased approximately $947 million of its common stock, representing approximately 11.8 million shares. Of this total, approximately $782 million, representing approximately 10.3 million shares, were from open market repurchases, and the remaining $165 million and 1.5 million shares represented the net settlement at the completion of the Company’s $1.1 billion accelerated share repurchase program in December 2014. As of February 28, 2015, the remaining balance of the current $2.0 billion share repurchase program was approximately $884 million.
Fiscal 2015 Financial Model
The Company is modeling a 2.0% to 3.0% increase for comparable sales for both the fiscal 2015 first quarter and full year, net earnings per diluted share to be between $.90 to $.95 for the first quarter of fiscal 2015, and to be between relatively flat and a mid-single digit percentage increase for the fiscal full year. The Company’s fiscal 2015 model includes the impact of approximately $.24 per diluted share related to four non-comparable items between its 2014 results and its 2015 model. These non-comparable items are: an increase in the 2015 tax rate due to a reduction in the amount of distinct tax events modeled in fiscal 2015; a credit card fee litigation settlement benefit in fiscal 2014 that is not expected to reoccur in 2015; the modeled unfavorable foreign currency exchange rate impact in 2015; and an increase in investments in compensation and benefits in 2015 beyond those historically planned. The modeling of net earnings per diluted share is based upon a number of assumptions which will be described in the Company’s fourth quarter of fiscal 2014 conference call. Information regarding access to the call is available in the Investor Relations section of the Company’s website.
-
The China Bubble
Posted by Eddy Elfenbein on April 8th, 2015 at 12:56 pmI often tell investors that true stock bubbles are relatively rare. That runs counter to what we often hear, but I stand by it.
Of course, just because the market goes down doesn’t mean it was a bubble beforehand. Sometimes the fundamentals deteriorate. What I call a bubble is when prices soar way, way beyond fundamentals, and that doesn’t happen very often — at least not in the U.S. market.
But looking at China, we can see a highly chaotic market. The Shanghai Composite has nearly doubled in nine months. As crazy as that is, it doesn’t come close to the incredible rally of just a few years ago. From late 2005 to October 2007, the Shanghai Composite rallied 460% in less than two years. Soon afterwards, it lost nearly all of it.
This is why I’m suspicious of the Chinese market. Healthy markets simply shouldn’t move like that.
-
Morning News: April 8, 2015
Posted by Eddy Elfenbein on April 8th, 2015 at 7:22 amJapan’s Dilemma Over the China-led Infrastructure Bank
US Authorities Upgrade India’s Aviation Safety Rating
Learning Mandarin in the Tundra – Russia Invites China Into Oil Business
Cubans Eager for More Clarity on Doing Business With U.S.
Forget Interest Rates, the Fed Has Another Big Decision to Make in the Next Year
Charles Grassley Questions Diversion of Fannie and Freddie Earnings
Oil Price Falls Ahead of U.S. Inventory Data
5 Things to Know About the Biggest Oil Merger in a Decade
Berkshire to Acquire $560 Million Axalta Stake From Carlyle
McDonald’s Looks to Beef Up Image With $5 Mega-Burger
Rite Aid Sales Grow on More Prescription Orders
Bezos’s Blue Origin Nears Opportunity to Take Tourists Into Space
JPMorgan Algorithm Knows You’re a Rogue Employee Before You Do
Jeff Carter: Farming Meets Tech – People Got To Eat
Roger Nusbaum: Figuring It Out: Being Positive
Be sure to follow me on Twitter.
-
Bed Bath & Beyond’s Quarterly Stats
Posted by Eddy Elfenbein on April 7th, 2015 at 1:28 pmTo get ready for tomorrow’s Bed Bath & Beyond (BBBY) earnings report, here are some quarterly stats I have for the past few years.
Quarter Sales Gross Profit Operating Profit Net Profit EPS May-99 $356,633 $146,214 $28,015 $17,883 $0.06 Aug-99 $451,715 $185,570 $53,580 $33,247 $0.12 Nov-00 $480,145 $196,784 $50,607 $31,707 $0.11 Feb-00 $569,012 $238,233 $77,138 $48,392 $0.17 May-00 $459,163 $187,293 $36,339 $23,364 $0.08 Aug-00 $589,381 $241,284 $70,009 $43,578 $0.15 Nov-01 $602,004 $246,080 $64,592 $40,665 $0.14 Feb-01 $746,107 $311,802 $101,898 $64,315 $0.22 May-01 $575,833 $234,959 $45,602 $30,007 $0.10 Aug-01 $713,636 $291,342 $84,672 $53,954 $0.18 Nov-02 $759,438 $311,030 $83,749 $52,964 $0.18 Feb-02 $879,055 $370,235 $132,077 $82,674 $0.28 May-02 $776,798 $318,362 $72,701 $46,299 $0.15 Aug-02 $903,044 $370,335 $119,687 $75,459 $0.25 Nov-03 $936,030 $386,224 $119,228 $75,112 $0.25 Feb-03 $1,049,292 $443,626 $168,441 $105,309 $0.35 May-03 $893,868 $367,180 $90,450 $57,508 $0.19 Aug-03 $1,111,445 $459,145 $155,867 $97,208 $0.32 Nov-04 $1,174,740 $486,987 $161,459 $100,506 $0.33 Feb-04 $1,297,928 $563,352 $231,567 $144,248 $0.47 May-04 $1,100,917 $456,774 $128,707 $82,049 $0.27 Aug-04 $1,273,960 $530,829 $189,108 $120,008 $0.39 Nov-05 $1,305,155 $548,152 $190,978 $121,927 $0.40 Feb-05 $1,467,646 $650,546 $283,621 $180,980 $0.59 May-05 $1,244,421 $520,781 $150,884 $98,903 $0.33 Aug-05 $1,431,182 $601,784 $217,877 $141,402 $0.47 Nov-06 $1,448,680 $615,363 $205,493 $134,620 $0.45 Feb-06 $1,685,279 $747,820 $304,917 $197,922 $0.67 May-06 $1,395,963 $590,098 $148,750 $100,431 $0.35 Aug-06 $1,607,239 $678,249 $219,622 $145,535 $0.51 Nov-07 $1,619,240 $704,073 $211,134 $142,436 $0.50 Feb-07 $1,994,987 $862,982 $309,895 $205,842 $0.72 May-07 $1,553,293 $646,109 $154,391 $104,647 $0.38 Aug-07 $1,767,716 $732,158 $211,037 $147,008 $0.55 Nov-08 $1,794,747 $747,866 $203,152 $138,232 $0.52 Feb-08 $1,933,186 $799,098 $259,442 $172,921 $0.66 May-08 $1,648,491 $656,000 $118,819 $76,777 $0.30 Aug-08 $1,853,892 $739,321 $187,421 $119,268 $0.46 Nov-08 $1,782,683 $692,857 $136,374 $87,700 $0.34 Feb-09 $1,923,274 $785,058 $231,282 $141,378 $0.55 May-09 $1,694,340 $666,818 $142,304 $87,172 $0.34 Aug-09 $1,914,909 $773,393 $222,031 $135,531 $0.52 Nov-09 $1,975,465 $812,412 $245,611 $151,288 $0.58 Feb-10 $2,244,079 $955,496 $370,741 $226,042 $0.86 May-10 $1,923,051 $775,036 $225,394 $137,553 $0.52 Aug-10 $2,136,730 $874,918 $296,902 $181,755 $0.70 Nov-10 $2,193,755 $896,508 $305,110 $188,574 $0.74 Feb-11 $2,504,967 $1,076,467 $461,052 $283,451 $1.12 May-11 $2,109,951 $857,572 $288,948 $180,578 $0.72 Aug-11 $2,314,064 $950,999 $371,636 $229,372 $0.93 Nov-11 $2,343,561 $958,693 $357,020 $228,544 $0.95 Feb-12 $2,732,314 $1,163,669 $550,765 $351,043 $1.48 May-12 $2,218,292 $887,199 $313,398 $206,836 $0.89 Aug-12 $2,593,015 $1,032,669 $365,137 $224,330 $0.98 Nov-12 $2,701,801 $1,074,010 $361,649 $232,750 $1.03 Feb-13 $3,401,477 $1,394,877 $598,034 $373,872 $1.68 May-13 $2,612,140 $1,032,971 $323,101 $202,490 $0.93 Aug-13 $2,823,672 $1,113,484 $389,766 $249,304 $1.16 Nov-13 $2,864,837 $1,121,690 $374,647 $227,197 $1.12 Feb-14 $3,203,314 $1,297,437 $527,073 $333,299 $1.60 May-14 $2,656,698 $1,030,885 $300,701 $187,052 $0.93 Aug-14 $2,944,905 $1,134,045 $368,741 $223,953 $1.17 Nov-14 $2,942,980 $1,128,974 $352,683 $225,408 $1.23 The Rate Hike Gets Pushed Back
Posted by Eddy Elfenbein on April 7th, 2015 at 8:03 ami thought this was an interesting chart. This is the futures contract for the September 2015 Fed funds rate. As the contract gets to 100, that means interest rates will be at 0%.
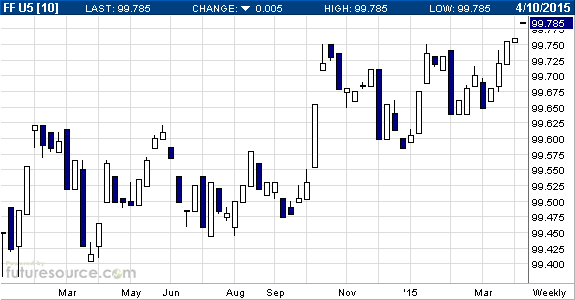
Very gradually over the past 15 months, it’s dawned on the market that interest rates probably aren’t going up anytime soon.
Morning News: April 7, 2015
Posted by Eddy Elfenbein on April 7th, 2015 at 7:14 amWorld Economy Ready to Bounce After Sluggish Opening to 2015
America Immobilized as Iran-Saudi Arabia Proxy War Turns Bloody
British Services Growth Hits Seven-Month High in March
Aussie Moving Before RBA Third Month Spurs Regulator’s Probe
Big Companies Pay Later, Squeezing Their Suppliers
Samsung’s Profit Decline Moderates
France’s Vivendi jumps Into Obstacle Race For Dailymotion
Dutch TNT Express Accepts FedEx Offer In Cut-Throat Parcel Delivery Market
Uber Is Winning Over Americans’ Expense Accounts
Boeing Beats Airbus in First Quarter Net Orders, Deliveries
Starbucks Sweetens Its College Tuition Program For Baristas
Domino’s CEO: ‘We’ve Gotta Pay More’ To Hire Good Workers
Google Accused of Using ‘Unfair and Deceptive’ Ads on YouTube Kids
Pragmatic Capitalism: Should You Be Mostly Cash Like Mohamed El-Erian?
Reformed Broker: Brian Gilmartin: The 4 Big Traits of Our Bull Market
Be sure to follow me on Twitter.
The Opening Day Market
Posted by Eddy Elfenbein on April 6th, 2015 at 3:25 pmIt’s finally Opening Day! At least for most teams.
Well, the market was supposed to go down today, but as it likes to do, the market has fooled us all. This has turned into a good day for stocks. The S&P 500 is currently up 19 points of 0.92%. Energy stocks are leading the way while Finance and Healthcare are up the least. Surprisingly, the 10-year yield is up a few basis points to 1.91%. It was as low as 1.84% this morning.
This morning we learned that the ISM Non-Manufacturing Index fell to 56.5 last month. Last week’s ISM Manufacturing report showed that the index fell for the fifth month in a row.
On our Buy List, Snap-on (SNA) and AFLAC (AFL) hit new 52-week highs this morning. Microsoft (MSFT) is up more than 3% today. Another Buy List stock, Wells Fargo (WFC), raised their rating on MSFT. The big loser is Qualcomm (QCOM). The stock was downgraded by FBR Capital. Also, a website got their hands on the Galaxy S6 and found that it doesn’t use Qualcomm’s chips.
Bloomberg has an interesting article noting that Amazon (AMZN) is luring away some of eBay’s (EBAY) loyal merchants.
Amazon’s pool of merchants climbed to more than 2 million in 2014, while the number of sellers on EBay has remained flat at about 25 million in the past two years. Businesses that at first set up online storefronts on EBay say they’re surprised how quickly sales surge on Amazon once products appear on both sites.
The move to Amazon, which boasts a bigger user base and offers more ways to ship merchandise, poses a threat to EBay, which pioneered the idea of an Internet marketplace where merchants big and small could hawk wares.
Shares of eBay are flat today.
Dividends Rose Nearly 15% Last Quarter
Posted by Eddy Elfenbein on April 6th, 2015 at 12:40 pmDividends had another solid quarter for Q1. According to numbers from Standard & Poor’s, the S&P 500 paid out $10.55 in dividends last quarter. That’s the index-adjusted number (each one point in the index is about $8.85 billion).
That’s an increase of 14.84% over the first quarter of 2014. The S&P 500 only rose 0.43% for the first quarter, or 1.76% annualized. That means that the dividend yield is increasing for stocks. The dividend yield is, of course, only one measure of value, but for now, it doesn’t signal that stocks are in bubble territory.
Dividends for the first quarter were 93% higher than they were for the first quarter of 2010. That’s an impressive growth rate for five years. The S&P 500 will probably pay out about $44 in dividends this year. What’s interesting is how closely the index has tracked a 2% dividend yield over the past several years.
Here’s a chart of the S&P 500 (left scale, black line) along with the dividends (right scale, blue line). I scaled the two lines at a ratio of 50-to-1 so whenever the lines cross, the dividend yield is exactly 2%.
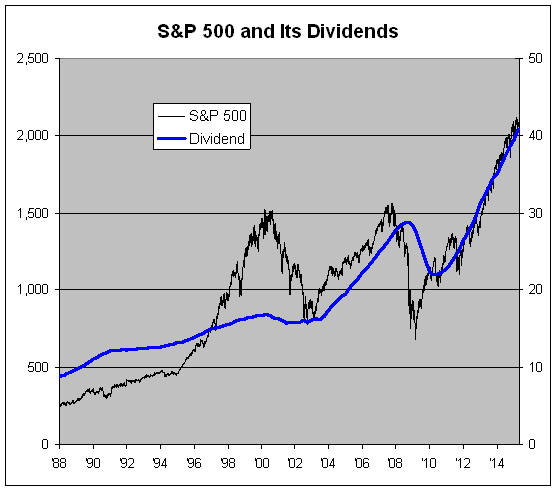
Beginning in about 2003, the blue and black lines track each other fairly well. The exception is during the financial crisis, but they soon got back together.
Again, dividend analysis is only one tool in our arsenal. But one thing I like about it is how steady the trends are, especially compared with the volatility of prices.
The Lagging S&P 100
Posted by Eddy Elfenbein on April 6th, 2015 at 10:17 amThe S&P 100 is an interesting index to watch. It’s the 100 largest companies in the S&P 100. It’s basically an index of mega-cap stocks.
While the mega-caps drove a lot of the 1990s rally, they’ve been lagging lately. Part of it is the impact of the strong dollar, but the underperformance started before that.
Here’s the S&P 100 compared with the S&P 500 since August 1, 2012:
Relative to how those two usually perform, that’s a large divergence. Yet the lines really aren’t that far apart. The point I’m making is how much the S&P 500 is dominated by the S&P 100. I believe that S&P 100 comprises about 57% of the market cap of the S&P 500.
-
Archives
- June 2026
- May 2026
- April 2026
- March 2026
- February 2026
- January 2026
- December 2025
- November 2025
- October 2025
- September 2025
- August 2025
- July 2025
- June 2025
- May 2025
- April 2025
- March 2025
- February 2025
- January 2025
- December 2024
- November 2024
- October 2024
- September 2024
- August 2024
- July 2024
- June 2024
- May 2024
- April 2024
- March 2024
- February 2024
- January 2024
- December 2023
- November 2023
- October 2023
- September 2023
- August 2023
- July 2023
- June 2023
- May 2023
- April 2023
- March 2023
- February 2023
- January 2023
- December 2022
- November 2022
- October 2022
- September 2022
- August 2022
- July 2022
- June 2022
- May 2022
- April 2022
- March 2022
- February 2022
- January 2022
- December 2021
- November 2021
- October 2021
- September 2021
- August 2021
- July 2021
- June 2021
- May 2021
- April 2021
- March 2021
- February 2021
- January 2021
- December 2020
- November 2020
- October 2020
- September 2020
- August 2020
- July 2020
- June 2020
- May 2020
- April 2020
- March 2020
- February 2020
- January 2020
- December 2019
- November 2019
- October 2019
- September 2019
- August 2019
- July 2019
- June 2019
- May 2019
- April 2019
- March 2019
- February 2019
- January 2019
- December 2018
- November 2018
- October 2018
- September 2018
- August 2018
- July 2018
- June 2018
- May 2018
- April 2018
- March 2018
- February 2018
- January 2018
- December 2017
- November 2017
- October 2017
- September 2017
- August 2017
- July 2017
- June 2017
- May 2017
- April 2017
- March 2017
- February 2017
- January 2017
- December 2016
- November 2016
- October 2016
- September 2016
- August 2016
- July 2016
- June 2016
- May 2016
- April 2016
- March 2016
- February 2016
- January 2016
- December 2015
- November 2015
- October 2015
- September 2015
- August 2015
- July 2015
- June 2015
- May 2015
- April 2015
- March 2015
- February 2015
- January 2015
- December 2014
- November 2014
- October 2014
- September 2014
- August 2014
- July 2014
- June 2014
- May 2014
- April 2014
- March 2014
- February 2014
- January 2014
- December 2013
- November 2013
- October 2013
- September 2013
- August 2013
- July 2013
- June 2013
- May 2013
- April 2013
- March 2013
- February 2013
- January 2013
- December 2012
- November 2012
- October 2012
- September 2012
- August 2012
- July 2012
- June 2012
- May 2012
- April 2012
- March 2012
- February 2012
- January 2012
- December 2011
- November 2011
- October 2011
- September 2011
- August 2011
- July 2011
- June 2011
- May 2011
- April 2011
- March 2011
- February 2011
- January 2011
- December 2010
- November 2010
- October 2010
- September 2010
- August 2010
- July 2010
- June 2010
- May 2010
- April 2010
- March 2010
- February 2010
- January 2010
- December 2009
- November 2009
- October 2009
- September 2009
- August 2009
- July 2009
- June 2009
- May 2009
- April 2009
- March 2009
- February 2009
- January 2009
- December 2008
- November 2008
- October 2008
- September 2008
- August 2008
- July 2008
- June 2008
- May 2008
- April 2008
- March 2008
- February 2008
- January 2008
- December 2007
- November 2007
- October 2007
- September 2007
- August 2007
- July 2007
- June 2007
- May 2007
- April 2007
- March 2007
- February 2007
- January 2007
- December 2006
- November 2006
- October 2006
- September 2006
- August 2006
- July 2006
- June 2006
- May 2006
- April 2006
- March 2006
- February 2006
- January 2006
- December 2005
- November 2005
- October 2005
- September 2005
- August 2005
- July 2005
 Eddy Elfenbein is a Washington, DC-based speaker, portfolio manager and editor of the blog Crossing Wall Street. His