-
CWS Market Review – April 5, 2015
Posted by Eddy Elfenbein on April 5th, 2015 at 10:31 pm“I made my money by selling too soon.” – Bernard Baruch
I’m finally back home safe and sound in Washington, DC. Although the stock market was closed for Good Friday, the government released the big March jobs report on Friday morning and it was much weaker than expected. The U.S. economy created only 126,000 net new jobs last month. That was about half of what was expected. This was the weakest jobs report in over a year, and it may change the Federal Reserve’s plans for interest rates. The futures contracts for the S&P 500 dropped about 1% on Friday.
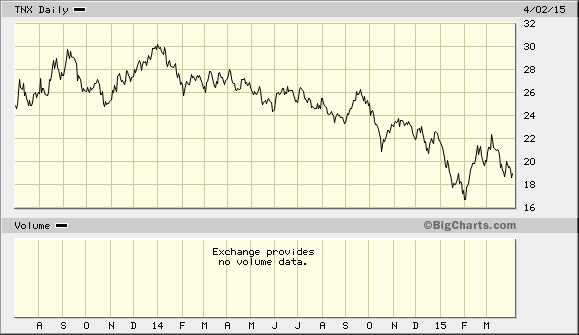
Even though the jobs report caught a lot of folks by surprise, the bond market has been rising lately. It’s often interesting how the bond market is probably the only economic forecaster worth listening to. Despite the stock market being closed, the bond market was open on Friday and it rallied. The yield on the 10-year Treasury dropped to 1.85%. In the last four weeks, the yield is down 0.39%.
What does the weak jobs report mean for the economy and our portfolios? That’s what we’ll look at in this week’s CWS Market Review. The short answer is, probably not much, but we still need to be vigilant. This is different from the vastly overstated hype about Cyprus or the Sequester. (Remember those?) I’ll also take a look at the upcoming earnings report from Bed Bath & Beyond (BBBY). Over the last nine months, the stock has had an amazing recovery. I hope it will continue, but first, let’s take a closer look at Friday’s jobs report.
The March Jobs Report Was a Bust
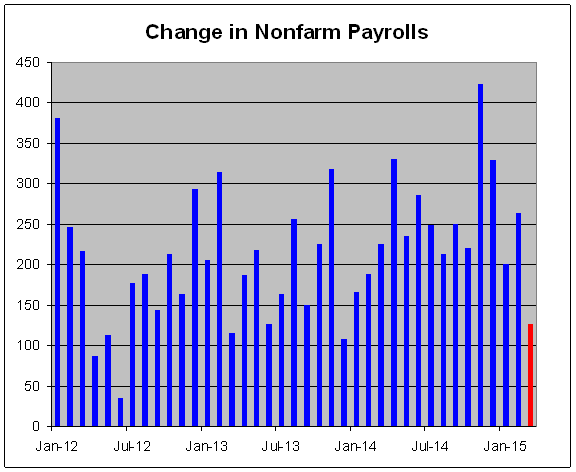
The jobs market had been on a roll the last few months which was a nice change from the past several years. Green shoots at last! The economy had been averaging more than 250,000 net new jobs each month. That’s why there was a lot of optimism going into Friday’s jobs report although the wage numbers had still been soggy. That’s also why the actual number, just 126,000 new jobs, was such a shocker. Wall Street’s consensus had been for 245,000. The numbers for January and February were also revised downward by 69,000.
What’s happening is that we’re starting to see the impact of the strong dollar on the labor market. This is crucial to understand. Sectors like construction and manufacturing saw jobs losses. Mining and Logging lost 11,000 jobs while Retail increased. Shoppers love the lower gas prices. I’ve talked a great deal about the strong dollar and until now, its impact has mostly been felt in the financial markets, but that may be changing. For example, North Dakota, the frackingest state in America, just lost its title of having the lowest unemployment rate in the country. That title now belongs to Nebraska.
Still, I don’t want to over-dramatize the jobs report. In the last year, the U.S. economy has created over three million jobs. That’s not bad. Also, the unemployment rate held steady in March at 5.5%. Just four years ago, it was 9%. Average hourly earnings rose seven cents last month. That’s the biggest increase since November. There was also the recent news that McDonald’s (MCD) has joined the trend in raising workers’ pay. The wage numbers aren’t very good, but the trend appears to be slowly changing.
So where does this leave the Federal Reserve? I continue to believe that the Fed’s rhetoric is far ahead of where the economy is. I don’t see any need for a rate hike in the next six months. In fact, the Fed can probably sit out all of 2015 and the futures market agrees with me. In short, the strong U.S. dollar has done a tightening all by itself. The economy shouldn’t have to fight both Janet Yellen and the dollar at the same time.
It’s hard to justify raising interest rates when we just sailed through a period of deflation. After rising for a bit, gasoline prices have been trending lower again, and that’s more good news for retailers. (Remember that Ross Stores will be splitting soon.) The inflation hawks could point to a recovering jobs sector but now that appears in doubt. I can’t predict what the Fed will do, but pressure to act on rates is much lower than what Janet Yellen has said. To her credit, she said after the last meeting, “Just because we removed the word ‘patient’ from the statement doesn’t mean we’re going to be impatient.” I hope so.
Now all eyes turn to Q1 earnings season which starts this week. Last earnings season, we heard company after company talk about the negative impact of the dollar. The generic report said “we’re doing well at home, but not so well overseas.” Earnings estimates have been cut back and corporate profits are expected to shrink for Q1. The pullback is expected to carry over into Q2 and Q3.
A few years ago, during the initial stages of the recovery, companies were able to grow their profits through efficiency rather than by hiring new people. It was truly a “jobless recovery.” Profits soared and jobs stagnated. That probably helped spark the Occupy Wall Street protests. More efficiency is great but you can only cut overhead so much. At some point, you need to get more folks coming in the doors and that means more consumers which means more jobs. That had been happening, and that’s why the jobs report was so disappointing.
I’ve mentioned before how Wall Street and Main Street had changed places. Main Street has been slowly recovering while the strong dollar had taken a bite out of earnings. At first, the only impact consumers saw of the strong dollar was much lower gas. Now they’re seeing the impact in new hiring.
Bloomberg notes that in the options pits, “bearish puts on the S&P 500 outnumber bullish calls by the most since October 2008.” But an earnings slowdown doesn’t necessarily mean the economy is heading towards a recession, or that stocks are going into a bear market. We’ve seen earnings pauses before.
For now, I want to stress to investors not to panic but to note that that the game has slightly changed. For example, small-cap stocks have strongly led the market over the last six months. The little guys had badly lagged in the eight months prior to that. The mega-cap S&P 100 has trailed the S&P 500 almost continuously since October 2014 (and more or less in a longer trend since September 2012).
For Q1, oil companies are expected to see their profits drop by 63%. I don’t have any energy stocks on the Buy List and that’s the way I like it. I’m staying far away from energy and materials stocks. Some stocks on our Buy List that look especially good right now include Ford (F), Microsoft (MSFT), eBay (EBAY) and Cognizant Technology Solutions (CTSH). I’m expecting another good earnings season for our Buy List, but I suspect that many of our stocks will give cautious outlooks for Q2. Now let’s look at our one remaining Buy List earnings report from Q4.
Bed Bath & Beyond Is a Buy up to $77 per Share
This coming Wednesday, April 8, Bed Bath & Beyond (BBBY) will report their fiscal Q4 earnings. That’s the big holiday quarter; it covers December, January and February. Like most retailers, this holiday shopping season is vital for BBBY. The holiday quarter usually generates about one-third of BBBY’s annual profit.
After hitting a rough patch, BBBY has gotten back on track. Three months ago, the home furnishings retailers reported Q3 earnings that matched Wall Street’s forecast. Curiously, the company released its Q4 forecast after the Q2 earnings report in September. BBBY said they expect Q4 earnings to range between $1.78 and $1.83 per share. In January, I was pleased to see them reiterate that forecast. They had developed a poor habit of issuing overly optimistic forecasts only to lower them later on.
For the entire fiscal year, Bed Bath & Beyond expects earnings between $5.05 and $5.09 per share. That’s up from $4.79 per share the year before. Frankly, I’ve been a bit worried about their operating margins. Some slippage is understandable, but this could become a problem.
Bed Bath & Beyond’s earnings have been dramatically impacted by share buybacks. I often say that I’m not a fan of buybacks, but I’m less judgmental on companies like BBBY that actually reduce their share count. The company floated a bond last year to fund the buybacks. Standard & Poor’s raised their rating on Bed Bath & Beyond from BBB+ to AAA-.
I’m not expecting blowout results. The company’s guidance sounds about right. What I’m looking for is steady improvement. They’ll also give us guidance for Q1. I’m expecting something in the range of 95 cents to $1 per share. This is a very good company. I currently rate Bed Bath & Beyond a buy up to $77 per share.
Buy List Updates
Shares of Express Scripts (ESRX) spiked higher this week after UnitedHealth (UNH) said it was buying Catamaran (CTRX) for $12.8 billion. Traders assume that one buyout must lead to several more. Actually, this can be the case as other players react but it doesn’t happen so quickly. At one point on Tuesday, ESRX got as high as $88.55 per share. Express Scripts remains a good buy up to $89 per share.
Snap-on (SNA), one of our new buys this year, has been rallying of late. The stock touched a new 52-week high last week. The last earnings report was outstanding and I’m looking forward to another one in a few weeks. This week, I’m raising my Buy Below on Snap-on to $151 per share.
I also want to bump up our Buy Below on AFLAC (AFL). The soaring dollar story has pretty much abated vis-a-vis the Japanese yen. Over the last four months, the yen has largely stabilized around 118 to 120 to the dollar. AFLAC also offers a nice yield of 2.45%. Look for another good earnings report later this month. I’m raising my Buy Below to $65 per share.
That’s all for now. Earnings season begins this week. Alcoa (AA) will be the first major company to report on Tuesday. Bed Bath & Beyond (BBBY) will also report on Tuesday but that’s for the quarter that ended in February. The following the Tuesday, April 14, Wells Fargo (WFC) will be our first Buy List stock to report Q1 earnings. On Wednesday, the Federal Reserve will release the minutes from their March meeting, when they dropped “patience” from the policy statement. It will be interesting to see how much debate there was on this point. Given Friday’s jobs report, the policy doves may now have the upper hands. Be sure to keep checking the blog for daily updates. I’ll have more market analysis for you in the next issue of CWS Market Review!
– Eddy
-
Delayed CWS Market Review
Posted by Eddy Elfenbein on April 3rd, 2015 at 9:16 amI’m home safe and sound from my two-week vacation in the Philippines. I had a great time. The flight home was fine but very long.
I’m pretty tired right now, but I hope to send out the CWS Market Review later this weekend.
-
Big Jobs Miss
Posted by Eddy Elfenbein on April 3rd, 2015 at 9:08 amThe government reported this morning that the U.S. economy created just 126,000 net new jobs last month. That was well below expectations of 245,000 jobs.
This is the worst jobs report since December 2013. The unemployment rate held steady at 5.5%. The NFP numbers for January and February were also revised downward.
The stock market is closed today, but the bond market is rallying this morning. Hopefully this news will add more pressure on the Federal Reserve to delay raising interest rates.
It’s always interesting to see how the bond market is ahead of everyone. The 10-year yield started to climb earlier this year. It got as high as 2.26% on March 6, but it has been falling ever since. We may go below 1.8% very soon.
Average hourly earnings rose by 0.3% last month. That’s not bad.
-
Morning News: April 3, 2015
Posted by Eddy Elfenbein on April 3rd, 2015 at 7:05 amStampede to Join China’s Development Bank Stuns Even Its Founder
Greece Says Ready to Make IMF Payment on April 9
Cyprus to Lift All Capital Controls Monday: President Nicos Anastasiades
Antitrust and Other Inquiries in Europe Target U.S. Tech Giants
Oil Falls Nearly 4% After Tentative Nuclear Deal for Iran
What the Nuclear Accord Means for Business Opportunities in Iran
Solid US Job Growth Is Expected Today Despite a Weak Economy
What to Expect From the March Jobs Report
The 5 Things Walmart Actually Needs To Do With Its Battered Supplier Base
China’s Alibaba Finance Arm, Xiaomi Partner in Wearable Payments
Samsung Said to Win Apple A9 Chip Orders for Next iPhone
How Can I Build Credit When I Am New to the USA?
Roger Nusbaum: Is A Lost Decade For Performance Coming?
Joshua Brown: If You Have Nothing Nice to Say…
Be sure to follow me on Twitter.
-
Morning News: April 2, 2015
Posted by Eddy Elfenbein on April 2nd, 2015 at 7:17 amSamaras Says He’d Join Alliance to Keep Greece in Euro
Global Trade Lags As China Makes Its Own Inroads
Prosecutors Ease Crackdown on Buyers of China-Bound Luxury Cars
EU Regulators Probe Apple’s Music Streaming Plans in Europe
Kraft Foods Emails Lay Out Plan to Depress U.S. Wheat Prices – CFTC
Pfizer to Cease Vaccine Sales Business in China
Target to Shutter Last of Canadian Stores by April 12
Airbnb Is Now Available in Cuba
McDonald’s to Raise Pay at Outlets It Operates
Walmart Emerges as Unlikely Social Force
Sears’s $2.5 Billion REIT Plan May Be Blueprint for Future Deals
HSBC Is Deemed Slow to Carry Out Changes
JPMorgan Chase On Track to Pay $9 Billion to Homeowners as Part of Settlement
Jeff Carter: Should You Own Distribution, or Broker It?
Cullen Roche: Bernanke’s Misguided Global Savings Glut Hypothesis
Be sure to follow me on Twitter.
-
Morning News: April 1, 2015
Posted by Eddy Elfenbein on April 1st, 2015 at 7:09 amMario’s Magic is Working: Eurozone GDP Set for Best Quarter Since 2011
Why Markets May Shrug Off a Greek Tragedy
Warren Buffett Thinks Greece Leaving the Euro Would Not Be A Bad Idea
European Factories Buoyant But Weak Asia Adds to Stimulus Calls
Vietnam Labor Unrest Over Pension Change Spreads to Second Plant
Oil Trades Near One-Week Low as Iran Talks Extend Past Deadline
North Dakota’s New Oil Train Safety Checks Miss Risks, Experts Warn
CBRE to Purchase Johnson Controls’ Global WorkPlace Solutions Business for $1.475 Billion
Sears to Partner with General Growth Properties on Real-Estate Joint Venture
Bright House Deal Advances Malone’s Cable Ambitions
GoDaddy Prices IPO at $20 Per Share
Simon Withdraws $16.8-Billion Offer for Macerich After Rejection
The Gift That Keeps On Giving–HP Sues Autonomy Executives For Fraud (And Execs Do So In Return)
Joshua Brown: Chart o’ the Day: How Dispersion Stole the Alpha
John Hempton: Poor Charlie’s Counterattack
Be sure to follow me on Twitter.
-
Q1 Is on the Books
Posted by Eddy Elfenbein on March 31st, 2015 at 7:41 pmI’m still on the road but I wanted to update you now that the first quarter of 2015 is officially over. For the first three months of the year, the S&P 500 gained 0.44% while our Buy List gained 3.26%.
Fifteen of our 20 stocks are up for the year. The big winner is Cognizant with an 18.48% gain. The three biggest losers are all big tech names: MSFT, ORCL and QCOM. I’m happy to see that all five of our new buys are beating the market.
With dividends, the S&P 500 was up 0.95% for the quarter. With dividends, the Buy List was up 3.55% for the quarter.
-
Morning News: March 31, 2015
Posted by Eddy Elfenbein on March 31st, 2015 at 7:08 amGreece, EU/IMF Lenders End Round of Technical Talks Without Deal
Greece Looks to Russia As Deal With Europe Stumbles
It’s Normal That UK GDP Is Still Below Pre-Crisis Levels
Japan Says Not Bound By Deadline to Join AIIB, And Not Yet Decided
China to Introduce Bank Deposit Insurance From May
China Appears to Attack GitHub by Diverting Web Traffic
Iran Nuclear Envoys Near Outline Agreement, Buy More Time
Oil Heads for Third Quarterly Drop as Iran Deal Deadline Looms
Here Comes a New Wave of Billion-Dollar Hedge Funds
Prosecutors Scrutinize Minority Borrowers’ Auto Loans
Philips Sells 80.1% of Lighting Components Unit For $2.8 Billion
Tesla to Unveil New Product-Likely a Battery-Next Month
The Geek of Chic Aims High As Yoox Merges With Net-A-Porter
Jeff Carter: The Great Unbundling
Roger Nusbaum: First Quarter Closing On A Deceptively Volatile Note
Be sure to follow me on Twitter.
-
Morning News: March 30, 2015
Posted by Eddy Elfenbein on March 30th, 2015 at 7:19 amForecasters Shrug Off Winter Economic Blues
China Stocks Surge to 7-year Highs on Silk Road Building Project, Easing Hopes
Amid Yemen Chaos, China Keeps Oil Shipments Flowing
Japan Clips Thailand’s Wings With Airline Ban
Consumer Spending in U.S. Rose Less Than Forecast in February
Bernanke Will Blog on Economics, Finance and Sometimes Baseball
UnitedHealth Buys Catamaran for $12.8 Billion for Drug Benefits
Teva to Buy Auspex to Bolster Central-Nervous-System Business
Horizon Pharma Offers to Acquire Hyperion Therapeutics for $1.1 Billion
Dufry to Undertake Bid For All of Its Rival, World Duty Free
News Companies See Movies as Opportunity for Growth
Fidelity Moves to End DuPont Proxy Battle
Big Oil Pressured Scientists Over Fracking Wastewater’s Link to Quakes
Joshua Brown: Confusing Today’s Liquidity With Tomorrow’s
Jeff Miller: Weighing the Week Ahead: Time For an Economic Spring Thaw?
Be sure to follow me on Twitter.
-
No Back-to-Back Gains
Posted by Eddy Elfenbein on March 27th, 2015 at 9:55 amHere’s a closer look at a stat I mentioned in today’s newsletter. The S&P 500 hasn’t had back-to-back up days since February 13-17. That’s a run of 27 days which is the longest such streak in more than 20 years.
Update: Our friends over at Bespoke ran the numbers: “After taking into account the fact that the S&P 500 won’t make back-to-back gains today (we didn’t have an up day yesterday) we’re now at a 28-day streak without gains on consecutive trading days. It turns out that this is incredibly rare: it has only happened twice since World War 2!”
-
Archives
- August 2026
- July 2026
- June 2026
- May 2026
- April 2026
- March 2026
- February 2026
- January 2026
- December 2025
- November 2025
- October 2025
- September 2025
- August 2025
- July 2025
- June 2025
- May 2025
- April 2025
- March 2025
- February 2025
- January 2025
- December 2024
- November 2024
- October 2024
- September 2024
- August 2024
- July 2024
- June 2024
- May 2024
- April 2024
- March 2024
- February 2024
- January 2024
- December 2023
- November 2023
- October 2023
- September 2023
- August 2023
- July 2023
- June 2023
- May 2023
- April 2023
- March 2023
- February 2023
- January 2023
- December 2022
- November 2022
- October 2022
- September 2022
- August 2022
- July 2022
- June 2022
- May 2022
- April 2022
- March 2022
- February 2022
- January 2022
- December 2021
- November 2021
- October 2021
- September 2021
- August 2021
- July 2021
- June 2021
- May 2021
- April 2021
- March 2021
- February 2021
- January 2021
- December 2020
- November 2020
- October 2020
- September 2020
- August 2020
- July 2020
- June 2020
- May 2020
- April 2020
- March 2020
- February 2020
- January 2020
- December 2019
- November 2019
- October 2019
- September 2019
- August 2019
- July 2019
- June 2019
- May 2019
- April 2019
- March 2019
- February 2019
- January 2019
- December 2018
- November 2018
- October 2018
- September 2018
- August 2018
- July 2018
- June 2018
- May 2018
- April 2018
- March 2018
- February 2018
- January 2018
- December 2017
- November 2017
- October 2017
- September 2017
- August 2017
- July 2017
- June 2017
- May 2017
- April 2017
- March 2017
- February 2017
- January 2017
- December 2016
- November 2016
- October 2016
- September 2016
- August 2016
- July 2016
- June 2016
- May 2016
- April 2016
- March 2016
- February 2016
- January 2016
- December 2015
- November 2015
- October 2015
- September 2015
- August 2015
- July 2015
- June 2015
- May 2015
- April 2015
- March 2015
- February 2015
- January 2015
- December 2014
- November 2014
- October 2014
- September 2014
- August 2014
- July 2014
- June 2014
- May 2014
- April 2014
- March 2014
- February 2014
- January 2014
- December 2013
- November 2013
- October 2013
- September 2013
- August 2013
- July 2013
- June 2013
- May 2013
- April 2013
- March 2013
- February 2013
- January 2013
- December 2012
- November 2012
- October 2012
- September 2012
- August 2012
- July 2012
- June 2012
- May 2012
- April 2012
- March 2012
- February 2012
- January 2012
- December 2011
- November 2011
- October 2011
- September 2011
- August 2011
- July 2011
- June 2011
- May 2011
- April 2011
- March 2011
- February 2011
- January 2011
- December 2010
- November 2010
- October 2010
- September 2010
- August 2010
- July 2010
- June 2010
- May 2010
- April 2010
- March 2010
- February 2010
- January 2010
- December 2009
- November 2009
- October 2009
- September 2009
- August 2009
- July 2009
- June 2009
- May 2009
- April 2009
- March 2009
- February 2009
- January 2009
- December 2008
- November 2008
- October 2008
- September 2008
- August 2008
- July 2008
- June 2008
- May 2008
- April 2008
- March 2008
- February 2008
- January 2008
- December 2007
- November 2007
- October 2007
- September 2007
- August 2007
- July 2007
- June 2007
- May 2007
- April 2007
- March 2007
- February 2007
- January 2007
- December 2006
- November 2006
- October 2006
- September 2006
- August 2006
- July 2006
- June 2006
- May 2006
- April 2006
- March 2006
- February 2006
- January 2006
- December 2005
- November 2005
- October 2005
- September 2005
- August 2005
- July 2005
 Eddy Elfenbein is a Washington, DC-based speaker, portfolio manager and editor of the blog Crossing Wall Street. His