-
Stryker Approves $2 Billion in Buybacks
Posted by Eddy Elfenbein on March 4th, 2015 at 9:34 amStryker (SYK) just said that its board approved a $2 billion buyback of its shares. The company has a market cap of $35 billion so that’s a sizeable amount.
Chairman and Chief Executive Kevin A. Lobo said merger-and-acquisition activity across the company’s offerings remains the primary focus of Stryker’s long-term growth strategy, and that the stock-buyback authorization “recognizes that the strength of our balance sheet is sufficient to enable more significant share repurchases.”
Since Thanksgiving, the shares have mostly bounced between $90 and $96. A few weeks ago, Stryker raised its dividend by 13%.
-
Morning News: March 4, 2015
Posted by Eddy Elfenbein on March 4th, 2015 at 7:07 amUK Wins in European Central Bank Court Challenge
Japan’s Growth in Solar Power Falters as Utilities Balk
India’s Sensex Drops With Rupee as Investors Bet Gains Overdone
U.S. Companies Are Stashing $2.1 Trillion Overseas to Avoid Taxes
The Price of Oil Is About to Blow a Hole in Corporate Accounting
Harsh Winter Weather Bit Into U.S. Auto Sales in February
Standard Chartered Profit Fell 37% in 2014
Citigroup to Sell Its Subprime Lender OneMain to Springleaf for $4.25 Billion
Toyota Moves Mark Step Forward for Non-Japanese Executives
Uber Buys Mapping Startup deCarta
Target to Cut Several Thousand Jobs
Britain Agrees Sale of Eurostar Stake to British, Canadian Funds
Equity Firms Are Lending to Landlords, Signaling a Shift
Beware the “Passive” Wolf in Sheep’s Clothing
Be sure to follow me on Twitter.
-
Mylan’s Earnings
Posted by Eddy Elfenbein on March 3rd, 2015 at 12:07 pmMylan (MYL) just reported Q4 earnings $1.05 per share which matched Wall Street’s estimate. Quarterly revenue rose 15% to $2.08 billion which beat consensus by $10 million.
I like to keep an eye on Mylan because it’s one of the great long-term performers. Since 1978, shares of Mylan are up 403,641% compared with 2,196% for the S&P 500. That’s amazing.
Four years ago, Mylan said they expect to double their profit by 2018:
Mylan said its sees EPS for this year ranging between $2.30 and $2.50. That’s a growth rate of 13% to 23%. It also means the stock is going for less than 10 times earnings. For next year, Mylan sees earnings of $2.75 per share. For 2018, Mylan said that its goal is earnings of $6 per share.
Let’s see how they’re doing. That forecast for 2012 was quite modest. Mylan actually earned $2.59 per share. They then beat the $2.75 per share forecast for 2013 by 12 cents per share. Mylan earned $3.56 per share last year, and expects to earn between $4.00 and $4.30 this year.
Let’s assume they hit the middle of their forecast range for this year. That means Mylan needs to grow earnings by 13.1% per year for the next three years to hit $6 per share by 2018. That’s quite possible, so that optimistic forecast from 2012 seems very doable.
People spend so much time looking for great stocks. Four years ago, Mylan was a bargain hidden in plain sight.
-
80 Years of Buy-and-Hold
Posted by Eddy Elfenbein on March 3rd, 2015 at 10:04 amI thought I was strict with my policy of only changing five stocks a year on our Buy List, but the Voya Corporate Leaders Trust Fund hasn’t bought a new stock in 80 years.
Some of its holdings are unchanged, including DuPont, General Electric, Procter & Gamble and Union Pacific. Others were spun off from or acquired from original components, including Berkshire Hathaway (successor to the Atchison Topeka and Santa Fe Railway); CBS (acquired by Westinghouse Electric and renamed); and Honeywell (which bought Allied Chemical and Dye). Some are just gone, including the Pennsylvania Railroad Co. and American Can. Twenty-one stocks remain in the fund.
The plan is simple, and the results have been good. Light on banks and heavy on industrials and energy, the fund has beaten 98 percent of its peers, known as large value funds, over both the past five and ten years, according to Morningstar.
“This fund has been around a lot longer than I have, and it’s working,” said Craig Watkins, 29, an investment analyst for Conover Capital Management in Bellevue, Washington. Conover has recommended the Voya fund to 401(k) plans it advises.
Watkins compared the Voya fund’s “deep-value” approach to investor Warren Buffett’s, whose Berkshire Hathaway is the fund’s second-largest holding.
“It’s deep-value in the sense that all the companies in the portfolio have an amazing tenure,” Watkins said. He said the Voya fund’s strategy can be better than an index fund because it doesn’t have to change its weightings when the index changes
-
The S&P 500 and Its Earnings
Posted by Eddy Elfenbein on March 3rd, 2015 at 9:17 amHere’s a look at the S&P 500 along with its earnings line. The S&P 500 is in black and it follows the left scale. The earnings line is in gold and it follows the right scale. The two lines are scaled at a ratio of 16-to-1 which means that whenever the lines cross, the market’s P/E Ratio is exactly 16. I don’t mean to imply that the market is fairly valued at 16 to 1. It’s simply a guidepost for this chart. The future part of the earnings line is based on analysts’ estimates.
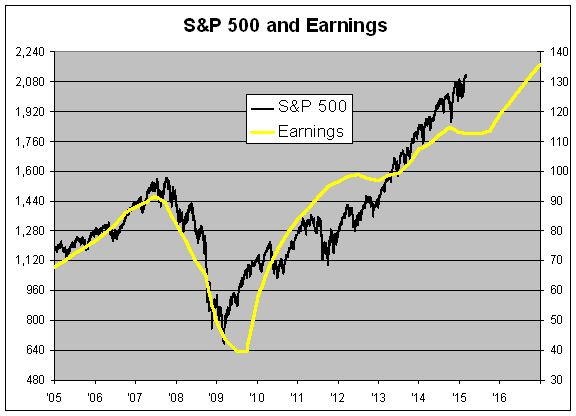
As you can see, the earnings for the S&P 500 have entered a slight rough patch. Earnings growth is expected to flatline from Q4 of 2014 through Q3 of 2015. This isn’t unprecedented, even in this bull market. Earnings stagnated for the last half of 2012 and the first half of 2013, but the market did quite well.
Starting in Q4 of this year, earnings growth is expected to ramp up again. I should add that I don’t trust the longer-term forecasts of analysts, but it’s interesting to see what the crowd expects. I also think it’s interesting how the long-term forecast usually boils down to returning to the trendline. Notice how nice and neat the last part of the yellow line is? Only a model could forecast that.
In 2012 and 2013, the market bet that the earnings slowdown was transitory, and they were right. They’re making a similar bet now, but the difference is that the market is more richly valued today. See how the black line is currently well above the yellow line as opposed to mid-2012.
If the analysts’ forecast is correct (HA!) and if the market trades at 16 times earnings at the end of 2016, that means the S&P 500 would gain less than 3% over the next 22 months.
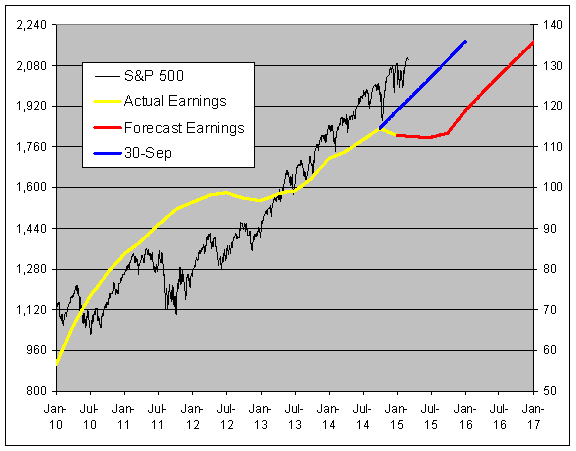
Here’s the same chart again but with data since the beginning of 2010. I made two other changes. The future part of the earnings line is in red, and the blue line was the earnings forecast on September 30. I think most of the earnings downgrade is due to the stronger dollar. Simply put: It knocked a year off earnings growth.
-
Morning News: March 3, 2015
Posted by Eddy Elfenbein on March 3rd, 2015 at 7:10 amEuropean Stocks Gain as German Retail Sales Rise
Draghi’s QE Moves to Starting Line as Outlook Brightens
CNPC Employee Lambastes China’s Pollution Documentary, Says Its Producer Doesn’t Have Brainpower
Nasdaq Math: 5000 Doesn’t Equal 2000
Dollar Bulls Are Undone as Yellen Turns Foe
Gold Above $1,200 as Dollar Eases, U.S. Rate Outlook Caps Gains
Springleaf Agrees to $4.25 Billion Deal for Citigroup’s OneMain
Barclays, Weighed Down by Litigation Charges, Reports Annual Loss
All-Touch BlackBerry Leap Launches With $275 Price Tag
Costco Picks Visa and Citigroup as New Credit Card Partners
Glencore 2014 Profit In Line, Takes $1.1 Billion Charge on Commodity Prices
Cardinal Health to Buy J&J’s Heart Business
Why Warren Buffett Is Worth $72 Billion and You’re Not
Cullen Roche: Raising Interest Rates Might not be as Crazy as Some Make it Seem
Roger Nusbaum: Negative Yields Proliferate in Europe
Be sure to follow me on Twitter.
-
Nasdaq 5,000
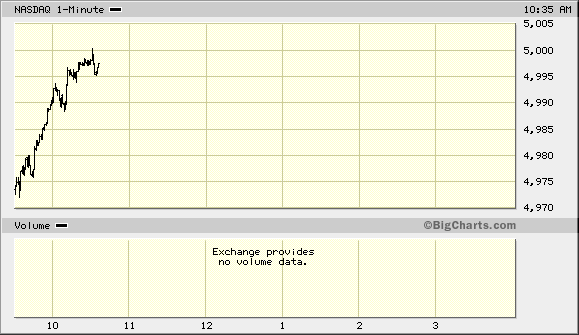
Posted by Eddy Elfenbein on March 2nd, 2015 at 10:38 amAlmost 15 years to the day, the Nasdaq hits 5,000:
-
Dividend Returns to Investors
Posted by Eddy Elfenbein on March 2nd, 2015 at 10:14 amHere’s an interesting chart you don’t see often. This is the return to investors from dividends.
This is different from the market’s dividend yield, and it’s more accurate. This tells us how much money actually went to investors solely from dividends.
I took the Wilshire 5000 Total Return Index and divided it by the regular Wilshire 5000. I then saw how much that had changed in the last year.
In plainer terms, this isn’t just indicated dividend yield, what you most often see; it’s the dividend yield adjusted for increases or decreases in those dividends.
During the worst of the financial crisis, the market’s indicated dividend yield rose to 4% or so. But that’s based on trailing dividends — what had been paid out. But those payouts were cut. In real terms, dividends yielded investors 2.55%.
-
February ISM = 52.9
Posted by Eddy Elfenbein on March 2nd, 2015 at 10:05 amThe February ISM came in at 52.9. That’s low but still in the comfort zone. The ISM has now fallen for four straight months. The “danger area” is around the mid-40s so we’re still above that.
-
Growing Divide at the FOMC
Posted by Eddy Elfenbein on March 2nd, 2015 at 9:54 amThe Federal Open Market Committee is an unusual organization in that it has members from the Federal Reserve Board and also the regional bank presidents. They’re not the same thing and they sometimes conflict.
Janet Yellen places a high premium on consensus, which is probably misplaced. In Washington, people seem to like consensus for the sake of saying they have a consensus.
Lately, however, the reserve bank presidents have grown more hawkish about monetary policy. They think interest rates will need to rise by the middle of the year. But the Fed governors are much more reluctant. I understand the hawks’ view that deflation will soon pass, but I think there needs to be more evidence of that. But there has been more evidence that workers’ pay has increased. Plus there’s been high-profile news such as the workers at Walmart getting raises.
Seven of the Fed’s current 17 members have now said they at least want the option of a June tightening on the table, or have pushed in general for an earlier increase amid an expectation that wages and inflation will turn higher.
By contrast, there’s a dwindling core of officials who say publicly that the economy and labour markets in particular still have a long way to go — only four Fed members have in recent weeks clearly said that rate hikes won’t be appropriate until much later in the year or even into 2016.
The five members of the Fed’s Washington-based board of governors, including Yellen, have spoken less definitively, though governors including Jerome Powell have said they expected strong job growth to continue. Not all of the seven who point to June vote this year on the Fed’s ten-member policy setting committee, but all participate in policy discussions.
The FOMC meets again later this month and is expected to removed the “patient” wording from its policy statement. I bet Yellen isn’t thrilled about that move but for consensus reasons, she may have to go along. The last time the Fed raised rates was June 2006. The futures market currently thinks a rate increase will come in September or October.
Why are higher rates so important? It all comes down to competition. Higher short-term rates provide strong incentive for investors’ money. When rates are at 0% and many stocks yield 2%, then the stock market is a no-brainer. But when they both get you 2%, then you need to be a lot more careful.
-
Archives
- July 2026
- June 2026
- May 2026
- April 2026
- March 2026
- February 2026
- January 2026
- December 2025
- November 2025
- October 2025
- September 2025
- August 2025
- July 2025
- June 2025
- May 2025
- April 2025
- March 2025
- February 2025
- January 2025
- December 2024
- November 2024
- October 2024
- September 2024
- August 2024
- July 2024
- June 2024
- May 2024
- April 2024
- March 2024
- February 2024
- January 2024
- December 2023
- November 2023
- October 2023
- September 2023
- August 2023
- July 2023
- June 2023
- May 2023
- April 2023
- March 2023
- February 2023
- January 2023
- December 2022
- November 2022
- October 2022
- September 2022
- August 2022
- July 2022
- June 2022
- May 2022
- April 2022
- March 2022
- February 2022
- January 2022
- December 2021
- November 2021
- October 2021
- September 2021
- August 2021
- July 2021
- June 2021
- May 2021
- April 2021
- March 2021
- February 2021
- January 2021
- December 2020
- November 2020
- October 2020
- September 2020
- August 2020
- July 2020
- June 2020
- May 2020
- April 2020
- March 2020
- February 2020
- January 2020
- December 2019
- November 2019
- October 2019
- September 2019
- August 2019
- July 2019
- June 2019
- May 2019
- April 2019
- March 2019
- February 2019
- January 2019
- December 2018
- November 2018
- October 2018
- September 2018
- August 2018
- July 2018
- June 2018
- May 2018
- April 2018
- March 2018
- February 2018
- January 2018
- December 2017
- November 2017
- October 2017
- September 2017
- August 2017
- July 2017
- June 2017
- May 2017
- April 2017
- March 2017
- February 2017
- January 2017
- December 2016
- November 2016
- October 2016
- September 2016
- August 2016
- July 2016
- June 2016
- May 2016
- April 2016
- March 2016
- February 2016
- January 2016
- December 2015
- November 2015
- October 2015
- September 2015
- August 2015
- July 2015
- June 2015
- May 2015
- April 2015
- March 2015
- February 2015
- January 2015
- December 2014
- November 2014
- October 2014
- September 2014
- August 2014
- July 2014
- June 2014
- May 2014
- April 2014
- March 2014
- February 2014
- January 2014
- December 2013
- November 2013
- October 2013
- September 2013
- August 2013
- July 2013
- June 2013
- May 2013
- April 2013
- March 2013
- February 2013
- January 2013
- December 2012
- November 2012
- October 2012
- September 2012
- August 2012
- July 2012
- June 2012
- May 2012
- April 2012
- March 2012
- February 2012
- January 2012
- December 2011
- November 2011
- October 2011
- September 2011
- August 2011
- July 2011
- June 2011
- May 2011
- April 2011
- March 2011
- February 2011
- January 2011
- December 2010
- November 2010
- October 2010
- September 2010
- August 2010
- July 2010
- June 2010
- May 2010
- April 2010
- March 2010
- February 2010
- January 2010
- December 2009
- November 2009
- October 2009
- September 2009
- August 2009
- July 2009
- June 2009
- May 2009
- April 2009
- March 2009
- February 2009
- January 2009
- December 2008
- November 2008
- October 2008
- September 2008
- August 2008
- July 2008
- June 2008
- May 2008
- April 2008
- March 2008
- February 2008
- January 2008
- December 2007
- November 2007
- October 2007
- September 2007
- August 2007
- July 2007
- June 2007
- May 2007
- April 2007
- March 2007
- February 2007
- January 2007
- December 2006
- November 2006
- October 2006
- September 2006
- August 2006
- July 2006
- June 2006
- May 2006
- April 2006
- March 2006
- February 2006
- January 2006
- December 2005
- November 2005
- October 2005
- September 2005
- August 2005
- July 2005
 Eddy Elfenbein is a Washington, DC-based speaker, portfolio manager and editor of the blog Crossing Wall Street. His