-
CWS Market Review – February 6, 2015
Posted by Eddy Elfenbein on February 6th, 2015 at 7:08 am“When it comes to investing, my suggestion is to first understand your strengths and weaknesses, and then devise a simple strategy so that you can sleep at night.”
– Walter SchlossOur Buy List is starting to respond well to earnings. On Wednesday, shares of Cognizant Technology Solutions ($CTSH) gapped up more than 5% after the company’s earnings report. Then on Thursday, Snap-on ($SNA) and Ball Corp. ($BLL) both surged higher. At one point, Ball was up more than 11% on the day.
Earlier in the week, AFLAC ($AFL) gained strength after its earnings report came out, as did Fiserv ($FISV) which broke out to a new 52-week high. For the first four days of this week, our Buy List gained 5.03%, outpacing the 3.38% from the S&P 500. We have a modest profit on the year, and we’re beating the market as well. As always, we don’t want to get too excited about short-term victories. Instead, we’re focused on the long-term.
In this week’s CWS Market Review, I want to run down our recent earnings reports. It’s been a busy week. But first, I want to discuss an important shift that’s happening in the economy.
Expect Flat Earnings Growth This Year
What’s happened lately with the economy is that consumers and businesses have basically switched places. From 2010 through 2013, corporate profits were very strong, but consumers were struggling. There seemed to be a big disconnect between Main Street and Wall Street as the stock market zoomed ahead while wages and job growth stagnated. I think that may have played a part in the emergence of the Occupy Wall Street movement.
Lately, however, consumers have woken up. The unemployment rate is below 6%, and last year was the best year for payroll employment growth since 1999. Mind you, I’m not saying all is well for the economy, but I am saying that some lines have finally started moving in the right direction.
For businesses, it’s been a different story. The last two reports on durable goods were negative. Industrial production and factory orders are down as well. The recent ISM was decent, but nothing great. But the biggest change has been the dramatic lowering of earnings expectations. Just a few weeks ago, Wall Street had been very optimistic for Q4 earnings. It’s like having a first and goal on the five-yard line with 1:06 to play. What’s the worst that could happen?
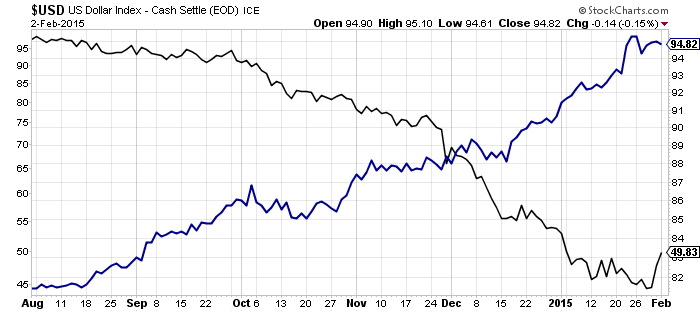
Well, the dollar—that’s what. The surging U.S. dollar and collapsing oil prices have dramatically changed the outlook for corporate earnings growth. Guidance from companies hasn’t been this poor since the depths of the Financial Crisis. At the end of the Q3, Wall Street had been expecting Q4 earnings of $32.24 (that’s the index-adjusted number). Now it looks like it will be about $27.64. That’s a big cut. At the end of Q3, the Street was expecting full-year earnings for 2015 of $136.07. That’s now down to $119.76. That’s a 12% cut in four months. Stock prices haven’t responded nearly as much.
The lion’s share of that cutting has been in energy stocks. Three months ago, Wall Street had been expecting ExxonMobil ($XOM) to earn $7.50 per share for 2015. That’s now down to $5.41 per share. People don’t exactly sympathize when Big Oil is struggling, but remember that Exxon’s woes will translate into lower capex spending which will eventually be felt across the broader economy.
The question now is, how much will corporate earnings suffer? I suspect that the benefits of lower oil will largely cancel out the costs of the rising greenback. For the next few quarters, I think overall corporate profit growth will be low but positive. Think 2% to 5%. Of course, some companies will manage themselves better than others during a flat environment. In fact, we’re starting to notice that with the results of our Buy List stocks. Having said that, let’s take a closer look at our recent earnings news.
Our Recent Buy List Earnings Reports
Last Friday, Moog ($MOG-A) reported fiscal Q1 earnings of 86 cents per share. It’s interesting how this earnings report was a microcosm of so much that’s been going on. Sales for the quarter dropped 2% compared with a year ago, but that was largely due to the dollar. Net earnings rose 10%, but earnings per share was up 23%. Why? Because Moog has been gobbling back its own shares at a rapid clip.
Last quarter’s earnings were basically fine. Moog missed consensus by a penny per share. It’s basically good execution, but in a poor environment. The bad news was their guidance. In October, Moog projected full-year earnings of $4.25 per share. Now they’re saying it will be $3.85 per share—$3.95 if you include buybacks. They earned $3.52 per share last year.
CEO John Scannell said, “On a positive note, earnings came in slightly ahead of our forecast, and cash was very strong. However, during the quarter we started to feel the impact of three macroeconomic headwinds, the strengthening of the U.S. dollar, the industrial malaise outside the U.S. and the sharp and sustained drop in the price of oil. As a result, we are introducing some caution in our forecast and revising our outlook for the remainder of fiscal ’15 downward. Despite these challenges, we are still forecasting fiscal ’15 to be another year of strong cash flow and record earnings per share.”
The stock got tripped up after the earnings report, but it’s since stabilized in the low $70’s. There’s nothing at all wrong with Moog, but I’m going to lower my Buy Below price to $76 per share. This is a good, conservative stock.
On Tuesday, Fiserv ($FISV) reported Q4 earnings of 89 cents per share, which hit expectations on the nose. I like this company a lot. For all of 2014, they earned $3.37 per share, to notch their 29th year in a row of double-digit adjusted EPS growth. That’s amazing.
In last week’s CWS Market Review, I said I was curious to hear any guidance for this year. This week, Fiserv said they expect internal revenue growth of 5% to 6% for 2015. They also expect earnings per share to range between $3.73 and $3.83. That represents a growth rate of 11% to 14%, so the earnings streak should continue. The shares gapped up more than 4% this week, and on Thursday, Fiserv hit a new all-time high. This week, I’m raising our Buy Below on Fiserv to $80 per share. This is a solid stock.
Also on Tuesday, AFLAC ($AFL) reported more of the same. On a nuts-and-bolts basis, the duck stock is doing just fine; the problem is the weak yen. For Q4, AFLAC reported operating earnings of $1.29 per share. For insurance companies, it’s better to look at operating earnings rather than net earnings. That result also matched Wall Street’s estimate. AFLAC said that the weak yen cost them eight cents per share quarter. That’s actually lower than I thought.
For all of 2014, AFLAC had operating earnings of $6.16 per share. The weak yen knocked off 26 cents per share. If we ignore currency, which is admittedly hard to do, AFLAC’s earnings were up 3.9% last year. Dan Amos, AFLAC’s CEO, said that their goal is to grow earnings by 2% to 7% on a currency-neutral basis. The problem, of course, is that currency will have an impact. Fortunately, AFLAC broke down their expectations. Here’s a chart of AFLAC’s expected operating earnings per share based on different yen/dollar exchange ratios.
Yen/Dollar Ratio EPS Range Yen Impact 100 $6.46 to $6.77 $0.18 100.46 $6.29 to $6.59 — 115 $6.01 to $6.31 ($0.28) 125 $5.77 to $6.07 ($0.52) 135 $5.56 to $5.86 ($0.73) The stock rallied after the earnings report and closed at its highest level in a month. AFLAC remains a good buy up to $63 per share.
Going into earnings season, investors appeared to be a little skittish on Cognizant Technology Solutions ($CTSH), but the IT outsourcer delivered yet again. For Q4, Cognizant earned 67 cents per share which was two cents better than estimates. Quarterly revenues jumped 16.4% to $2.74 billion. The company has been helped by its aggressive expansion into healthcare.
Now for guidance. Cognizant said they see Q1 earnings of at least 69 cents per share. That was a penny below consensus (note they said “at least”). They also see Q1 revenues of at least $2.88 billion, which was just above consensus of $2.86 billion.
For all of 2014, Cognizant projects earnings of at least $2.91 per share. That’s five cents below consensus. They see revenues of at least $12.21 billion, which was higher than the consensus of $12.16 billion. The shares jumped 5% on Wednesday. This is already our top-performing stock this year, with a 9.45% YTD gain (Fiserv is #2). I’m raising my Buy Below on Cognizant to $60 per share.
Now for two of our newbies, Ball Corp. ($BLL) and Snap-on ($SNA). Both companies reported before the opening bell on Thursday. Ball had Q4 earnings of 84 cents per share, which was one penny below expectations. Revenues rose 1.8% to $2.03 billion, which was $50 million more than consensus. Even though Ball missed earnings, they wrapped up a very strong year. For all of 2014, the can maker earned $3.88 per share, which compares with $3.28 per share they made in 2013. The earnings growth was so good that Ball said they’ll have a tough time hitting their 10% to 15% long-term growth target for 2015.
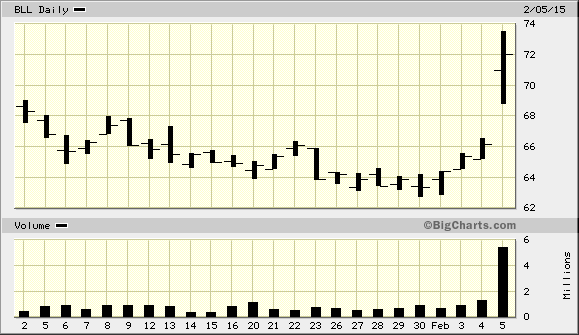
But the really big news is that Ball confirmed they’re in talks to buy Rexam, an aluminum can-maker in Britain. The potential deal could be worth $6.5 billion. The deal would be two-thirds in cash and one-third in stock, and it would combine two of the largest beverage can makers in the world. I like to see deals done in cash as much as possible. Shares of Rexam soared 23% in London. In the U.S., the market loved the news. Shares of Ball rallied nearly 9% on the day. I’m raising my Buy Below on Ball by $3. Ball is a buy any time the shares are below $75.
Snap-On reported very good earnings for Q4. The diversified manufacturer made $1.97 per share last quarter. That topped expectations by 16 cents per share. For the year, Snap-on made $7.14 per share, which is a very nice increase over the $5.93 per share they made in 2014. On Thursday, shares of SNA rallied for a 6.3% gain. I’m raising my Buy Below on Snap-on to $145 per share.
Before I go, I wanted to give you an update on Ford Motor ($F). I’ve been telling investors not to worry too much about last quarter’s earnings and that the earnings from now on will be very important. What’s interesting is that the automaker shrugged off last week’s earnings report, which was mostly good. But the stock really responded to the monthly sales report which came out on Tuesday. Ford’s sales rose 15.3% in January. From the low last Thursday to yesterday’s high, Ford rallied more than 12%. It’s good to see some strength in Ford. Let’s not chase it. I’m keeping our Buy Below at $16 per share.
That’s all for now. Outside of more Q4 earnings reports, next week should be fairly quiet on Wall Street. None of our Buy List stocks are due to report. On Tuesday, we’ll get another update on crude inventories. Then on Thursday, the Census Bureau will release its report on retail sales for January. It will be interesting to see how busy shoppers have been. Be sure to keep checking the blog for daily updates. I’ll have more market analysis for you in the next issue of CWS Market Review!
– Eddy
Morning News: February 6, 2015
Posted by Eddy Elfenbein on February 6th, 2015 at 7:03 amUK Trade Deficit Hits Four-Year High
Oil Prices Rise Again in Volatile Week
IRS Rehires Hundreds Of Problem Former Employees
RadioShack Files for Bankruptcy Protection, To Sell Stores
Twitter Revenue Rises 97% in 4th Quarter
Verizon to Sell $15 Billion in Assets, Launches $5 Billion Buyback
Why Pfizer’s $17 Billion Buyout of Hospira is a Super-Smart Move
Alcatel-Lucent Improves Q4 Profit Margins
Statoil Steps Up Cost-Cuts After Loss
Yelp Posts Strong Revenue Increase
LinkedIn Stock Rockets Almost 8% on Big Earnings Beat
Why Call of Duty and Destiny’s Gaming Dominance Is Coming to an Untimely End
Michael Pettis: Syriza and the French Indemnity of 1871-1873
Jeff Carter: The End of the Pits
Cullen Roche: Yes, the Economy Matters to the Markets
Be sure to follow me on Twitter.
Earnings from Ball Corp. and Snap-on
Posted by Eddy Elfenbein on February 5th, 2015 at 2:01 pmMore good Buy List news today. We had one very strong earnings report and an OK earnings report, but that was coupled with very encouraging acquisition news. Ball Corp. ($BLL) reported Q4 earnings of 84 cents per share. That was a penny below Wall Street’s consensus. Revenues rose 1.8% to $2.03 billion which was $50 million more than consensus. For the year, Ball earned $3.88 per share which is a nice increase over $3.28 per share they made in 2013.
Even though Ball missed by a penny per share, they finished up a very good year for 2014. As such, the company said it’s unlikely they’ll hit their long-term goal for growing earnings by 10% to 15% this year.
But the really big news is that Ball confirmed they’re in talks to buy Rexam, an aluminum can maker in Britain. The potential deal would be worth $6.5 billion. The market apparently likes this news a lot. Ball has been up as much as 11% today.
The other earnings news came from Snap-on ($SNA). The company reported Q4 earnings of $1.97 per share. That creamed estimates by 16 cents per share. For all of 2014, Snap-on made $7.14 per share. That’s a huge jump over $5.93 per share they earned a year ago. Business is going very well for them; the shares have been up as much as 7% today.
Morning News: February 5, 2015
Posted by Eddy Elfenbein on February 5th, 2015 at 7:11 amEU Raises Growth Forecasts, Cuts Inflation Outlook
One Way Greece Can Keep Its Banks Alive
China Bank Move Leaves Companies Cold
F.C.C. Plans Strong Hand to Regulate the Internet
Pfizer Agrees to Buy Hospira in Deal Valued at About $17 Billion
BT Agrees to Buy UK’s Largest Mobile Operator EE
RadioShack Said to Plan Bankruptcy Filing by Thursday
Sprint Revenue Falls on Price Cuts and Promotions
GM Earns $2.8 Billion in ’14, Sets $9,000 Profit Sharing
Ford Raises Pay for 500 Workers as Demand Grows for F-150 Pickup
Dunkin’ Brands Cuts Outlook as Sales Growth Slows
Under Armour Inc. Beats Expectations Again, Reveals 2 New Acquisitions
Anthem Hacked in ‘Sophisticated’ Attack on Customer Data
Joshua Brown: Or Maybe Just Stop Entirely
Roger Nusbaum: Retirement Realities and Contingencies
Be sure to follow me on Twitter.
Strong Earnings from Cognizant
Posted by Eddy Elfenbein on February 4th, 2015 at 3:40 pmBefore the bell, Cognizant Technology Solutions (CTSH) reported Q4 earnings of 67 cents per share. That beat consensus by two cents per share. Revenues jumped 16.4% to $2.74 billion.
Cognizant has been expanding its health-care market offerings to take advantage of an industrywide overhaul that its customers are dealing with. Last year, Cognizant agreed to buy TriZetto Corp. from Apax Partners for $2.7 billion in an all-cash deal to expand in health-care industry software — its biggest acquisition.
Health-care companies “have to be more flexible and nimble because of this consumerism,” Gordon Coburn, president of Cognizant, said in an interview at the Nasdaq in New York. “In addition to the traditional services that we have always offered, we will build and maintain your system for you.”
Cognizant also said they see Q1 earnings of at least 69 cents per share. That was a penny below consensus (note they said “at least”). They see Q1 revenues of at least $2.88 billion which was just above consensus of $2.86 billion.
For all of 2015, Cognizant projects earnings of at least $2.91 per share. That’s five cents below consensus. They see revenues of at least $12.21 billion which was higher than consensus of $12.16 billion.
The stock has been up as much as 8.2%. CTSH hit a new 52-week high of $59.64 per share.
Morning News: February 4, 2015
Posted by Eddy Elfenbein on February 4th, 2015 at 7:15 amChina’s Central Bank Cuts Reserve Requirement Ratio
Staples to Buy Office Depot in Deal Valued at $6.3 Billion
GM Posts Much Higher-Than-Expected Profit; Seeks to Boost Dividend
Sony Trims Loss Forecast After Strong Third Quarter on Higher Sensor Sales
Alibaba is Using Drones to Deliver Tea
Ford Hiring Move Brings 48% Raise for Hundreds of Workers
Merck Sales Fall Amid Headwinds
Cognizant Quarterly Revenue Rises 16.4%, Beats Estimates
Boston Scientific Revenue Climbs on Cardiovascular Strength
Yahoo Found the Perfect Small Business to Offload on its Alibaba Spin-Off
SAP Aggressively Moves Customers to Its Database
Petrobras CEO Steps Down Amid Brazil’s Biggest Graft Scandal
Disney Profit Jumps 19%, Even as ESPN Falters
Howard Lindzon: A Month off Twitter ….A February Decompress
John Hempton: Dear Eurozone Officials, Mr. Putin is Waiting
Be sure to follow me on Twitter.
AFLAC Earned $1.29 per Share
Posted by Eddy Elfenbein on February 3rd, 2015 at 5:39 pmAFLAC (AFL) just reported Q4 operating earnings of $1.29 per share. The weak yen knocked off eight cents per share.
For the year, AFLAC made $6.16 per share which was two cents below what they made in 2013. The weak yen cost them 26 cents per share last year. Ignoring currency, AFLAC’s earnings rose 3.9% last year.
OUTLOOK
Commenting on the company’s fourth quarter results, Chairman and Chief Executive Officer Daniel P. Amos stated: “We are extremely pleased with our sales in Japan and the U.S. More importantly, our 2014 operating earnings per diluted share growth of 3.9% excluding currency was at the high end of our 3% to 4% expectation.
“With 2014 marking Aflac Japan’s 40th year of operations, it is especially impressive that third sector sales increased 28.5% in the fourth quarter, particularly in comparison to strong third sector sales results that came in the fourth quarter of the prior two years. Aflac Japan’s third sector sales growth for the year was 6.1%, which was at the high end of our annual sales target. On the distribution side, our traditional agencies have been, and remain, key to our success. I’m also pleased that we continued to build on our partnership with Japan Post throughout the year, expanding the number of postal outlets and their agents selling our cancer products. Cancer insurance sales through all distribution outlets were up an impressive 176% for the quarter. As we look ahead to 2015, we believe that for the first nine months, third sector sales will average a 15% increase. With fourth quarter sales facing difficult comparisons, we believe third sector sales in the final quarter of 2015 could be down sharply. However, as always, we will be working to find ways to minimize that decline. At the end of the second quarter, when we have more insight, we will give additional guidance on the fourth quarter.
“Turning to Aflac U.S., I am very pleased with our fourth quarter sales results, which surpassed our expectations, increasing 14.1%. The strong fourth quarter sales drove annual sales results to an increase of .7%, which significantly exceeded our most recent sales expectation for the year. It is rewarding to see the changes we made to our sales organization in 2014, both in the career agent channel and the broker channel, yielded such promising results. Although one quarter doesn’t make a trend, I am very encouraged with how far we’ve come in a short period of time. However, I am not willing to say we’ve had a sales turnaround until I see first half sales results in 2015. Saying that, I remain encouraged and believe we should have a 3% to 7% increase in U.S. sales, with a target of 5%.
“Although we have not yet finalized our statutory financial statements, we estimate our 2014 risk-based capital ratio, or RBC, remained very strong and will exceed the third quarter estimate. Additionally, as a result of a significant decline in interest rates that led to substantial unrealized gains in the investment portfolio, Aflac Japan’s solvency margin ratio, or SMR, improved significantly, and we expect that it will be above 850%.
“We entered into a new reinsurance agreement on October 1, which released approximately ¥55 billion of Aflac Japan’s regulatory reserves. Half of that transaction was retroceded to an Aflac Incorporated subsidiary at the end of the year.
“As we have said for many years, we believe that growing the cash dividend and repurchasing our shares are the most attractive means for deploying capital. In 2014, we repurchased $1.2 billion, or 19.7 million of our shares, which is consistent with what we had communicated last October. We currently plan to repurchase $1.3 billion of our shares in 2015. As we indicated last quarter, we also increased the cash dividend 5.4%, effective with the fourth quarter, marking the 32nd consecutive year in which we’ve increased the cash dividend. Our objective is to grow the dividend at a rate generally in line with the increase in operating earnings before the impact of foreign currency translation.
“Once again, I was very pleased that we ended the year with our operating earnings per share at the high end of our 2014 estimate, although that result creates a tougher comparison when we look to 2015. Our objective remains to grow 2015 operating earnings per diluted share before currency 2% to 7%. Because overall financial markets are currently very challenging and interest rates are at significantly depressed levels, it is difficult to invest cash flows at attractive yields. Therefore, we will be very disciplined in selling first sector products in Japan, which will reduce cash flows to investments. I would also remind you that the progression of this year’s benefit ratios in both the U.S. and Japan, which have seen favorable trends, could also have a significant impact on our results. As always, we are working very hard to achieve our earnings-per-share objective while also ensuring we deliver on our promise to policyholders.”
Here’s AFLAC’s EPS range for this year under different yen/dollar ratios:
Yen/Dollar Ratio EPS Range Yen Impact 100 $6.46 to $6.77 $0.18 100.46 $6.29 to $6.59 — 115 $6.01 to $6.31 ($0.28) 125 $5.77 to $6.07 ($0.52) 135 $5.56 to $5.86 ($0.73) Fiserv Earns 89 Cents per Share
Posted by Eddy Elfenbein on February 3rd, 2015 at 4:19 pmSolid quarter from Fiserv (FISV). The company earned 89 cents per share for Q4, and $3.37 per share for all of 2014. That’s up from $2.99 for 2013. Fiserv forecasts a range of $3.73 to $3.83 for 2015. Very good.
“We delivered strong results in 2014 highlighted by adjusted internal revenue growth approaching the top-end of our guidance, and our 29th consecutive year of double digit adjusted earnings per share growth,“ said Jeffery Yabuki, President and Chief Executive Officer of Fiserv. “Increased sales, expanded operating margin and record free cash flow add to our momentum as we enter 2015.”
(…)
Outlook for 2015
Fiserv expects adjusted internal revenue to grow in a range of 5 to 6 percent. The company also expects adjusted earnings per share in a range of $3.73 to $3.83, which would represent growth of 11 to 14 percent over $3.37 in 2014.
“We expect acceleration in our adjusted internal revenue growth again in 2015, along with margin expansion, strong free cash flow and continued shareholder-friendly capital allocation,” said Yabuki.
A Range-Bound Market
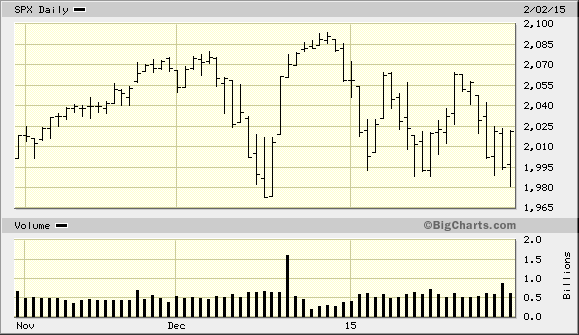
Posted by Eddy Elfenbein on February 3rd, 2015 at 11:37 amThis is starting to look like a range-bound market. Whenever the S&P 500 gets below 2,000, it soon rallies. Yet when it gets above 2,060 or so, the index suddenly gets nervous. Sixty of the last 63 closes have been between 1,990 and 2,090. That goes back to the beginning of November.
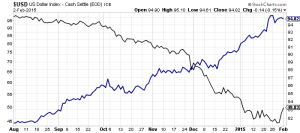
Perhaps the most interesting change recently has been the surge in oil. Of course, this is really coming off a very deep bottom. West Texas Crude has rallied the last three days, and it looks like it will do so again today. The spot price is back above $50 per barrel. Energy stocks have also been doing well, but again, that’s after a painful fall. Interestingly, the recent uptick in oil has not been matched by a downtick in the dollar.
We have two earnings reports due after the close, from AFLAC and Fiserv. Shares of Ford are having a nice day after a good sales report for January. Sales rose more than 15%, but remember that this is compared with a polar-vortexed January last year. Ford got as high as $15.79 today which it hasn’t seen in two months.
Ford said its retail sales increased by 13 percent —the best retail sales month for Ford since 2004. The Dearborn automaker said passenger car sales to retail customers rose by 6 percent, utilities were up 10 percent and truck sales rose 23 percent.
Ford sold 54,370 F-Series pickups last month, up 16.8 percent in January, marking the best January for F-Series since 2004. Lincoln brand sales also jumped 10.8 percent.
I have to add that the plunge in earnings estimates is staggering. On September 30, the expectations for 2015 earnings for the S&P 500 were $136. That’s the index-adjusted number. By December 31, it was down to $131. Now it’s down to $120. For comparison, the S&P 500 probably earned about $114 last year up from $107 in 2013.
The Stock Market Likes It Boring
Posted by Eddy Elfenbein on February 3rd, 2015 at 9:25 amI was playing around with some market data and I found something interesting I wanted to pass along. It turns out that the really big gains from the stock market happen during the boring days.
I took all of the daily closing figures for the S&P 500 from 1932 through 2014. I didn’t count Saturday trading which existed up until the 1950s. In total, I had more than 20,000 daily closes.
Here’s what I found: The S&P 500 rose by more than 1.17% over 1,900 times (about 9.2% of the time), and it fell by more than 1.17% over 1,800 times (about 8.7% of the time). While the down days are fewer in number, they tend to be more severe. If we combine all the days with moves greater than 1.17%, it nets out almost perfectly to zero.
In other words, all those high-volatility days add up to nothing. The market’s entire gain comes on days when the S&P 500 rises or falls less than 1.17%. The rest is just noise.
What’s interesting is that many of those big up days come very near to those big down days. It’s almost as if bull and bear markets are illusions — there’s only a normal market with occasional brief but sharp panics. Even what appear to be long, secular bear markets see their worst pain concentrated within a short window.
-
Archives
- September 2026
- August 2026
- July 2026
- June 2026
- May 2026
- April 2026
- March 2026
- February 2026
- January 2026
- December 2025
- November 2025
- October 2025
- September 2025
- August 2025
- July 2025
- June 2025
- May 2025
- April 2025
- March 2025
- February 2025
- January 2025
- December 2024
- November 2024
- October 2024
- September 2024
- August 2024
- July 2024
- June 2024
- May 2024
- April 2024
- March 2024
- February 2024
- January 2024
- December 2023
- November 2023
- October 2023
- September 2023
- August 2023
- July 2023
- June 2023
- May 2023
- April 2023
- March 2023
- February 2023
- January 2023
- December 2022
- November 2022
- October 2022
- September 2022
- August 2022
- July 2022
- June 2022
- May 2022
- April 2022
- March 2022
- February 2022
- January 2022
- December 2021
- November 2021
- October 2021
- September 2021
- August 2021
- July 2021
- June 2021
- May 2021
- April 2021
- March 2021
- February 2021
- January 2021
- December 2020
- November 2020
- October 2020
- September 2020
- August 2020
- July 2020
- June 2020
- May 2020
- April 2020
- March 2020
- February 2020
- January 2020
- December 2019
- November 2019
- October 2019
- September 2019
- August 2019
- July 2019
- June 2019
- May 2019
- April 2019
- March 2019
- February 2019
- January 2019
- December 2018
- November 2018
- October 2018
- September 2018
- August 2018
- July 2018
- June 2018
- May 2018
- April 2018
- March 2018
- February 2018
- January 2018
- December 2017
- November 2017
- October 2017
- September 2017
- August 2017
- July 2017
- June 2017
- May 2017
- April 2017
- March 2017
- February 2017
- January 2017
- December 2016
- November 2016
- October 2016
- September 2016
- August 2016
- July 2016
- June 2016
- May 2016
- April 2016
- March 2016
- February 2016
- January 2016
- December 2015
- November 2015
- October 2015
- September 2015
- August 2015
- July 2015
- June 2015
- May 2015
- April 2015
- March 2015
- February 2015
- January 2015
- December 2014
- November 2014
- October 2014
- September 2014
- August 2014
- July 2014
- June 2014
- May 2014
- April 2014
- March 2014
- February 2014
- January 2014
- December 2013
- November 2013
- October 2013
- September 2013
- August 2013
- July 2013
- June 2013
- May 2013
- April 2013
- March 2013
- February 2013
- January 2013
- December 2012
- November 2012
- October 2012
- September 2012
- August 2012
- July 2012
- June 2012
- May 2012
- April 2012
- March 2012
- February 2012
- January 2012
- December 2011
- November 2011
- October 2011
- September 2011
- August 2011
- July 2011
- June 2011
- May 2011
- April 2011
- March 2011
- February 2011
- January 2011
- December 2010
- November 2010
- October 2010
- September 2010
- August 2010
- July 2010
- June 2010
- May 2010
- April 2010
- March 2010
- February 2010
- January 2010
- December 2009
- November 2009
- October 2009
- September 2009
- August 2009
- July 2009
- June 2009
- May 2009
- April 2009
- March 2009
- February 2009
- January 2009
- December 2008
- November 2008
- October 2008
- September 2008
- August 2008
- July 2008
- June 2008
- May 2008
- April 2008
- March 2008
- February 2008
- January 2008
- December 2007
- November 2007
- October 2007
- September 2007
- August 2007
- July 2007
- June 2007
- May 2007
- April 2007
- March 2007
- February 2007
- January 2007
- December 2006
- November 2006
- October 2006
- September 2006
- August 2006
- July 2006
- June 2006
- May 2006
- April 2006
- March 2006
- February 2006
- January 2006
- December 2005
- November 2005
- October 2005
- September 2005
- August 2005
- July 2005
 Eddy Elfenbein is a Washington, DC-based speaker, portfolio manager and editor of the blog Crossing Wall Street. His