-
Super Dollar
Posted by Eddy Elfenbein on January 2nd, 2015 at 2:08 pmThe Great Greenback Rallies continues. The U.S. dollar just hit an 11.5-year high.
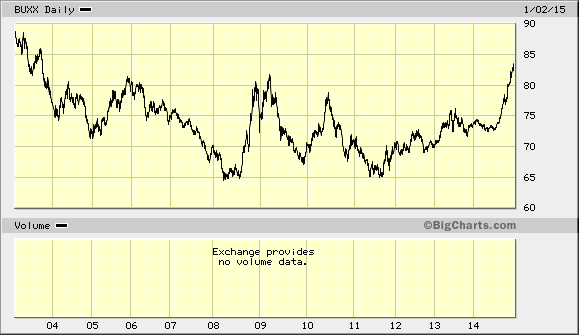
Note that this is the WSJ Dollar Index, which is a bit different from DXY, which is the more-cited dollar index.
-
December ISM = 55.5
Posted by Eddy Elfenbein on January 2nd, 2015 at 12:19 pmThe ISM report for December came in a bit light this morning at 55.5 versus the expected 57.6. But the important thing is that it’s still higher than 50 which it has been for 65 of the last 66 months.
The ISM is a dispersion index which means that any reading greater than 50 means the manufacturing sector of the economy is expanding.
-
Morning News: January 2, 2015
Posted by Eddy Elfenbein on January 2nd, 2015 at 7:24 amMerkel Ally Urges ECB Not to Buy Struggling States’ Bonds
Euro Falls Against Dollar as European Central Bank Hints of Stimulus
Euro Forecasters See More Pain After Worst Year Since 2005
To Rescue Economy, Japan Turns to Supermom
Macau Gambling Revenue Suffers First Full-Year Fall
Russia Oil Output Hits Post-Soviet High, Small Firms Help
Crude Oil Trades Near 5 1/2-Year Low Amid Manufacturing Weakness
Sterling Sinks to 16-month Low After UK Manufacturing Miss
Walgreen-Alliance Boots Deal is Complete
Hyundai-Kia Sees Slowest Sales Growth in 12 years in 2015
Giving Chickens Breathing Room Will Cost Consumers
DARPA Plans Autonomous ‘Flying Insect’ Drones With Skills to Match Birds of Prey
Hotels Make Internet Free, But Tighten Cancellation Policies
Joshua Brown: Good Times Teach Only Bad Lessons
Cullen Roche: 2014 Portfolio Review – What Strategies Worked & Didn’t Work
Be sure to follow me on Twitter.
-
CWS Market Review – January 1, 2015
Posted by Eddy Elfenbein on January 1st, 2015 at 7:42 amHappy New Year!
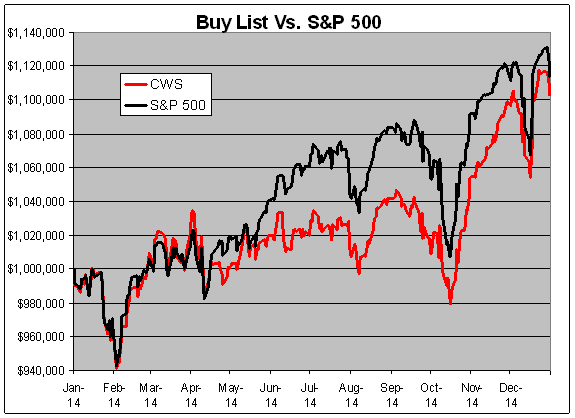
The 2014 trading year is officially on the books. It was another profitable year for our Buy List. I want to thank everyone for their support. We again showed that a set-and-forget portfolio of high-quality stocks can do well.
Here are the final numbers. For the year, our Buy List gained 10.26%. Including dividends, we were up 11.80%.
Unfortunately, we were beaten out by the S&P 500, but it was close. For 2014, the S&P 500 gained 11.39%—13.69% when you include dividends. For those who care about such things, the Buy List’s “beta” was 0.9361.
Nine of our Buy List stocks were up more than 20%. There was nearly a four-way tie for our top-performing stocks of the year. Ultimately, Medtronic ($MDT) edged out Ross Stores ($ROST), 25.81% to 24.80%, while DirecTV ($DTV) and Stryker ($SYK) were right behind, tied at 25.54%. Fifteen of our 20 stocks made money last year. The biggest loser was IBM ($IBM), which lost 14.46%.
Over the nine-year history of our Buy List, our total compounded gain, including dividends, is 151.28%. For the S&P 500, the nine-year total return is 99.64%.
Details of Last Year’s Buy List
The chart below details the Buy List’s performance. I’ve listed each stock, along with the number of shares and the starting and ending prices. For tracking purposes, I assume the Buy List is a $1 million portfolio that starts equally divided among the 20 stocks.
Stock Shares 12/31/2013 Beginning 12/31/2014 Ending Profit/Loss AFL 748.5030 $66.80 $50,000.00 $61.09 $45,726.05 -8.55% BBBY 622.6650 $80.30 $50,000.00 $76.17 $47,428.39 -5.14% CA 1,485.8841 $33.65 $50,000.00 $30.45 $45,245.17 -9.51% CTSH 990.2952 $50.49 $50,000.00 $52.66 $52,148.95 4.30% BCR 373.3015 $133.94 $50,000.00 $166.62 $62,199.50 24.40% DTV 724.0081 $69.06 $50,000.00 $86.70 $62,771.50 25.54% EBAY 911.2448 $54.87 $50,000.00 $56.12 $51,139.06 2.28% ESRX 711.8451 $70.24 $50,000.00 $84.67 $60,271.92 20.54% FISV 846.7401 $59.05 $50,000.00 $70.97 $60,093.14 20.19% F 3,240.4407 $15.43 $50,000.00 $15.50 $50,226.83 0.45% IBM 266.5671 $187.57 $50,000.00 $160.44 $42,768.03 -14.46% MCD 515.3045 $97.03 $50,000.00 $93.70 $48,284.03 -3.43% MDT 871.2319 $57.39 $50,000.00 $72.20 $62,902.94 25.81% MSFT 1,336.5410 $37.41 $50,000.00 $46.45 $62,082.33 24.16% MOG-A 735.9435 $67.94 $50,000.00 $74.03 $54,481.90 8.96% ORCL 1,306.8479 $38.26 $50,000.00 $44.97 $58,768.95 17.54% QCOM 673.4007 $74.25 $50,000.00 $74.33 $50,053.87 0.11% ROST 667.2895 $74.93 $50,000.00 $94.26 $62,898.71 25.80% SYK 665.4245 $75.14 $50,000.00 $94.33 $62,769.49 25.54% WFC 1,101.3216 $45.40 $50,000.00 $54.82 $60,374.45 20.75% Total $1,000,000 $1,102,635.22 10.26% Note that Cognizant Technology Solutions ($CTSH) split its shares 2-for-1 on March 10. The results above have been adjusted for the stock split.
Starting Prices and Shares for the 2014 Buy List
Here are the starting prices and number of shares for the 2015 Buy List. For tracking purposes, I assume the Buy List is a $1 million portfolio that’s equally divided among 20 stocks. Whenever I discuss how well our Buy List is doing, this is what I’m referring to:
Company Ticker Price Shares Balance AFLAC AFL $61.09 818.4646 $50,000.00 Ball Corp. BLL $68.17 733.4605 $50,000.00 Bed Bath & Beyond BBBY $76.17 656.4264 $50,000.00 Cognizant Technology Solutions CTSH $52.66 949.4873 $50,000.00 CR Bard BCR $166.62 300.0840 $50,000.00 eBay EBAY $56.12 890.9480 $50,000.00 Express Scripts ESRX $84.67 590.5279 $50,000.00 Fiserv FISV $70.97 704.5230 $50,000.00 Ford Motor F $15.50 3,225.8065 $50,000.00 Hormel Foods HRL $52.10 959.6929 $50,000.00 Microsoft MSFT $46.45 1,076.4263 $50,000.00 Moog MOG-A $74.03 675.4019 $50,000.00 Oracle ORCL $44.97 1,111.8523 $50,000.00 Qualcomm QCOM $74.33 672.6759 $50,000.00 Ross Stores ROST $94.26 530.4477 $50,000.00 Signature Bank SBNY $125.96 396.9514 $50,000.00 Snap-on SNA $136.74 365.6575 $50,000.00 Stryker SYK $94.33 530.0541 $50,000.00 Wabtec WAB $86.89 575.4402 $50,000.00 Wells Fargo WFC $54.82 912.0759 $50,000.00 There are five new stocks and five stocks that I’m removing. The five new stocks are Ball Corp. ($BLL), Hormel Foods ($HRL), Signature Bank ($SBNY), Snap-on ($SNA) and Wabtec ($WAB).
The five deletions are CA Technologies ($CA), DirecTV ($DTV), IBM ($IBM), McDonald’s ($MCD) and Medtronic ($MDT).
The average market cap is $69 billion. That ranges from a high of $382 billion for Microsoft ($MSFT) to $3 billion for Moog ($MOG-A).
Thirteen of the twenty stocks pay dividends. The total yield of the Buy List is 1.06%.
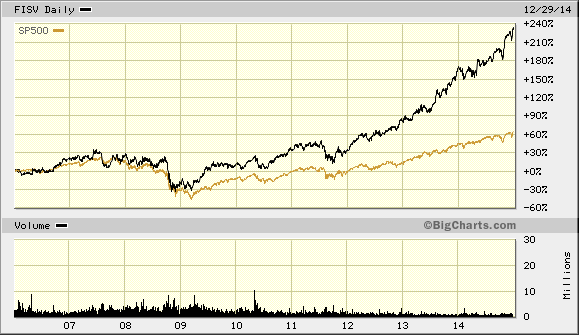
Only three stocks have been on the Buy List all ten years: AFLAC ($AFL), Bed Bath & Beyond ($BBBY) and Fiserv ($FISV). Stryker ($SYK) and Moog ($MOG-A) are both making their eighth appearance.Buy Below Prices for the New Buys
Now let me give you the Buy Below prices for our five new buys. Remember, these aren’t price targets. They’re guidelines for new entry.
I’m starting Ball Corp. ($BLL) out as a buy up to $72 per share. This is a good stock for conservative investors. Ball also pays a very small dividend. I’m going to initiate Hormel Foods ($HRL) with a Buy Below of $56. By the way, Hormel reports on a Jan-Apr-July-Oct Cycle, so its earnings will come a bit after most of our other stocks. Signature Bank ($SBNY) is a buy up to $133. I’d like to see SBNY start paying a dividend soon. Snap-on ($SNA) is a buy anytime you see it below $143 per share. Lastly, I rate Wabtec ($WAB) a buy up to $90 per share. This week, I’m also raising the Buy Below on Ross Stores ($ROST) to $96 per share.
On Thursday, January 8, Bed Bath & Beyond ($BBBY) will report earnings for its fiscal third quarter. This covers September, October and November. On the last earnings call, BBBY said they expect Q3 to range between $1.17 and $1.21 per share. Interestingly, they also gave guidance for Q4 which they see ranging between $1.78 and $1.83 per share. The fourth quarter is the biggie for Bed Bath. For the entire year, management said they see earnings coming in between $5.00 and $5.08 per share.
I was impressed with this guidance. Buybacks are helping out a lot. My numbers pretty much match up with what the company is saying. If they hit $5.08 for the year, that means the stock is going for 15 times earnings, which is hardly overpriced. Last week, Barron’s ran a feature on BBBY and noted that the company has ramped up its Internet presence. For now, I’m going to keep a fairly tight Buy Below on BBBY. Let’s see how Q4 is shaping up. Bed Bath & Beyond remains a buy up to $77 per share.
That’s all for now. The market is closed on Thursday for New Year’s Day, but Friday will be a full work day. At 10 a.m., the December ISM will come out. Next Friday, we’ll get some of the key turn-of-the-month econ reports like Trade Balance and Factory Orders. The latest Fed minutes come out on Wednesday. This all leads up to the big jobs report next Friday. Be sure to keep checking the blog for daily updates. I’ll have more market analysis for you in the next issue of CWS Market Review!
– Eddy
Morning News: January 1, 2015
Posted by Eddy Elfenbein on January 1st, 2015 at 7:05 amS&P 500 Erases Monthly Gain on Final Day of 2014 Trading
Sector-By-Sector Breakdown of 2014’s Market Moves
Commodities Head for Record Losing Run on Oil, Strong Dollar
The Euro Currency Prepares To Say Adieus To One Country While Welcoming In Another
How Putin Forged a Pipeline Deal That Derailed
China December Factory PMIs Suggest Economy Cooling Further, More Stimulus Expected
U.S. Jobless Claims Rise, But Labor Market Still Firming
Orbitz and United Are Suing a 22-Year-Old Who Figured Out How to Game Airlines
U.S. Drone Rules Remain in the Hangar in 2014
Ambac Sues Bank of America Over Countrywide Mortgage Bonds
Apple Customers Sue Over Shortage of Storage Space in iOS 8
Verso Settles With U.S. Department of Justice Regarding Pending Acquisition of NewPage
Jeff Miller: 2014 in Review: Hot or Not?
Roger Nusbaum: MLPs Weren’t Supposed to Decline
Be sure to follow me on Twitter.
The 2015 Buy List
Posted by Eddy Elfenbein on December 31st, 2014 at 8:10 pmHere are the 20 stocks for the 2015 Buy List. It’s locked and sealed and I can’t make any changes for 12 months.
For tracking purposes, I assume the Buy List is a $1 million portfolio that’s equally divided among 20 stocks. Below are all 20 positions with the amount of shares for each and the closing price for 2014. Whenever I discuss how the Buy List is doing, the list below is what I’m referring to.
Company Ticker Price Shares Balance AFLAC AFL $61.09 818.4646 $50,000.00 Ball Corp. BLL $68.17 733.4605 $50,000.00 Bed Bath & Beyond BBBY $76.17 656.4264 $50,000.00 Cognizant Technology Solutions CTSH $52.66 949.4873 $50,000.00 CR Bard BCR $166.62 300.0840 $50,000.00 eBay EBAY $56.12 890.9480 $50,000.00 Express Scripts ESRX $84.67 590.5279 $50,000.00 Fiserv FISV $70.97 704.5230 $50,000.00 Ford Motor F $15.50 3,225.8065 $50,000.00 Hormel Foods HRL $52.10 959.6929 $50,000.00 Microsoft MSFT $46.45 1,076.4263 $50,000.00 Moog MOG-A $74.03 675.4019 $50,000.00 Oracle ORCL $44.97 1,111.8523 $50,000.00 Qualcomm QCOM $74.33 672.6759 $50,000.00 Ross Stores ROST $94.26 530.4477 $50,000.00 Signature Bank SBNY $125.96 396.9514 $50,000.00 Snap-on SNA $136.74 365.6575 $50,000.00 Stryker SYK $94.33 530.0541 $50,000.00 Wabtec WAB $86.89 575.4402 $50,000.00 Wells Fargo WFC $54.82 912.0759 $50,000.00 There are five new stocks and five stocks that I’m removing. The five new stocks are Ball Corp. ($BLL), Hormel Foods ($HRL), Signature Bank ($SBNY), Snap-on ($SNA) and Wabtec ($WAB). Here’s a brief description of each.
Ball Corp. ($BLL) is the largest producer of recyclable beverage cans in the world. The company started out making mason jars. While they’re no longer in that business today, Ball makes billions of recyclable metal containers. Based in Broomfield, Colorado, Ball also has an aerospace unit that makes parts for NASA. If you like boring and profitable, you’ll like Ball.
I always think of Hormel Foods ($HRL) as the Spam company. Not as in unwanted emails, but Spam the lunch meat. But Hormel is so much more. They own a bunch of food brands including Dinty Moore stew and Country Crock. More than 30 Hormel bands are ranked #1 or #2 in their markets. Last month, Hormel raised their dividend by 25%. It was their 49th consecutive annual dividend increase. Not bad for lunch meat.
Signature Bank ($SBNY) may be the quietest success story in banking. Signature is never in the news and that’s how they like it. But their performance tells the story. Signature’s loan delinquency rate is about one-tenth of the industry average. They also keep a tight rein on overhead which runs about 40% below industry average. Without anyone noticing, Signature has shaken up traditional banking.
Snap-on ($SNA) is a maker of high-end hand tools and power tools. They also make lots of machines for car repair like hydraulic lifts and tire changers. Snap-on makes products for the marine, rail and aviation industries. Last month, Snap-on raised their dividend by 20.5%. The company is based in Kenosha, WI (birthplace of Orson Welles), and they employ 11,500 people.
Wabtec ($WAB) was formed by the merger of Westinghouse Air Brake and MotivePower in 1999. The company traces its roots back to 1869 when George Westinghouse invented the railway airbrake. (In last week’s issue, I listed the stock as Westinghouse Air Brake Technologies, but Wabtec is the official name.) Wabtec makes locomotives, brakes and other parts for the freight and passenger rail industries. Business is going well; Wabtec recently raised guidance and their backlog is at a record. Barron’s notes that Wabtec is the only stock on any U.S. exchange that’s risen in each of the last 13 years.
The five deletions are CA Technologies ($CA), DirecTV ($DTV), IBM ($IBM), McDonald’s ($MCD) and Medtronic ($MDT).
The average market cap is $69 billion. That ranges from a high of $382 billion for Microsoft ($MSFT) to $3 billion for Moog ($MOG-A).
Thirteen of the twenty stocks pay dividends. The total yield of the Buy List is 1.06%.
Only three stocks have been on the Buy List all ten years: AFLAC ($AFL), Bed Bath & Beyond ($BBBY) and Fiserv ($FISV). Stryker ($SYK) and Moog ($MOG-A) are both making their eighth appearance.
The 2014 Buy List
Posted by Eddy Elfenbein on December 31st, 2014 at 7:20 pmThe 2014 trading year is officially on the books. It was another profitable year for our Buy List. I want to thank everyone for your support. We again showed that a set-and-forget portfolio of high-quality stocks can do well.
Here are the final numbers. For the year, our Buy List gained 10.26%. Including dividends, we were up 11.80%.
Unfortunately, we were beaten out by the S&P 500, but it was close. For 2014, the S&P 500 gained 11.39% and 13.69% when you include dividends. The return from dividends for our Buy List was 1.39% while it was 2.06% for the S&P 500. This was the first time since 2006 that the S&P 500 outperformed our Buy List. For those who care about such things, the Buy List’s “beta” was 0.9361.
Nine of our Buy List stocks were up more than 20%. There was nearly a four-way tie for our top-performing stock of the year. Ultimately, Medtronic ($MDT) edged out Ross Stores ($ROST) 25.81% to 24.80%, while DirecTV ($DTV) and Stryker ($SYK) were right behind tied at 25.54%. Fifteen of our 20 stocks made money last year. The biggest loser was IBM ($IBM) which lost 14.46%.
Over the nine-year history of our Buy List, our total compounded gain, including dividends, is 151.28%. For the S&P 500, the nine-year total return is 99.66%.
The chart below details the Buy List’s performance. I’ve listed each stock, along with the number of shares and the starting and ending prices. For tracking purposes, I assume the Buy List is a $1 million portfolio that starts equally divided among the 20 stocks.
 Eddy Elfenbein is a Washington, DC-based speaker, portfolio manager and editor of the blog Crossing Wall Street. His