-
The Double Dip Scares of 2010 and 2011
Posted by Eddy Elfenbein on June 2nd, 2014 at 1:02 pmWall Street has a very short memory. For two consecutive summers (2010 and 2011), people were obsessed with the idea that the U.S. economy was about to fall into a double dip recession.
Of course, that never happened, but the fears were very real. Here’s a look at the Google Trends for “double dip recession.”
-
Oops! May ISM Was 55.4
Posted by Eddy Elfenbein on June 2nd, 2014 at 12:20 pmHere’s an odd one. The original report that the ISM figure for May was 53.2 turns out to have been incorrect. Now we’re told the correct number was 55.4, which is much closer to expectations.
I’m not aware of any correction like this happening before.
-
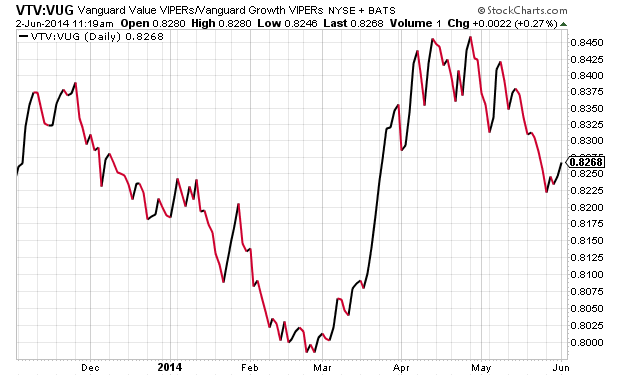
The Value Rotation is Still On
Posted by Eddy Elfenbein on June 2nd, 2014 at 11:26 amIn March, Value stocks completely routed Growth. In May, Growth stocks mounted a counter-attack, but that’s been sharply repulsed over the last few days. It looks like Value stocks still want to lead.
Here’s the Vanguard Value ETF ($VTV) divided by the Vanguard Growth ETF ($VUG).
-
May ISM Drops to 53.2
Posted by Eddy Elfenbein on June 2nd, 2014 at 10:18 amThe S&P 500 is down a bit this morning from Friday’s all-time high close. The big news today was the May ISM report which came in a bit light. Wall Street had been expecting 55.5, and today’s reading was 53.2. That’s nothing to be worried about.
I like following the monthly as it’s one of the better monthly reports. For the most part, the economy doesn’t start hitting a trouble spot until the ISM falls to around 45. The ISM has now been 49.0 or better for 59 straight months.
There’s not much news from our Buy List, although Express Scripts is weak after being downgraded by Cowen.
-
Morning News: June 2, 2014
Posted by Eddy Elfenbein on June 2nd, 2014 at 6:47 amNikkei Hits 8-Week High on China PMI, Japan Capex; Dai-ichi Life Dives
Expansion in Euro Zone Factory Activity Eases in May: Purchasing Managers’ Index
BRIC Rally’s Weak Point Exposed in Brazilian Selloff
Russia Gives Ukraine More Time to Pay Gas BIll
Fed’s Evans Says U.S. Will End Asset Purchases This Year
Unstoppable $100 Trillion Bond Market Renders Models Useless
Global Airline Profits Seen Dipping 3.5% This Year
Japan’s Dai-ichi Life in Talks to Buy Protective Life for $5 Billion
GlaxoSmithKline in $350 Million Cancer Drug Venture
Roche Buys U.S. DNA Sequencing Firm
Meet Solar Impulse 2, The Solar-Powered Plane That Never Has to Land
Insider-Trading Inquiry Could Rattle Icahn’s Efforts to Shape His Legacy
Joshua Brown: Government vs. Governance
Jeff Miller: Weighing the Week Ahead: More Clarity from the Market Message?
Be sure to follow me on Twitter.
-
CWS Market Review – May 30, 2014
Posted by Eddy Elfenbein on May 30th, 2014 at 7:14 am“Just because you buy a stock and it goes up does not mean you are right. Just because you buy a stock and it goes down does not mean you are wrong.”
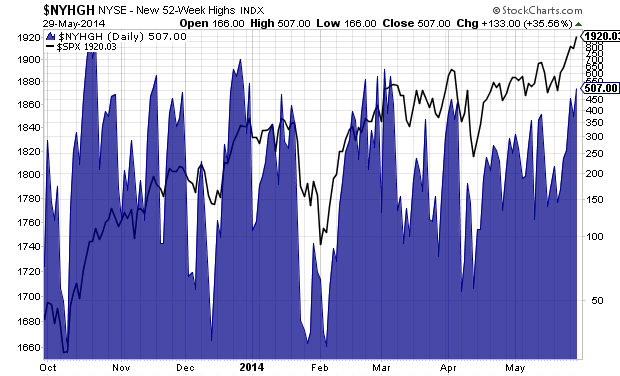
– Peter LynchWe’re back! I’m pleased to report that the bull market keeps on charging. On Thursday, the S&P 500 closed at 1,920.03. That makes the 13th time this year the index has set an all-time record high. (Perhaps I should go on vacation more often.)
I’ve also been surprised by how tame this market has been. We haven’t had a 1% drop in seven weeks. The Volatility Index ($VIX) recently dropped to a nine-month low, and it’s close to hitting a seven-year low.
One of the concerns I have with this market is the narrowness of it. In plainer terms, fewer and fewer stocks are doing the heavy lifting. With each successive peak in the S&P 500 (the black line), the number of stocks hitting new highs decreases (the blue line). That’s not a good sign.
That’s not all. This week, the government reported that for the first time in three years, the economy got smaller. For Q1, real GDP fell by 1%. Fortunately, that’s almost certainly a temporary blip. I’ll have more details in a bit. I’ll also look at the recent deal between AT&T and DirecTV, and later on, I’ll highlight some recent Buy List earnings, looking at what stocks look especially good right now. But first, let’s take a closer look at this amazingly resilient bull market.
Bull Markets Get Sloppy as They Get Older
One of the basic facts about bull markets is that they get sloppy as they get older. It’s always been that way, and I suspect it always will be. Consider that since the end of 2011, stocks with the worst balance sheets on Wall Street have done the best. In fact, they’ve done nearly twice as well as the S&P 500.
With Janet and friends inside the Fed keeping interest rates on the floor, it’s not such a burden having lousy finances. Companies that have issued junk debt in the past year have seen their stocks rise by an average of 26%. That compares with 15% for the rest of the market. There’s such a strong demand for higher-yielding debt that investors are willing to gobble up anything.
We’re still early in this game, but this is the type of behavior that leads to trouble. Fortunately for us, our Buy List stocks are fundamentally strong. The downside is that in a market like this, they can sit outside the rally. As always, patience is our best friend.
But what’s been even more impressive than the stock market rally has been the relentless rally in Treasury bonds. Bond guru Jeffrey Gundlach was one of the few people who said that bonds would rally this year, and he was bang-on right. On Thursday, the 10-year Treasury yield got down to 2.4%. That’s the lowest yield in close to a year.
Sheesh…anyone else remember when the end of QE was supposed to lead to a rotation out of bonds? That hasn’t happened, and it doesn’t look to start anytime soon.
So what’s going on with the bond market? Some people think bonds are reacting to bad economic numbers. That’s possible, but I’m a doubter. It’s true that Thursday’s GDP report was ugly. The Commerce Department said that for the first time in three years, the U.S. economy actually contracted. Real GDP fell at a 1% annualized rate during the first three months of this year.
Unpleasant, I know, but let’s remember that Q1 started five months ago and ended two months ago. In fact, it looks like the numbers for Q2 and Q3 will be pretty good. We’re also seeing a lot of strength in economically sensitive areas like transportation stocks. So the bond market has everyone perplexed.
Bill Dudley, the top dog at the New York Fed, gave an interesting speech last week which may explain what’s going on. The crucial point of Dudley’s speech came when he said he doesn’t expect real short-term interest rates to return to their historical level.
Let me explain. Here’s a very, very, very oversimplified explanation of what the Fed does. When the economy’s humming along, the Fed keeps real interest rates pinned at 2.5%. Anything above that is too tight. But when the economy’s in the dumps, the Fed lowers real rates to 0%. So the Fed’s job is to oscillate between 0% and 2.5%.
Please understand, this is a big generalization, but it works well for our purposes. Now Mr. Dudley said he thinks the 2.5% level no longer works. In fact, he expects real rates to stay “well below” that for a long time.
Dudley cites three reasons. First, he says, “economic headwinds seem likely to persist for several more years.” He may be right on that. Second, he notes the slowing growth of the labor force. Well, that’s certainly been the case. Third, he mentions changes in bank regulation and higher capital requirements.
Add these up, and we’re living in a low-rate world. If Dudley is right, and I’m not convinced he is, then it’s a major deal. It’s almost as if football suddenly changed from using 10 yards for a first down to only using seven, but no one told the players.
I can’t picture all the ramifications, but for certain, it’s a major change to the cost of capital. I would think lower “equilibrium” rates would depress dividend-payout ratios, since stocks wouldn’t have very strong competition from the short end of the bond market. It would also justify lower long-term rates, which is exactly what we’ve been seeing, so I’m not ready to dismiss Dudley just yet.
The AT&T Deal for DirecTV
In the last CWS Market Review I sent you, I said a deal between DirecTV ($DTV) and AT&T ($T) could come within two weeks. Well…my time horizon was way too long! The deal came a few hours later. It’s now official: AT&T and DirecTV are getting hitched. Here’s the Flash Alert I sent out on Sunday, May 18:
The merger deal calls for AT&T to buy DirecTV for $95 per share. The deal is a mix of cash and stock. The cash portion is $28.50 per share, and the stock portion is $66.50 worth of AT&T. They added a “collar” to the deal so no one is overly punished by a big swing in AT&T’s share price.
Here’s how it works: DTV shareholders will get 1.905 shares of AT&T if it’s below $34.90 when the deal closes. If AT&T is above $38.58 at closing, then they’ll get 1.724 shares of AT&T. If it’s between those two, they’ll get whatever ratio works out to $66.50 per share.
I expected shares of DTV to bounce up on the news, but it hasn’t happened. I think Wall Street suspects there are still some big obstacles to overcome. For one, there are regulatory concerns. AT&T will probably ditch some of their holdings to appease the government. That’s to be expected. They’ll need to convince the Federales that this is in the best interest of consumers.
There’s also the Sunday Ticket, which is DTV’s very lucrative deal with the NFL. In fact, AT&T is allowed to back out if DTV can’t extend their relationship with the NFL. For their part, AT&T said they expect an agreement to be reached, and I think they’re right about that.
I raised my buy below price on DTV to $95 per share. I expect this deal to close, but it will most likely take several months, perhaps more than one year. There’s no need for anyone to sell DTV, but your up side, at this point, is rather limited.
Medtronic Is a Buy up to $65 per Share
Now let’s look at two Buy List earnings reports we had last week. Last Tuesday, Medtronic ($MDT) reported Q4 earnings of $1.12 per share. That matched expectations, although I expected a little more.
“In our fourth quarter, our overall organization once again delivered balanced growth, with strong performances in some areas more than offsetting challenges in other parts of our business,” said Omar Ishrak, Medtronic’s chairman and chief executive officer. “We remain focused on delivering consistent and dependable growth across all of our businesses through our three growth vectors: new therapies, emerging markets, and independent services and solutions.”
Some good news is that the company finally settled its dispute with Edwards Lifesciences ($EW) over their CoreValve heart valve. Medtronic has agreed to pay EW $750 million plus royalty payments over the next eight years. As part of the settlement, both companies have agreed to stop suing the pants off each other. It’s time to move on.
Now for guidance. For this fiscal year, Medtronic sees earnings ranging between $4 and $4.10 per share. The Street had been expecting $4.09 per share. They expect revenue growth of 3% to 5% on a constant-currency basis.
The shares initially reacted poorly to the earnings news. But within a few days, the stock made back everything it had lost. It’s amazing what waiting a few days can do. Next month, I expect another dividend increase. I think Medtronic will raise their quarterly dividend from 28 cents to about 30 cents per share. Medtronic continues to be a very good buy up to $65 per share.
Ross Stores Reports Inline, Raises Guidance
A week ago Thursday, Ross Stores ($ROST) reported Q1 earnings of $1.15 per share, which matched the Street’s estimates. These are decent results, and they could have been a lot worse. Many other retailers put up some bad numbers. Frankly, I had been expecting more, but I hold Ross to a high standard. For Ross, revenue was up 5.6% last quarter to $2.68 billion, which was just shy of consensus. Comparable-store sales, which is the key metric for retailers, were up 1% for the quarter.
For Q2, Ross sees earnings of $1.05 to $1.09 per share and comparable-store sales growth of 1% to 2%. The Street had been expecting $1.08 per share. Bear in mind that Ross had a range of $1.11 to $1.15 per share for Q1, so they tended to be modest with their expectations.
For the entire year, Ross projects earnings of $4.09 to $4.21 per share. That’s an increase of four cents per share to the low end. The consensus on the Street is for $4.21 per share.
CEO Michael Balmuth said, “First-quarter earnings per share performed at the high end of our guidance as strict inventory and expense controls offset the impact from unfavorable weather and a more challenging retail environment. Sales trends improved in April, with more seasonal spring weather that coincided with the later Easter shopping period. Operating margin for the quarter was better than forecasted, declining 25 basis points to 14.6%. A 35 basis-point increase in cost of goods sold was partially offset by a 10 basis-point improvement in selling, general and administrative costs.”
I’m keeping our Buy Below at $76 per share, which is fairly wide, but I think Ross is underpriced here. Ross Stores remains a solid buy.
Buy List Updates
I wanted to add a few comments about some of our other Buy List stocks. Shares of Stryker ($SYK) got a nice lift this week after the company said it won’t be bidding for Smith & Nephew. That’s a smart move. I’m raising our Buy Below to $87 per share. I like Stryker a lot.
If you’re looking to start new positions, two of the best bargains on our Buy List are Bed, Bath & Beyond ($BBBY) and AFLAC ($AFL). My only caution is that it may take a while for the value to appear. AFLAC now yields 2.4%, and I expect to see a dividend increase later this year. BBBY is a buy up to $66 per share, and AFL is a buy up to $68 per share.
Express Scripts ($ESRX) got clobbered after its last earnings report. But as we often see with our Buy List, high-quality stocks prove to be sturdy. Shares of ESRX have rallied ever since. This week, I’m raising our Buy Below on Express Scripts to $74 per share.
CR Bard ($BCR) is another stock that’s been looking strong lately. The last earnings report was decent, in my view, even though it had a delayed reaction on Wall Street. Look for another dividend increase soon. CR Bard has raised their dividend every year since 1972. I’m raising our Buy Below to $151 per share.
Moog ($MOG-A) continues its surprising rally. The stock is up close to 20% in the last seven weeks. I don’t think a lot of folks saw that coming. I’m raising my Buy Below on Moog to $76 per share.
That’s all for now. Next week is a big week for economic reports. On Monday, the May ISM report comes out. Then on Tuesday, we’ll get a look at factory orders. On Wednesday, the Fed releases its Beige Book report. We’ll also see the latest reports on productivity, plus ADP releases its jobs report. Then on Friday comes the big May jobs report from the government. The last payroll report was a shocker (+288,000). It’s also very likely that the economy will finally surpass the payroll employment peak from 2008. Be sure to keep checking the blog for daily updates. I’ll have more market analysis for you in the next issue of CWS Market Review!
– Eddy
-
Morning News: May 30, 2014
Posted by Eddy Elfenbein on May 30th, 2014 at 6:44 amUtilities Fall as European Shares Hold Near Six-Year Highs
Realty Investors Flock to Spain
BOJ Should Clarify Asset Buying Plan Beyond 2014: IMF
U.S. Seeks $10 Billion Penalty From BNP Paribas For Evading Sanctions
The VIX Mystery: Here’s What Investors Need to Know
You Can Now Ask Google to Remove Links About You
As Hachette Battles Amazon, A Small Publisher Defends Bezos
Tyson Enters Bidding for Hillshire Brands With $6.1 Billion Offer
Pending Home Sales Rise Below Forecast As Prices Lift
Abercrombie Says It Sees the Light
VW to Bring Models to U.S. More Quickly to Lure Consumers
Virgin Galactic Signs Spaceflight Deal With U.S. Authority
Southwest Airlines Hit With Second $200,000 Fine Over Fare Ads
Roger Nusbaum: Get the Beta Right
Credit Writedowns: Some Things to Consider if Spain Leaves the Euro
Be sure to follow me on Twitter.
-
Q1 GDP Falls 1%
Posted by Eddy Elfenbein on May 29th, 2014 at 10:10 amThe government reported that for the first time in three years, the economy contracted. Real GDP dropped by 1% for the first quarter of this year.
Remember that the first quarter began five months ago and ended two months ago. Wall Street currently expects good numbers for Q2 and for the rest of this year.
-
Morning News: May 29, 2014
Posted by Eddy Elfenbein on May 29th, 2014 at 6:40 amWorld Stocks Lackluster Ahead of US Growth Update
Shares Flirt With Record Highs on ECB Easing Bets
Japan Retail Sales Fall at Record Pace After Tax Increase
Spain Growth Accelerates as Household, Government Spending Rise
Treasury Yields Dip to New 2014 Lows
Oil Steady Ahead of U.S. Inventory Data
Goldman Shuns Bonds Pimco’s Gross Favors in ‘New Neutral’
iTunes Head Cue and Beat’s Iovine: Apple Will Put Beats on Steroids
Costco Wholesale Third-Quarter Profit Rises 3%
McDonald’s Plans Up to $20 Billion in Buybacks, Dividends
ExtraHop Closes $41 Million in Series C Funding to Establish New Enterprise IT Category
AMSURG Corp. to Acquire Sheridan Healthcare in Transformational Transaction Valued at $2.35 Billion
Dish to Become Largest Company to Accept Bitcoin
Bezos’ Bitter Book Battle With Hachette
Joshua Brown: Brokers, Liquid Alts and the Fund That Never Goes Up
Cullen Roche: The “Sharing Economy” Isn’t the Economy
Be sure to follow me on Twitter.
-
May 1970 – the Month the 1960s Boom Finally Ended
Posted by Eddy Elfenbein on May 28th, 2014 at 2:36 pmFrom Gary Alexander at Navellier MarketMail:
On April 30, 1970, President Nixon came on national television to explain why he was expanding the Vietnam War into Cambodia. That set off a firestorm of protest, including the closure or partial shutdown of classes in over 450 college campuses, climaxed by the death of four students at Kent State on May 4.
The Dow collapsed on the Kent State killings – the greatest one-day drop in seven years, falling 2.6% to 714. In addition, May 4, 1970 was the day on which regular trading hours resumed on NYSE after a two-year experiment with shorter hours. From June to December 1968, the market closed each Wednesday. Then the market had limited hours (closing at 2:00 pm) in the first half of 1969 – all as part of an attempt to keep up with the huge volume of backroom work during the peak Go-Go years of the late 1960s.
The next day, Tuesday, May 5, Arthur Burns’ Federal Reserve leaped into the breach by reducing credit requirements on stock purchases from 80% down to 65%, even while some of the most glamorous stocks were collapsing. (On Friday, May 8 in Geneva, Bernie Cornfeld was forced out of Investors Overseas Service (IOS), which fell to a penny a share by 1972. On May 17 in Dallas, James Ling quietly resigned as CEO of trendy conglomerate Ling-Temco-Vought, whose stock price had fallen from $170 to $16.)
On Friday, May 22, a day on which the Dow hit a seven-year low, New York Stock Exchange President Bernard (“Bunny”) Lasker asked for and got an immediate audience with President Nixon, telling the President that the country was “five minutes till midnight of another 1929.” With no Memorial Day to stop the bleeding, the Dow dropped 20.81 points on Monday, May 25, the biggest one-day drop since the Kennedy assassination in 1963. With the Dow at 640, the reigning Dr. Doom, Elliot “Calamity” Janeway began talking about a Dow at 500 while John Kenneth Galbraith compared the current “insanity” to 1929.
The next day, May 26, the Dow hit its absolute bottom of the bear market at 631, and President Nixon called a meeting of 60 or more leading financial and business leaders to the White House on May 27.
That Wednesday meeting was “a cocktail hour of staggering economic importance,” according to John Brooks, since their appearance of action fueled a rally of historical proportions, a +5% 32-point Dow rally on May 27. For the three DAYS ending May 29, 1970, the Dow rose by an astounding 11%, even though the previous week, ending May 22, marked the fourth largest post-war weekly Dow drop to that date.
The bear market was over – 1929 was avoided – but there was a massive amount of cleaning up to do in the second half of 1970. Ross Perot was called in to save F.I. du Pont & Co, the nation’s third-largest brokerage firm (behind Merrill Lynch and Bache). By December 1, 1970, according to John Brooks:
“Wall Street hung by its fingertips. Roughly one hundred Stock Exchange firms had vanished over the past two years through merger or liquidation. Forty thousand customer accounts were involved in the 13 cases of liquidation, and most of them were still tied up, the customers, unable to get their cash or securities.”
—The Go-Go Years, by John Brooks, page 342
-
Archives
- June 2026
- May 2026
- April 2026
- March 2026
- February 2026
- January 2026
- December 2025
- November 2025
- October 2025
- September 2025
- August 2025
- July 2025
- June 2025
- May 2025
- April 2025
- March 2025
- February 2025
- January 2025
- December 2024
- November 2024
- October 2024
- September 2024
- August 2024
- July 2024
- June 2024
- May 2024
- April 2024
- March 2024
- February 2024
- January 2024
- December 2023
- November 2023
- October 2023
- September 2023
- August 2023
- July 2023
- June 2023
- May 2023
- April 2023
- March 2023
- February 2023
- January 2023
- December 2022
- November 2022
- October 2022
- September 2022
- August 2022
- July 2022
- June 2022
- May 2022
- April 2022
- March 2022
- February 2022
- January 2022
- December 2021
- November 2021
- October 2021
- September 2021
- August 2021
- July 2021
- June 2021
- May 2021
- April 2021
- March 2021
- February 2021
- January 2021
- December 2020
- November 2020
- October 2020
- September 2020
- August 2020
- July 2020
- June 2020
- May 2020
- April 2020
- March 2020
- February 2020
- January 2020
- December 2019
- November 2019
- October 2019
- September 2019
- August 2019
- July 2019
- June 2019
- May 2019
- April 2019
- March 2019
- February 2019
- January 2019
- December 2018
- November 2018
- October 2018
- September 2018
- August 2018
- July 2018
- June 2018
- May 2018
- April 2018
- March 2018
- February 2018
- January 2018
- December 2017
- November 2017
- October 2017
- September 2017
- August 2017
- July 2017
- June 2017
- May 2017
- April 2017
- March 2017
- February 2017
- January 2017
- December 2016
- November 2016
- October 2016
- September 2016
- August 2016
- July 2016
- June 2016
- May 2016
- April 2016
- March 2016
- February 2016
- January 2016
- December 2015
- November 2015
- October 2015
- September 2015
- August 2015
- July 2015
- June 2015
- May 2015
- April 2015
- March 2015
- February 2015
- January 2015
- December 2014
- November 2014
- October 2014
- September 2014
- August 2014
- July 2014
- June 2014
- May 2014
- April 2014
- March 2014
- February 2014
- January 2014
- December 2013
- November 2013
- October 2013
- September 2013
- August 2013
- July 2013
- June 2013
- May 2013
- April 2013
- March 2013
- February 2013
- January 2013
- December 2012
- November 2012
- October 2012
- September 2012
- August 2012
- July 2012
- June 2012
- May 2012
- April 2012
- March 2012
- February 2012
- January 2012
- December 2011
- November 2011
- October 2011
- September 2011
- August 2011
- July 2011
- June 2011
- May 2011
- April 2011
- March 2011
- February 2011
- January 2011
- December 2010
- November 2010
- October 2010
- September 2010
- August 2010
- July 2010
- June 2010
- May 2010
- April 2010
- March 2010
- February 2010
- January 2010
- December 2009
- November 2009
- October 2009
- September 2009
- August 2009
- July 2009
- June 2009
- May 2009
- April 2009
- March 2009
- February 2009
- January 2009
- December 2008
- November 2008
- October 2008
- September 2008
- August 2008
- July 2008
- June 2008
- May 2008
- April 2008
- March 2008
- February 2008
- January 2008
- December 2007
- November 2007
- October 2007
- September 2007
- August 2007
- July 2007
- June 2007
- May 2007
- April 2007
- March 2007
- February 2007
- January 2007
- December 2006
- November 2006
- October 2006
- September 2006
- August 2006
- July 2006
- June 2006
- May 2006
- April 2006
- March 2006
- February 2006
- January 2006
- December 2005
- November 2005
- October 2005
- September 2005
- August 2005
- July 2005
 Eddy Elfenbein is a Washington, DC-based speaker, portfolio manager and editor of the blog Crossing Wall Street. His