-
Dept. of Misleading Stats
Posted by Eddy Elfenbein on April 30th, 2014 at 10:04 amOne of my pet peeves is misleading statistics. It’s one thing when facts are simply wrong, but it’s another when the numbers are accurate but they’re presented in such a way as to tell a different story.
This morning, Brett Arends, one of my favorite columnists at the WSJ tweeted this out:
Over 90% of the returns from US stocks since 1927 are an illusion caused by inflation pic.twitter.com/jOIUfu8mL6
— Brett Arends (@BrettArends) April 30, 2014
Is that right that inflation has eaten up 90% of stock gains? Yes, but no. The chart is accurate, or at least it looks similar to my data. The problem is the 90%. The reason why is that it uses a linear measure against compound growth. I’m throwing out my red flag. When you mix those two measures, the 90% figure is meaningless. All it really tells us is that inflation averaged about 2.8% per year (growth of 2.78% for 84 years equals tenfold).
Put it this way: If you have any data series with positive inflation, after a long enough period, inflation will reach “90%.” The nominal figure will by definition grow faster, and those gains will compound themselves.
If the stock market returned 10% per year in nominal terms and real returns averaged 9.9%, after 2,300 years, by the methodology described, inflation will have taken 90% of the gains. The numbers are correct, but interpretation is misleading.
Here’s another example of misleading stats. Please bear in mind that I’m not saying the numbers are incorrect, just how we read them.
You’ll often hear that from the March 2000 peak to the March 2009 low, the stock market lost 46% (the Wilshire 5000). That’s correct. But if you take a starting point 18 months before the peak, and an ending point one year after the low, then the market made 78%. It’s true that I’m being selective with my data, but what’s so special about measuring from the peak to trough?
-
What if the Stock Market Were a Bond?
Posted by Eddy Elfenbein on April 30th, 2014 at 9:39 amHere’s an update to one of my more off-the-wall ideas. I was curious to see what the historical performance of the stock market looks like, but in the form of a bond.
Crazy? Let me explain.
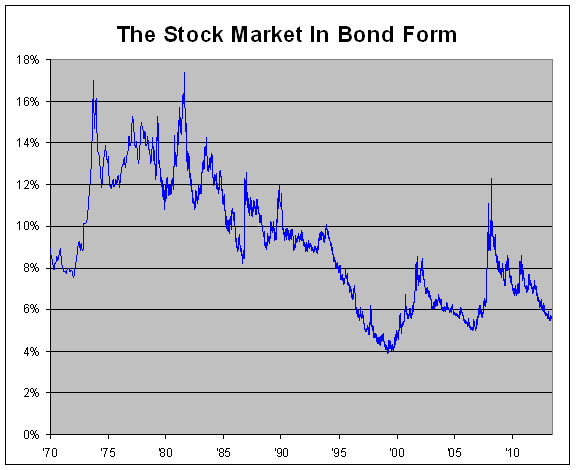
I took all of the historical market performance of the Wilshire 5000 (including dividends) and invented a hypothetical long-term bond that matched the market’s daily gains step-for-step.
I assumed that it’s a bond of infinite maturity and pays a fixed coupon.
There’s one hitch, though. I have to choose a starting yield-to-maturity for the beginning of the data series in December 1970. So this isn’t a completely kosher experiment because the starting point is based on my guess.
If I choose a number that’s too high, the historical performance won’t be able to keep up, and the yield-to-maturity would grow higher and higher and soon leave orbit. Conversely, if my starting YTM is too low, the yield would gradually get pushed down to microscopic levels.
Fortunately, the data makes my job easy. After four decades, the window I have to work with is pretty narrow. Starting with 10% is too high, and 8% is too low. After playing with the numbers, I finally settled on 8.93%.
Even though this “bond” is completely make-believe, it reflects what the actual stock market really did for the past 43 years. Through yesterday, the “bond’s” yield stood at 5.63%.
Here’s what the actual stock market looks like, expressed in the form of a bond:
-
Q1 GDP Growth = 0.1%
Posted by Eddy Elfenbein on April 30th, 2014 at 9:27 amThe government reported that the economy grew by a measly 0.1% in the first quarter of this year. That’s a terrible number. Obviously, the weather was an issue, but even so, 0.1% is very bad.
This was the worst quarter for the economy since the first quarter of 2011. We barely came in below the growth rate of the fourth quarter of 2012. Over the last seven years, the economy has grown by 8.3% in real terms. In the last 32 quarters, economic growth has topped 3.2% only five times. The U.S. economy grew less over the last 14 years than it did in the seven years prior to that.
-
Morning News: April 30, 2014
Posted by Eddy Elfenbein on April 30th, 2014 at 6:24 amEuro Edges Lower Ahead of Pre-ECB Inflation Data
Nikke Pares Gains as BOJ Stands Pat, Set to Fall for 4th-Straight Month
France Won’t Block Alstom Bids If Keeps Control of Nuclear Assets
George Osborne Loses Legal Challenge to Robin Hood Tax
Budget Cutbacks Spurring Defense Mergers
BNP Warns U.S. Fine May “Far Exceed” $1.1 Billion Provision
Twitter Beats Estimates, But Shares Slammed on User Growth Worries
3D Systems Reports First Quarter 2014 Financial Results
Shell Profit Beats Analyst Estimates on Higher Gas Earnings
Target’s Move to Chip and PIN Seeks to Assure Consumers
If Apple Did What eBay Has Just Done Then They’d Have A $44 Billion Tax Bill
Wal-Mart Brings One-Stop Shopping to Car Insurance
Coach Gets Marked Down, But It’s Still No Bargain
Jeff Carter: DATA Act Passes Congress-Now What?
Edward Harrison: Steve Hanke on Currency Boards and Paul Brodsky on Bottom-Up Investing
Be sure to follow me on Twitter.
-
Four Buy List Earnings Reports
Posted by Eddy Elfenbein on April 29th, 2014 at 7:34 pmAfter the closing bell, we had four Buy List earnings reports. Here’s a summary:
AFLAC ($AFL) actually reported results slightly before the closing bell, but it’s the same story we know well. The supplemental insurance company is doing very well businesswise but the yen is eating their profits. For Q1, AFLAC had operating earnings of $1.69 per share. The weak yen knocked off ten cents per share. Excluding currency, operating earnings were up 5.9% from a year ago.
Now for guidance. For Q2, AFLAC sees earnings ranging between $1.54 and $1.68 per share. That’s pretty good. Wall Street had been expecting $1.58. The downside is that AFLAC lowered their full-year guidance. The original range was $6.31 to $6.49 per share. Now it’s $6.06 to $6.40 per share. Those estimates are based on a yen/dollar rate between 100 and 105. The stock got a nice jump in the last few minutes of trading on Tuesday.
Now on to eBay ($EBAY) which gets a lot of attention on the Street. The company reported Q1 adjusted earnings of 70 cents per share which beat the Street by three cents per share. Officially, eBay lost $2.3 billion last quarter going by net earnings but that’s because they took a massive tax charge in order to repatriate foreign earnings.
For Q2, eBay sees earnings of 67 to 69 cents per share which was a tad below the Street’s consensus of 70 cents per share. Importantly, eBay reiterated their full-year guidance of $2.95 to $3.00 per share. Wall Street is at $2.99 per share. These numbers are pretty much what I expected, although the shares were down 4.3% in the after-hours market.
Express Scripts ($ESRX) reported Q1 earnings of 99 cents per share which was two cents below expectations. One troubling note is that they lowered their full-year guidance by six cents per share at each end. The new range is $4.82 to $4.94 per share, but that’s still year-over-year growth of 17% to 20%. The shares were down more than 5% in the after-hours market.
Fiserv ($FISV) may be the big star of this earnings season. For Q1, they made 82 cents per share which easily beat Wall Street’s estimates of 74 cents per share. Earnings were up 22% from a year ago while quarterly revenue was up 7.1% to $1.23 billion which also beat expectations. Fiserv reaffirmed full-year guidance of $3.28 to $3.37 per share which represents growth of 10% to 13%. The stock rallied 1.25% today, and was up another 3.1% in the after-hours market.
-
Europe Recovers—Slowly
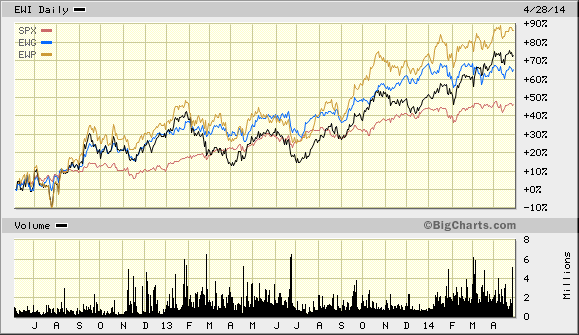
Posted by Eddy Elfenbein on April 29th, 2014 at 11:47 amIt wasn’t that long ago that Europe was falling apart. The economies there are still in rough shape, but their stock markets are doing well. The lesson for investors is that things do turn around, it’s just a matter of time.
Here’s a look at the ETFs for Spain ($EWP), Italy ($EWI) and Germany ($EWG). I also included the S&P 500 for comparison.
-
Another Lucky Tuesday
Posted by Eddy Elfenbein on April 29th, 2014 at 11:02 amThe stock market is up again today, at least by a little bit. Interestingly, Tuesdays have been the lucky day of the year. So far, the S&P 500 has risen on 13 of the 15 Tuesdays in 2014.
Today is also a big day for earnings. We have four Buy List stocks due to report after the close. This is also the beginning of a two-day Fed meeting, so expect a lot of news this week.
In yesterday’s market, we saw a big split between value and growth stocks. That’s continuing today, but not as wide. The split between Value and Growth, which has been so big last month, slowed down over the past few weeks, but it’s heated up again. This could last for a while.
In economic news, today’s Case-Shiller Index showed that home prices rose 12.9% over the past year through February. Also, consumer confidence fell a bit in April. The Conference Board Index dropped from 83.9 to 82.3. Consumer confidence is still near a six-year high.
A quick word about the bond market. I’ve been surprised at how steady rates have been. The 10-year yield has been locked in a trading range, between 2.6% and 2.8%, for three months. The bond market has been much stronger this year than I expected.
Yesterday, Bank of America ($BAC) dropped sharply today after the company said it was abandoning its dividend increase and share buyback plan. The bank said it discovered flaws in the info it provided to the Fed for its stress test. BAC had planned to raise its dividend from one penny to five cents per share. That’s embarrassing but they did the right thing by coming clean. By many measures, BAC seems cheap, but I won’t even consider it until they start paying a respectable dividend.
One interesting note about BAC. Due to its low share price, it’s a favorite among traders. The stock usually tops the daily list of high volume stocks. BAC trades an average of 109 million shares each day. Wow! That’s more than 4,600 shares every second, and it’s much higher than that towards the opening and closing bells. Yesterday, BAC traded an astounding 344 million shares, including 20 million in the first five minutes.
-
Morning News: April 29, 2014
Posted by Eddy Elfenbein on April 29th, 2014 at 6:45 amWhy Draghi Believes the FOMC Way Is The Best Way
Spanish Jobless Rate Falls From Year Ago
Yellen’s Dots Dash Effort for Greater Fed Clarity on Rate Rises
Bank of America’s Bad Accounting
Banco Santander Offers to Buy 25% Of Its Brazilian Subsidiary
Deutsche Bank Profit Beats Estimates on Trading Revenue
GE Trumpets 40-year Jet Engine Venture to Bolster Alstom Bid
Texas Enterprise Fund Will Grant $40 Million to Toyota
Samsung Mobile Sales Fall as Chinese Rivals Win Customers
AstraZeneca Chief Puts Cancer Ahead of Megadeals
Nokia Names Networks Head Rajeev Suri as CEO
Warren Buffett Defends High CEO Pay: It’s Not ‘Out Of Whack’
Forest Laboratories to Acquire Furiex for $1.1 Billion
Cullen Roche: Our Unhealthy Obsession With Central Banks
Howard Lindzon: What is The Market Whispering…and Hiding Out in France – The New Safe Haven?
Be sure to follow me on Twitter.
-
Morning News: April 28, 2014
Posted by Eddy Elfenbein on April 28th, 2014 at 6:50 amStrong Euro is a Powerful Deflationary Factor: ECB’s Christian Noyer
Russian Billions Scattered Abroad Show Trail to Putin Circle
France Says Could Block Alstom Deal as President Meets GE’s CEO Jeff Immelt
International Monetary Fund Raises China growth Outlook
Oil Climbs on Worries Over Ukraine Crisis
Fannie-Freddie Fate Hangs on Senate Action This Week: Mortgages
Pfizer Offering $100 Billion for AstraZeneca
Gibson Brands Announces Agreement to Acquire Philips’ Audio and Home Entertainment Business
Sweden’s Meda Rejects Sweetened Bid From Mylan
Panasonic Expects 16% Profit Rise This Full Year
Holcim Reports Lower Sales and Profits on Currency Movements
Charter Reaches Deal With Comcast for Subscribers
Toyota Restructures U.S. Marketing Arm; Voluntary Exits Offered
Joshua Brown: “the most important thing going on in global markets”
Jeff Miller: Weighing the Week Ahead: Time to Sell in May?
Be sure to follow me on Twitter.
-
FT: 2,500 Years of Financial Crises
Posted by Eddy Elfenbein on April 25th, 2014 at 9:35 am
-
Archives
- October 2026
- September 2026
- August 2026
- July 2026
- June 2026
- May 2026
- April 2026
- March 2026
- February 2026
- January 2026
- December 2025
- November 2025
- October 2025
- September 2025
- August 2025
- July 2025
- June 2025
- May 2025
- April 2025
- March 2025
- February 2025
- January 2025
- December 2024
- November 2024
- October 2024
- September 2024
- August 2024
- July 2024
- June 2024
- May 2024
- April 2024
- March 2024
- February 2024
- January 2024
- December 2023
- November 2023
- October 2023
- September 2023
- August 2023
- July 2023
- June 2023
- May 2023
- April 2023
- March 2023
- February 2023
- January 2023
- December 2022
- November 2022
- October 2022
- September 2022
- August 2022
- July 2022
- June 2022
- May 2022
- April 2022
- March 2022
- February 2022
- January 2022
- December 2021
- November 2021
- October 2021
- September 2021
- August 2021
- July 2021
- June 2021
- May 2021
- April 2021
- March 2021
- February 2021
- January 2021
- December 2020
- November 2020
- October 2020
- September 2020
- August 2020
- July 2020
- June 2020
- May 2020
- April 2020
- March 2020
- February 2020
- January 2020
- December 2019
- November 2019
- October 2019
- September 2019
- August 2019
- July 2019
- June 2019
- May 2019
- April 2019
- March 2019
- February 2019
- January 2019
- December 2018
- November 2018
- October 2018
- September 2018
- August 2018
- July 2018
- June 2018
- May 2018
- April 2018
- March 2018
- February 2018
- January 2018
- December 2017
- November 2017
- October 2017
- September 2017
- August 2017
- July 2017
- June 2017
- May 2017
- April 2017
- March 2017
- February 2017
- January 2017
- December 2016
- November 2016
- October 2016
- September 2016
- August 2016
- July 2016
- June 2016
- May 2016
- April 2016
- March 2016
- February 2016
- January 2016
- December 2015
- November 2015
- October 2015
- September 2015
- August 2015
- July 2015
- June 2015
- May 2015
- April 2015
- March 2015
- February 2015
- January 2015
- December 2014
- November 2014
- October 2014
- September 2014
- August 2014
- July 2014
- June 2014
- May 2014
- April 2014
- March 2014
- February 2014
- January 2014
- December 2013
- November 2013
- October 2013
- September 2013
- August 2013
- July 2013
- June 2013
- May 2013
- April 2013
- March 2013
- February 2013
- January 2013
- December 2012
- November 2012
- October 2012
- September 2012
- August 2012
- July 2012
- June 2012
- May 2012
- April 2012
- March 2012
- February 2012
- January 2012
- December 2011
- November 2011
- October 2011
- September 2011
- August 2011
- July 2011
- June 2011
- May 2011
- April 2011
- March 2011
- February 2011
- January 2011
- December 2010
- November 2010
- October 2010
- September 2010
- August 2010
- July 2010
- June 2010
- May 2010
- April 2010
- March 2010
- February 2010
- January 2010
- December 2009
- November 2009
- October 2009
- September 2009
- August 2009
- July 2009
- June 2009
- May 2009
- April 2009
- March 2009
- February 2009
- January 2009
- December 2008
- November 2008
- October 2008
- September 2008
- August 2008
- July 2008
- June 2008
- May 2008
- April 2008
- March 2008
- February 2008
- January 2008
- December 2007
- November 2007
- October 2007
- September 2007
- August 2007
- July 2007
- June 2007
- May 2007
- April 2007
- March 2007
- February 2007
- January 2007
- December 2006
- November 2006
- October 2006
- September 2006
- August 2006
- July 2006
- June 2006
- May 2006
- April 2006
- March 2006
- February 2006
- January 2006
- December 2005
- November 2005
- October 2005
- September 2005
- August 2005
- July 2005
 Eddy Elfenbein is a Washington, DC-based speaker, portfolio manager and editor of the blog Crossing Wall Street. His