-
Medtronic Earns 91 Cents Per Share
Posted by Eddy Elfenbein on February 18th, 2014 at 9:44 amMedtronic ($MDT) just reported Q3 earnings of 91 cents per share which matched expectations. Revenues rose 3.4% to $4.16 billion which was $10 million more than forecast.
Medtronic also narrowed its full-year guidance from $3.80 – $3.85 per share to $3.81 – $3.83 per share. For the first three quarters of their fiscal year, MDT has earned $2.70 per share, so that implies fiscal Q4 earnings of $1.11 to $1.13 per share. Wall Street had been expecting $1.12 per share.
This was a good report. The stock is currently down about 2% but I doubt it will last.
-
Forest Labs to Be Bought Out
Posted by Eddy Elfenbein on February 18th, 2014 at 9:12 amThe big merger news this morning is that Actavis is going to buy Forest Labs ($FRX) for $25 billion. The cash-and-stock deal is for $89.48 per share which is a 25% premium over FRX’s close on Friday.
Forest Labs is notable because it’s been one of the best performing stocks for many years. I should warn you that this long-term data isn’t always reliable but according to the charts at Google Finance, FRX was going for 2.7 cents per share in early 1978. That works out to a 330,000% gain over 36 years. That’s more than 25% per year.
I trust the data from Yahoo Finance a little more but it doesn’t go back as far. Yahoo has FRX going for as little as $1.01 per share in May 1988. That adjusts for four 2-for-1 splits.
The shares had hit a peak of $78 in 2004 and had gradually fallen down to $18 by March 2009. As late as November 2012, FRX was going for less than $32 per share.
It’s odd how a company can watch a stock plunge 76% and then see it rebound by 289% — and then decide to buy it for a 25% premium.
-
Morning News: February 18, 2014
Posted by Eddy Elfenbein on February 18th, 2014 at 6:46 amJapanese Stocks Lose Darling Status
Bank of Japan Holds Fire Despite Soft GDP, Expands Loan Programs
Gold Smuggling in India Likely to Rise if Curbs Stay – WGC
Understanding the Crucial Link Between Money Supply and Inflation
Danish Outsourcing Group ISS Plans One of Biggest Nordic IPOs
France Tries to Tempt In More Foreign Investment
European Car Sales Rise a Fifth Month on Volkswagen Growth
FX Traders Facing Extinction as Computers Replace Humans
Hedge Funds Raise Gold Bull Bets as Paulson Holds
Pratt, GE Battle Over Billions in Jet Engine Orders
Temasek Seeks to Sell $3.1 Billion Stake in Thailand’s Shin Corp to SingTel
Jim Rogers Tells Us What Everyone Keeps Getting Wrong About China
Kentucky Announces 5 Hemp Pilot Projects
Joshua Brown: The Best and Worst Thing About Investing
Cullen Roche: Is QE the Future of Monetary Policy?
Be sure to follow me on Twitter.
-
Q4 Earnings Calendar
Posted by Eddy Elfenbein on February 18th, 2014 at 5:31 amSixteen of our 20 Buy List stocks report on the Mar-Jun-Sep-Dec earnings cycle. Here’s a preliminary calendar. Please note that some of these dates may move.
Company Symbol Date Estimate Result Wells Fargo WFC 14-Jan $0.98 $1.00 CA Technologies CA 21-Jan $0.71 $0.84 IBM IBM 21-Jan $5.99 $6.13 eBay EBAY 22-Jan $0.80 $0.81 Stryker SYK 22-Jan $1.22 $1.23 McDonald’s MCD 23-Jan $1.39 $1.40 Microsoft MSFT 23-Jan $0.68 $0.78 Moog MOG-A 24-Jan $0.89 $0.88 Ford Motor F 28-Jan $0.28 $0.31 Qualcomm QCOM 29-Jan $1.18 $1.26 CR Bard BCR 30-Jan $1.39 $1.42 AFLAC AFL 4-Feb $1.39 $1.40 Cognizant CTSH 5-Feb $1.06 $1.06 Fiserv FISV 5-Feb $0.80 $0.79 DirecTV DTV 20-Feb $1.30 $1.53 Express Scripts ESRX 20-Feb $1.12 Value Works But You Need to be Patient
Posted by Eddy Elfenbein on February 17th, 2014 at 6:53 pmInteresting article from James Saft at Reuters:
Ben Inker, of value-investing-orientated funds house GMO LLC, coined the slow trade term to describe a fascinating phenomenon: if something looks good from a value perspective now, you usually do better by waiting a year.
“The slightly odd fact is that moving slowly on value-driven decisions has simply made more money historically than moving immediately would have,” Inker, who is co-head of asset allocation at GMO, wrote in a note to clients.
“Buying the assets that are cheapest at any given point in time has been a profitable strategy historically, but buying the assets that were cheapest on average during the past year, or odder still, the assets that were cheapest a year ago irrespective of their valuation today, has done even better.” (here)
First, let’s look at the data.
Between December 1978 and June 1999 a portfolio comprising equal weights of the two cheapest equity markets outperformed the broad market by 2.8 percent per year in the following year.
Make one little adjustment – hold not what is cheapest today but what was cheapest one year ago – and you up your outperformance to a whopping 7.4 percent annually.
Since June 1999 the outperformance is less, just 1.8 percent annually, as against just an 0.4 percent annual outperformance if you buy what is cheapest in real time. Quite possibly the diminished effect since 1999 is because the globalization of both money flows and policy have cut into the advantages you can wring from country effects on portfolio construction.
Take it to a stock level and the advantages of buying what was cheap a year ago still stand out, according to Inker. If you buy the cheapest 10 percent of the market on a price to book basis you’ll have outperformed the market by 2.5 percent a year since 1965. Do the same thing lagged by a year and you outperform by 3.5 percent.
Even more impressive, the slow trade play seems to be able to help compensate for the general underperformance of cheap stocks since 1992. If you were to have bought the cheapest 10 percent of the market, measured by price to book, since 1992 you would have actually underperformed by 1.6 percent a year. Do it on a one-year delay and you still get a 2 percent outperformance.
Morning News: February 17, 2014
Posted by Eddy Elfenbein on February 17th, 2014 at 6:48 amJapan’s Quarterly Growth Disappoints Ahead of Sales Tax Hike
Shanghai’s Benchmark Share Index Ends in the Black—First Time This Year
Vote on Account 2014: Indian Automobile Industry Welcomes Excise Duty Cut
Thai GDP Growth Slows as Unrest Increases Rate-Cut Pressure
A Test Europe’s Banks Mustn’t Fail
WTI Crude Rises as Improved U.S. Economy Bolsters Demand
Bitcoin Touches $220 On Formerly Dominant Exchange MtGox — After 60% Plunge
Banks Can Now Work With Marijuana Companies, But is Bitcoin Better?
Bouygues to Take €1.4 Billion Write-Down on Its Alstom Stake
Fiat’s Access to Chrysler Funds Curbed By Dividend Distributions Debt Covenants
Punching Above Its Weight, Upstart Netflix Pokes at HBO
Hong Kong Disneyland to Open Its Biggest Hotel as Visitors Surge
David Einhorn Will Say What Stocks He Owns When He’s Good and Ready
Roger Nusbaum: What Harvard Can Teach Us About Portfolio Management
Jeff Miller: Weighing the Week Ahead: Is the Correction Over?
Be sure to follow me on Twitter.
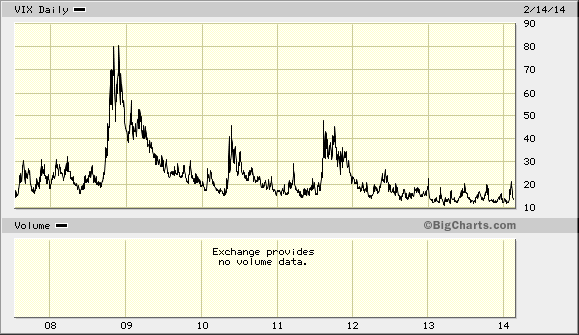
The VIX Surge — In Context
Posted by Eddy Elfenbein on February 16th, 2014 at 8:36 pmLately, Wall Street was rocked by a surge in the Volatility Index, better known as the VIX. Here’s a look at the VIX spike, except I added a little more context:
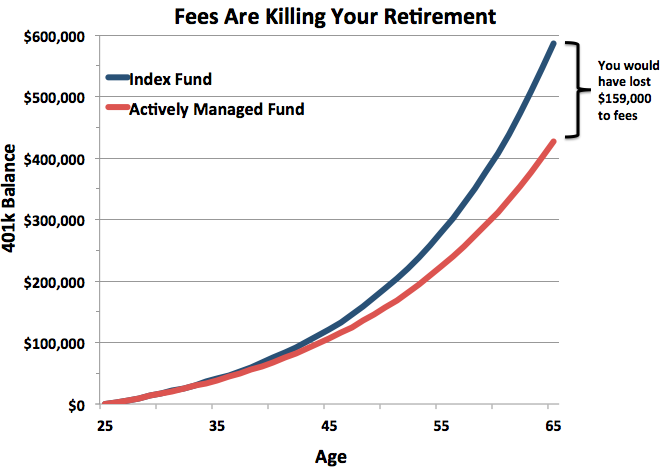
Protect Your Retirement from Killer Fees
Posted by Eddy Elfenbein on February 16th, 2014 at 8:26 pmAt the Atlantic, Matthew O’Brien breaks down how much fees eat into your portfolio:
Those fees don’t sound too bad—just 1 percent!—but this is where our total lack of intuition for how compounding works really hurts us. Let’s try an example: what’s 0.99 to the 40th power? It’s not exactly a calculation you can do in your head. It’s not even one you can estimate. But it’s the kind of calculation that you need to do to figure out how much your 401(k) fees are costing you.
The answer is a lot more than you think. (No cheating with a calculator before we get to the big reveal). Now, let’s say you contribute $3,000 to your 401(k) every year, which is a little more than the national average, starting when you’re 25. Let’s also say that you’re choosing between two investments: the lowest-cost index fund with a 0.08 percent fee, and a typical managed stock fund with, according to Morningstar, a 1.33 percent fee. And finally, let’s say that, though you don’t know it, they both return 7 percent a year, because, as we saw above, most managed funds don’t beat the market.
This 1.25 percent difference in annual fees adds up to a six-figure difference in lifetime earnings. That’s because you don’t just lose the money you pay in fees. You lose the returns you could have had on the money you pay in fees, too. As you can see in the chart below, this compounding effect doesn’t matter much for the first 20 years or so, but really accelerates after that. If you chose the lowest-cost index fund, you’d have $15,000 more at age 45, $55,000 more at 55, and $159,000 more at 65. That would balloon to $257,000 more if you waited to retire at 70.
2015 S&P 500 Earnings Estimate = $137
Posted by Eddy Elfenbein on February 16th, 2014 at 6:02 pmHere’s a look at the S&P 500 (black line, left scale) along with its earnings (yellow line, right scale). The two lines are scaled at a ratio of 16-to-1 so whenever the lines cross, the market’s P/E Ratio is exactly 16.
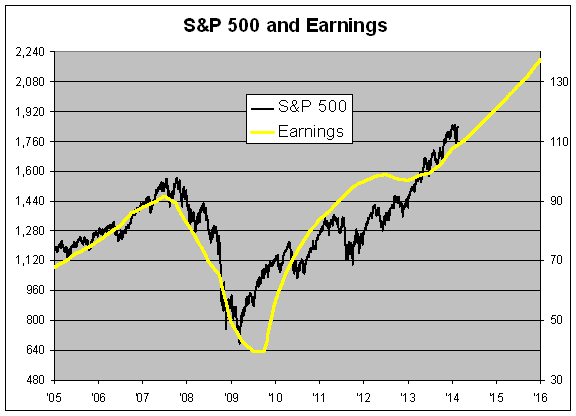
The future part of the earnings line is the consensus estimate from Wall Street analysts. I’m not a terribly big fan of estimates from Wall Street and this chart shows why.
As you can see, the yellow line becomes improbably straight in the future. As a bottom, what analysts do is take the existing trend and assume it continues into the future. That’s not necessarily a dangerous assumption, but it’s also important not to take these predictions too seriously.
The finals numbers for 2013 are in and it appears as if the S&P 500 earned $107. Wall Street currently expects earnings of $121 for 2014 and $137 for 2015. I strongly suspect that the 2015 estimate is too high and will gradually come down over the next two years. By the way, for the S&P 500 to reach 16 times 2015’s earnings, it would have to be at 2,200, which is a 20% jump from here.
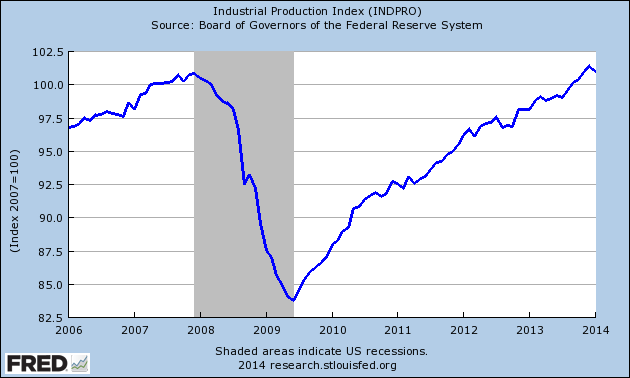
Industrial Production Drops in January
Posted by Eddy Elfenbein on February 14th, 2014 at 2:17 pmThe Federal Reserve reported that industrial production dropped 0.3% last month. This was the biggest fall in nearly five years.
The 0.8 percent decrease at manufacturers followed a revised 0.3 percent gain the prior month that was weaker than initially reported, figures from the Federal Reserve showed today in Washington. The median forecast in a Bloomberg survey of economists called for a 0.1 percent advance. Total industrial production dropped 0.3 percent even as utility output climbed the most in almost a year.
Assembly lines slowed last month as colder weather tempered production, the Fed said, showing a pause in the momentum of an industry that’s helped bolster the economy. A pickup in capital spending and faster hiring that drives consumer purchases will be needed to spur production gains.
-
Archives
- June 2026
- May 2026
- April 2026
- March 2026
- February 2026
- January 2026
- December 2025
- November 2025
- October 2025
- September 2025
- August 2025
- July 2025
- June 2025
- May 2025
- April 2025
- March 2025
- February 2025
- January 2025
- December 2024
- November 2024
- October 2024
- September 2024
- August 2024
- July 2024
- June 2024
- May 2024
- April 2024
- March 2024
- February 2024
- January 2024
- December 2023
- November 2023
- October 2023
- September 2023
- August 2023
- July 2023
- June 2023
- May 2023
- April 2023
- March 2023
- February 2023
- January 2023
- December 2022
- November 2022
- October 2022
- September 2022
- August 2022
- July 2022
- June 2022
- May 2022
- April 2022
- March 2022
- February 2022
- January 2022
- December 2021
- November 2021
- October 2021
- September 2021
- August 2021
- July 2021
- June 2021
- May 2021
- April 2021
- March 2021
- February 2021
- January 2021
- December 2020
- November 2020
- October 2020
- September 2020
- August 2020
- July 2020
- June 2020
- May 2020
- April 2020
- March 2020
- February 2020
- January 2020
- December 2019
- November 2019
- October 2019
- September 2019
- August 2019
- July 2019
- June 2019
- May 2019
- April 2019
- March 2019
- February 2019
- January 2019
- December 2018
- November 2018
- October 2018
- September 2018
- August 2018
- July 2018
- June 2018
- May 2018
- April 2018
- March 2018
- February 2018
- January 2018
- December 2017
- November 2017
- October 2017
- September 2017
- August 2017
- July 2017
- June 2017
- May 2017
- April 2017
- March 2017
- February 2017
- January 2017
- December 2016
- November 2016
- October 2016
- September 2016
- August 2016
- July 2016
- June 2016
- May 2016
- April 2016
- March 2016
- February 2016
- January 2016
- December 2015
- November 2015
- October 2015
- September 2015
- August 2015
- July 2015
- June 2015
- May 2015
- April 2015
- March 2015
- February 2015
- January 2015
- December 2014
- November 2014
- October 2014
- September 2014
- August 2014
- July 2014
- June 2014
- May 2014
- April 2014
- March 2014
- February 2014
- January 2014
- December 2013
- November 2013
- October 2013
- September 2013
- August 2013
- July 2013
- June 2013
- May 2013
- April 2013
- March 2013
- February 2013
- January 2013
- December 2012
- November 2012
- October 2012
- September 2012
- August 2012
- July 2012
- June 2012
- May 2012
- April 2012
- March 2012
- February 2012
- January 2012
- December 2011
- November 2011
- October 2011
- September 2011
- August 2011
- July 2011
- June 2011
- May 2011
- April 2011
- March 2011
- February 2011
- January 2011
- December 2010
- November 2010
- October 2010
- September 2010
- August 2010
- July 2010
- June 2010
- May 2010
- April 2010
- March 2010
- February 2010
- January 2010
- December 2009
- November 2009
- October 2009
- September 2009
- August 2009
- July 2009
- June 2009
- May 2009
- April 2009
- March 2009
- February 2009
- January 2009
- December 2008
- November 2008
- October 2008
- September 2008
- August 2008
- July 2008
- June 2008
- May 2008
- April 2008
- March 2008
- February 2008
- January 2008
- December 2007
- November 2007
- October 2007
- September 2007
- August 2007
- July 2007
- June 2007
- May 2007
- April 2007
- March 2007
- February 2007
- January 2007
- December 2006
- November 2006
- October 2006
- September 2006
- August 2006
- July 2006
- June 2006
- May 2006
- April 2006
- March 2006
- February 2006
- January 2006
- December 2005
- November 2005
- October 2005
- September 2005
- August 2005
- July 2005
 Eddy Elfenbein is a Washington, DC-based speaker, portfolio manager and editor of the blog Crossing Wall Street. His