-
Dividends Rose 12% in 2013
Posted by Eddy Elfenbein on January 3rd, 2014 at 11:39 amThe fourth-quarter was another strong quarter for dividends. The S&P 500 paid out $9.52 per share in dividends (that’s an index-adjusted number). That’s an increase of 6.58% over last year’s fourth quarter. But remember that Q4 2012 saw a 22.77% surge in dividend payments to take advantage of the change in tax laws.
Dividends have now risen for 15 quarters in a row. We don’t have the final earnings numbers in yet, but dividends most likely paid out just under one third of corporate profits.
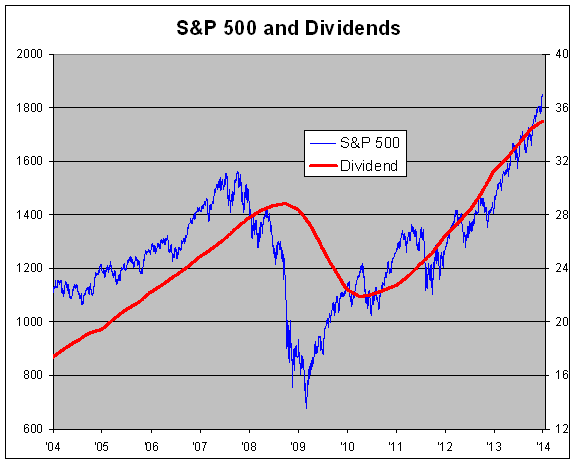
For the full year, dividends rose by 11.99%. While that’s below the 29.60% rally for the S&P 500, it’s not absurdly behind it either. In fact, dividends have actually outpaced the S&P 500 over the last three years. From the end of 2010 to the end of 2013, the S&P 500 rose 46.97% while dividends paid rose 53.95%.
Here’s a look at the S&P 500 (blue line, left scale) along with trailing four-quarter dividends (red line, right scale). The two lines are scaled at a ratio of 50-to-1. In other words, whenever the lines cross, the market’s dividend yield is exactly 2%. We also get a glimpse of how much everyone panicked in 2008 and 2009.
-
Ford’s December Sales Miss Expectations
Posted by Eddy Elfenbein on January 3rd, 2014 at 11:07 amFord Motor (F) wrapped up an excellent year for vehicle sales in 2013. Their sales for December, however, came in below expectations.
For the year, Ford sales rose by 11% to hit a six-year high. The company sold 2.5 million vehicles last year. The big winner was their F-Series pickups which rose 18%. Overall, their sales for December rose 2% to 218,058. December tends to be a big month for sales of luxury cars.
Ford is currently down one penny per share to $15.43.
-
Morning News: January 3, 2014
Posted by Eddy Elfenbein on January 3rd, 2014 at 6:49 amEuro Zone Private Loans Contraction Accelerates in November
Spanish Jobless Claims Fall Sharply in December
U.K. House Prices Cap Best Year Since 2006 as Mortgages Surge
India Leader Singh to Step Down After Vote as Gandhi Rises
From Ore to Nuggets, With Peril
For New Fed Chair Yellen, Headaches May Be Only Starting
Jobless Claims in U.S. Fall to Lowest Level in a Month
Labor Department Panel Calls for Ending Lockup for Jobs Data
Marchionne’s Fiat-Chrysler Coup the Beginning, Not The End
FireEye Buys Cyber Forensics Firm Mandiant for About $1 Billion
Macy’s, Martha Stewart Living Settle Dispute
Original Cheerios Are Now GMO-Free
Here’s The First Job Ad We’ve Seen For A Bitcoin Trader At A Hedge Fund
Jeff Carter: Do We Need to Save Silicon Valley?
Cullen Roche: The Biggest Risk in 2014: Recency Bias
Be sure to follow me on Twitter.
-
The S&P By Sectors in 2013
Posted by Eddy Elfenbein on January 2nd, 2014 at 11:23 amHere’s a look at how the different S&P 500 sectors performed last year. The big winner was Consumer Discretionary followed closely by Healthcare.
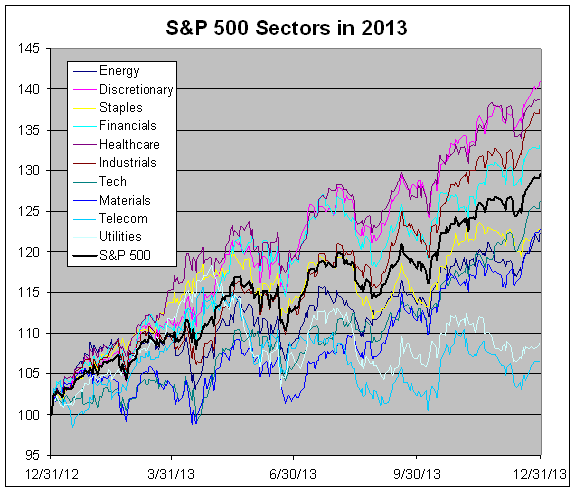
Industrials and Financials also did well. A little over a year ago, I tweeted, “I suspect an investor could buy the $XLF, then play video games for 12 months and easily beat most money managers in 2013.” That turned out to be right.
The lagging sectors were the safe havens — utilities and telecom. As I’ve said, this was the Fear Bubble deflating itself.
-
The Dow’s Average Year
Posted by Eddy Elfenbein on January 2nd, 2014 at 10:40 amWith the end of the year, I updated a few of my data files. One of these sets is the complete history of the Dow Jones going back to May 1896 (more than 32,000 trading days).
Here’s a good one. This is what the average year looks like for the Dow.
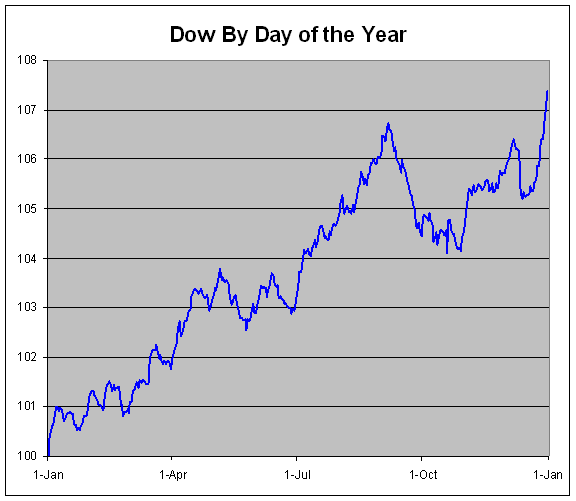
Interestingly, the second-best day of the year historically has been January 2nd. The best day is October 20th (thanks to following the big crash from October 19th). The Dow has gained an average of 0.37% on the 73 January 2nds the market has traded since 1897.
-
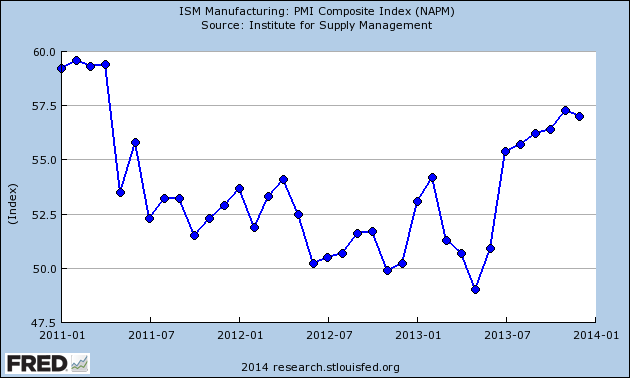
December ISM = 57.0
Posted by Eddy Elfenbein on January 2nd, 2014 at 10:20 amThe December ISM report just came out and it was 57.0 which is another good report. This was slightly below November’s report of 57.3, and it’s the sixth month in a row we’ve topped 55. This is good news for the economy.
The next big econ report will be next Friday’s jobs report. At the end of this month, we’ll get our first look at Q4 GDP which could be another quarter over 4%.
-
Morning News: January 2, 2014
Posted by Eddy Elfenbein on January 2nd, 2014 at 6:08 amEuro-Zone Manufacturing Grew Again in December
As Latvia Adopts Euro, Future Growth is Slowing
Euro Supporter Credit Suisse Joins Bears
Stung By Curbs, Indian Iron Ore Companies Throw in Towel
Singapore Home Prices Post First Decline in Seven Quarters
Bershidsky on Europe: Fiat to Swallow Chrysler
Samsung’s Lee Urges Shift Beyond Hardware in Apple Battle
Hyundai, Kia Face Fading Growth as Currency Tides Buoy Japan Rivals
Markets Buoyant, Merger Activity Picks Up
Human Behavior Trove Lures Economists to U.S. Tech Titans
Macau Casino Revenue Jumps 19 Percent to $45.2 Billion
Chinese Tycoon Wants to Buy the New York Times for $1 Billion or So
Lance Roberts: Correcting Some Misconceptions About A New Secular Bull Market
Howard Lindzon: The Year 2014….Here is How to Twerk and Surge Your Investing and Trading
Be sure to follow me on Twitter.
-
CWS Market Review – January 1, 2014
Posted by Eddy Elfenbein on January 1st, 2014 at 8:57 pmHappy New Year!
Last year was a great year for Wall Street and for our Buy List. I’m pleased to report that our Buy List beat the market for the seventh year in a row. Thanks to everyone for your support. Our strategy of focusing on high-quality stocks and low prices continues to pay off.
Here are the final numbers. For the year, our Buy List gained 36.42%. Including dividends, we were up 38.48%. That makes 2013 our second-best year ever.
The S&P 500 was no slouch. The index gained 29.80%, and including dividends, it was up 32.39%. The dividend yield of our Buy List was 1.51%. For the S&P 500, it was 2.15%. The Buy List’s “beta” was 1.0067.
Every stock on our Buy List made money last year. Our best performer was little Moog ($MOG-A), which soared 65.59%. Our worst stock was Oracle ($ORCL), which gained 14.83%
Over the eight-year history of our Buy List, our total compounded gain, including dividends, is 124.71%. For the S&P 500, the total return is 75.62%.
Details of Last Year’s Buy List
This chart below details the Buy List’s performance. I’ve listed each stock, along with the number of shares and the starting and ending prices. I assume the Buy List is a $1 million portfolio that is equally divided among the 20 stocks.
Stock Shares 12/31/2012 Beginning 12/31/2013 Ending Profit/Loss AFL 941.2651 $53.12 $50,000.00 $66.80 $62,876.51 25.75% BBBY 894.2944 $55.91 $50,000.00 $80.30 $71,811.84 43.62% CA 2,274.7953 $21.98 $50,000.00 $33.65 $76,546.86 53.09% CTSH 676.7731 $73.88 $50,000.00 $100.98 $68,340.55 36.68% BCR 511.5613 $97.74 $50,000.00 $133.94 $68,518.52 37.04% DTV 996.8102 $50.16 $50,000.00 $69.06 $68,839.71 37.68% FDS 567.7947 $88.06 $50,000.00 $108.58 $61,651.15 23.30% FISV 1,265.3422 $39.515 $50,000.00 $59.05 $74,718.46 49.44% F 3,861.0039 $12.95 $50,000.00 $15.43 $59,575.29 19.15% HRS 1,021.2418 $48.96 $50,000.00 $69.81 $71,292.89 42.59% JPM 1,137.1390 $43.97 $50,000.00 $58.48 $66,499.89 33.00% MDT 1,218.9176 $41.02 $50,000.00 $57.39 $69,953.68 39.91% MSFT 1,871.9581 $26.71 $50,000.00 $37.41 $70,029.95 40.06% MOG-A 1,218.6205 $41.03 $50,000.00 $67.94 $82,793.08 65.59% NICK 4,032.2581 $12.40 $50,000.00 $15.74 $63,467.74 26.94% ORCL 1,500.6002 $33.32 $50,000.00 $38.26 $57,412.96 14.83% ROST 924.3853 $54.09 $50,000.00 $74.93 $69,264.19 38.53% SYK 912.0759 $54.82 $50,000.00 $75.14 $68,533.38 37.07% WFC 1,462.8438 $34.18 $50,000.00 $45.40 $66,413.11 32.83% WEX 663.3939 $75.37 $50,000.00 $99.03 $65,695.90 31.39% Total $1,000,000.00 $1,364,235.66 36.42% Starting Prices and Shares for the 2014 Buy List
Here are the starting prices and number of shares for the 2014 Buy List. Whenever I discuss how well our Buy List is doing, this is what I’m referring to.
Company Ticker Price Shares Balance AFLAC AFL $66.80 748.5030 $50,000.00 Bed Bath & Beyond BBBY $80.30 622.6650 $50,000.00 CA Technologies CA $33.65 1485.8841 $50,000.00 Cognizant Technology Solutions CTSH $100.98 495.1476 $50,000.00 CR Bard BCR $133.94 373.3015 $50,000.00 DirecTV DTV $69.06 724.0081 $50,000.00 eBay EBAY $54.87 911.2448 $50,000.00 Express Scripts ESRX $70.24 711.8451 $50,000.00 Fiserv FISV $59.05 846.7401 $50,000.00 Ford Motor F $15.43 3240.4407 $50,000.00 IBM IBM $187.57 266.5671 $50,000.00 McDonald’s MCD $97.03 515.3045 $50,000.00 Medtronic MDT $57.39 871.2319 $50,000.00 Microsoft MSFT $37.41 1336.5410 $50,000.00 Moog MOG-A $67.94 735.9435 $50,000.00 Oracle ORCL $38.26 1306.8479 $50,000.00 Qualcomm QCOM $74.25 673.4007 $50,000.00 Ross Stores ROST $74.93 667.2895 $50,000.00 Stryker SYK $75.14 665.4245 $50,000.00 Wells Fargo WFC $45.40 1101.3216 $50,000.00 I’m excited for this year’s Buy List, but don’t expect another blow-out year like 2013. Our gains last year were driven by the Fear Bubble deflating. The gains will be harder to come by in 2014.
The Buy List has a stronger large-cap presence this year. That’s not a conscious strategy on my part. I simply found better names among the big boys. The average market cap is $80 billion. That ranges from a high of $312 billion for Microsoft ($MSFT) to $3 billion for Moog ($MOG-A). Thirteen of the twenty stocks pay dividends. The average yield is 1.35%.
Buy Below Prices for Our New Buys
Now let me give you the Buy Below prices for our five new buys. Remember, these aren’t price targets. They’re guidelines for new entry. I’m starting eBay ($EBAY) off as a buy up to $58. Express Scripts ($ESRX) is a buy up to $74 per share. I like IBM ($IBM) as long as it’s below $195. Don’t be afraid of the high nominal price. McDonald’s ($MCD) is a good buy up to $102 per share. Finally, Qualcomm ($QCOM) is a buy up to $79 per share.
There hasn’t been much news lately, but I promise you that will change soon. The ISM report for December comes out tomorrow. The last few reports have been quite good, and I hope to see that trend continue. On Friday, we’ll get a look at car and truck sales. Despite the recent pullback, Ford ($F) had a great year for sales.
This Wednesday, January 8, Bed Bath & Beyond ($BBBY) is due to report its fiscal Q3 earnings (Sep-Oct-Nov). The company has said it expects earnings to range between $1.11 and $1.16 per share. My take: I think they’ll be towards the high end of that range. I’ll be curious if they provide an update to their Q4 guidance. That’s the holiday quarter, and it’s the most important, by far, for BBBY’s business. They’ve already given us a range of $1.70 to $1.77 per share for Q4 (that’s more than one third of their full-year earnings coming in one quarter). Other retailers, like Ross Stores ($ROST), have been more modest with their forecasts, so it will be interesting to hear what BBBY has to say. Bed Bath & Beyond continues to be a good buy up to $83 per share.
Next Friday will be the big jobs report for December. The unemployment rate could dip below 7% for the first time in more than five years. I’m sure the folks inside the Fed will be watching this report closely. Speaking of which, on Wednesday, we’ll get a look at the minutes from the Fed’s December meeting. This is the meeting in which they decided to taper their bond purchases. Traders will be carefully scrutinizing the minutes for any possible indicators of what the Fed may have up its sleeve in 2014. I expect to see more tapering, but I don’t believe the Fed will raise short-term rates for a while.
I also wanted to raise a few of our Buy Prices this week. The stock market has done very well, and I want to make certain our Buy Below prices reflect that. Oracle ($ORCL), for example, has been doing very well lately (despite being the laggard in 2013). I’m raising our Buy Below on ORCL to $41 per share.
Wells Fargo ($WFC) will be one of our first stocks to report for the Q1 earnings season. The bank has topped estimates for the last eight quarters in a row. Wells is due to report on Tuesday, January 14. Wall Street expects earnings of 98 cents per share. I think WFC can beat that. I’m raising our Buy Below on Wells to $48 per share.
I’m also raising Stryker’s ($SYK) Buy Below to $79 per share. CA Technologies ($CA) has done well lately, so I’m going to raise its Buy Below to $35 per share. Lastly, I’m raising Cognizant’s ($CTSH) Buy Below to $104 per share. (It seems like I’m raising that one every week!) CTSH soared 57% in the second half of last year.
That’s all for now. Be sure to keep checking the blog for daily updates. I’ll have more market analysis for you in the next issue of CWS Market Review!
– Eddy
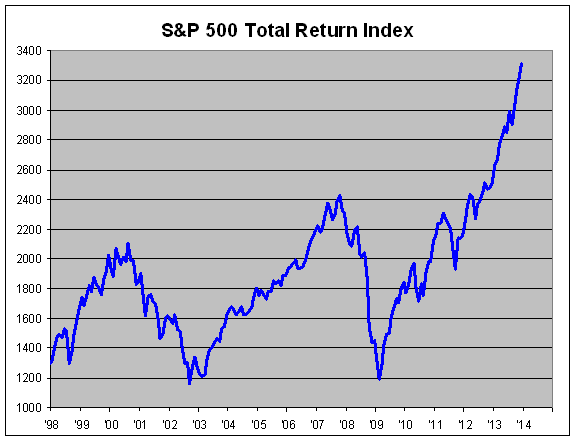
S&P 500 Total Return Index
Posted by Eddy Elfenbein on January 1st, 2014 at 10:29 amThe S&P 500 including dividends was up 32.39% last year. Over the last 27 months, the S&P 500 has returned 71.72%.
The 2014 Buy List
Posted by Eddy Elfenbein on December 31st, 2013 at 8:05 pmHere are the 20 stocks for the 2014 Buy List. It’s locked and sealed and I can’t make any changes for 12 months.
For tracking purposes, I assume the Buy List is a $1 million portfolio that’s equally divided among 20 stocks. Below are all 20 positions with the amount of shares for each and the closing price for 2013. Whenever I discuss how the Buy List is doing, the list below is what I’m referring to.
 Eddy Elfenbein is a Washington, DC-based speaker, portfolio manager and editor of the blog Crossing Wall Street. His