-
Stepan Company: 46 Straight Annual Dividend Increases
Posted by Eddy Elfenbein on December 3rd, 2013 at 11:21 amEver hear of Stepan Company ($SCL)? Don’t worry, you’re not alone.
It’s actually a good-sized outfit; $1.4 billion in market cap and a member of the S&P 600.
Here’s a description from Hoover’s:
Company secrets aside, makers of laundry detergents, shampoos, toothpaste, and other personal care products can come clean with Stepan Company. Surfactants, the company’s largest sector by far, are chemicals most commonly used as cleaning agents used in consumer products like detergents, toothpastes, and cosmetics. Stepan’s surfactants are also used in commercial and industrial applications ranging from emulsifiers for agricultural insecticides to agents used in oil recovery. The company also makes phthalic anhydride (an acid used in making polyester resins) and other polymers, as well as specialty chemicals for food and pharmaceutical uses.
Sexy, no? Phthalic anhydride!
The stock is almost completely ignored by Wall Street. Just two analysts follow it. Outside of its quarterly earnings report, Stepan generates almost no news.
Each day, about one-quarter of one percent of Stepan’s shares are traded. Facebook’s volume is about 5% of its float.
My point is that Stepan is about as dull as dirt, and that’s why I’m a fan (though I’m not saying I’m recommending the stock).
But what I really like about Stepan happened two months ago when the company raised its quarterly dividend from 16 to 17 cents per share. This marks the 46th year in a row that Stepan has increased its quarterly dividend. On the company’s website, they list all the dividend increases going back to 1967. In the last 40 years, the dividend has grown by more than 40 fold.
I love these boring companies that everyone else overlooks.
-
Dividends Continue to Grow
Posted by Eddy Elfenbein on December 3rd, 2013 at 10:43 amWe still have a few weeks left this year, but Howard Silverblatt at S&P tells me that dividends for the S&P 500 are on pace to grow by another 3% this quarter.
That may sound low but keep in mind that it’s on top of the huge tax-related payouts from last year’s Q4. The truth is that dividend growth has been and continues to be quite strong. Since 2010, dividends are up 53%.
The S&P 500 looks to pay out $34.72 in dividends this year. That’s up 11% from last year. It also works out to a yield of 2.43% based on the S&P 500’s level at the start of the year.
Here’s a look at the S&P 500 (blue line, left scale) and its dividends (red line, right scale). I’ve scaled the lines at a ratio of 50-to-1, so whenever the lines cross, the dividend yield is exactly 2%.
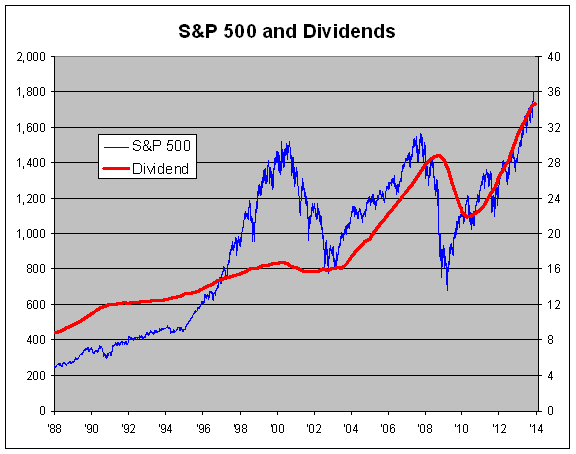
So while it’s true that the stock market has rallied, it’s largely kept pace with dividends. In fact, the dividend yield has been close to 2% for more than a decade (except for during the worst period of the bear market).
But the chart shows the dramatic difference between today’s market and the stock bubble from 14 years ago. Back then, stocks were far, far ahead of dividends.
-
Morning News: December 3, 2013
Posted by Eddy Elfenbein on December 3rd, 2013 at 6:56 amBritain’s Christmas Spending Binge Leaves U.S. Trailing
Global Shares Jittery Over U.S. Stimulus, BOJ Talk Crops Yen
Japan Preparing $53 Billion Economic Stimulus Package This Week
Yuan Passes Euro as Second-Most Used Trade-Finance Currency
Obamacare’s New Goal: Stay Alive Until 2015
US Federal Reserve Approves JPMorgan, Goldman Sachs Capital Plans
Supreme Court Refuses Challenge By Online Retailers To N.Y. Tax Law
Cyber Monday Clicking With More Shoppers
Why Drone Delivery Will Be A Nightmare for Law Enforcement
Google Joins a Heavyweight Competition in Cloud Computing
Apple Buys Startup Topsy; Gets Rich Twitter Data
Rio Tinto Curbs Spending in Bid to Reduce Debt
Consumer Watchdog to Monitor Student Loan Servicers
Roger Nusbaum: Cliff Asness’ Ten Peeves
John Hempton: The Great Salad Oil Swindle
Be sure to follow me on Twitter.
-
Dow Nears All-Time Inflation-Adjusted High
Posted by Eddy Elfenbein on December 2nd, 2013 at 4:01 pmAfter nearly 14 years, the Dow Jones Industrial Average is nearing an all-time high adjusted for inflation. The thing is, it’s hard to know exactly when and where the magic mark is. The catch is that we don’t get the inflation data until about two weeks into the new month.
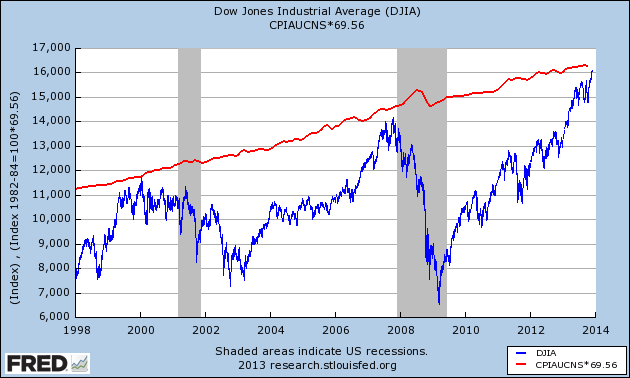
My best estimate says that the inflation-adjusted high works out to about 16,280 right now.
-
Gold Is Down to $1,218 Per Ounce
Posted by Eddy Elfenbein on December 2nd, 2013 at 3:16 pmNow that the books have closed on November, we can see that it was the third-straight monthly gain for the S&P 500. The streak may continue. Historically, December has been the second-best month for stocks. The S&P 500 ended last week with its eighth-straight weekly gain. That’s the longest such streak in nearly ten years. This year also looks to be the best year for stocks since 1998. After five years, the stock market has gained an astounding $14 trillion in value.
According to a recent survey from Bloomberg, revenue growth is expected to increase to 4.1% next year which is double this year’s growth rate. Profits are expected to rise by 10%, which means that margins are expected to continue to expand.
But the interesting move today is in gold, which is now at its lowest level since July. Gold is down to $1,218 per ounce. The metal will almost certainly have its first losing year since 2000.
The price of oil has also been under pressure. According to the latest numbers, the U.S. is meeting 86% of its energy needs which is the most in over a quarter of a century. If this keeps up, we’ll soon be the largest oil producer in the world.
-
Cognizant to Hire 10,000 U.S. Workers
Posted by Eddy Elfenbein on December 2nd, 2013 at 1:29 pmBig news from Cognizant Technology Solutions ($CTSH):
Cognizant Technology Solutions Corp., one of the largest providers of outsourcing services, plans to hire about 10,000 U.S. workers, potentially soothing concerns that the industry is harming the domestic job market.
The move, which President Gordon Coburn is scheduled to announce at a speech in Texas today, will increase the company’s 29,000-employee domestic workforce by about a third over the next three years. The new positions will be full-time jobs in science, technology, engineering and math — or STEM — fields.
A legislative battle over immigration reform has put a spotlight on outsourcing providers and their effect on U.S. technology jobs. Companies such as Cognizant and Infosys Ltd. (INFO) often rely on work visas to bring in consultants from overseas, rather than hiring local workers to do the job. In October, Infosys agreed to pay a record fine to the federal government after a probe into its use of visas.
For Cognizant, an improved U.S. economy is making it more feasible to hire full-time workers in the country, Coburn said in an interview. The company has raised its forecast for profit and sales twice this year.
“The stabilization of the economy in the U.S. has given our clients more comfort in innovation and investing in growing their own top line,” Coburn said. “There is clearly long-term demand for skilled technology professionals here in the U.S. We are working hard to identify the talent to meet our clients’ needs.”
-
The S&P 500 Vs. the CPI
Posted by Eddy Elfenbein on December 2nd, 2013 at 12:34 pmHere’s a look at the S&P 500 versus the CPI. I’ve scaled the graph so the lines meet at the market’s peak in 2000.
You can see that even after this historic rally, prices still haven’t kept pace with inflation. Sorry bears, ain’t no bubble. Now 2000, that was a bubble.
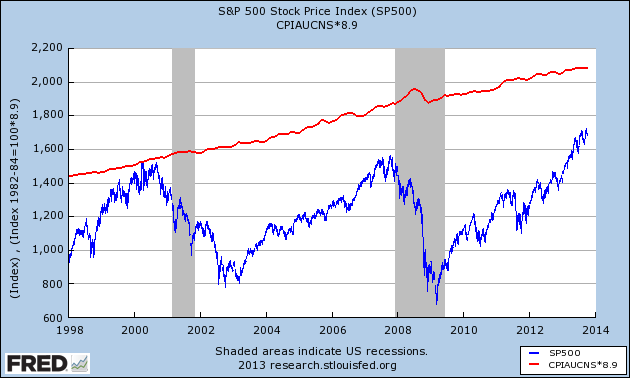
The S&P 500 needs to get near 2,100 to reach a new inflation-adjusted high.
-
“Buffett’s returns appear to be neither luck nor magic”
Posted by Eddy Elfenbein on December 2nd, 2013 at 12:07 pmVia Counterparties comes this academic paper:
Buffett’s Alpha
Andrea Frazzini, David Kabiller, Lasse H. PedersenNBER Working Paper No. 19681
Issued in November 2013
NBER Program(s): APBerkshire Hathaway has realized a Sharpe ratio of 0.76, higher than any other stock or mutual fund with a history of more than 30 years, and Berkshire has a significant alpha to traditional risk factors. However, we find that the alpha becomes insignificant when controlling for exposures to Betting-Against-Beta and Quality-Minus-Junk factors. Further, we estimate that Buffett’s leverage is about 1.6-to-1 on average. Buffett’s returns appear to be neither luck nor magic, but, rather, reward for the use of leverage combined with a focus on cheap, safe, quality stocks. Decomposing Berkshires’ portfolio into ownership in publicly traded stocks versus wholly-owned private companies, we find that the former performs the best, suggesting that Buffett’s returns are more due to stock selection than to his effect on management. These results have broad implications for market efficiency and the implementability of academic factors.
In other words, exactly what Buffett says he been doing for 50 years, works.
-
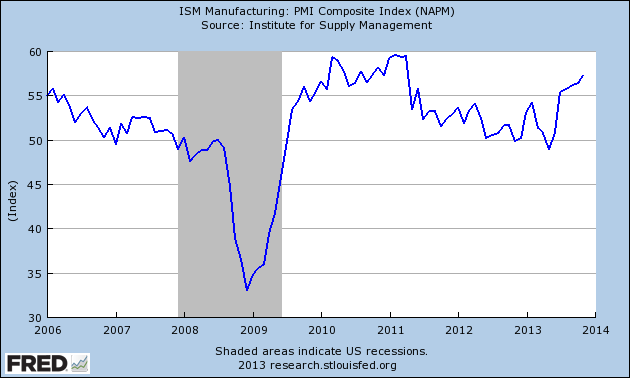
November ISM = 57.3
Posted by Eddy Elfenbein on December 2nd, 2013 at 10:12 amToday’s ISM came in at 57.3. That’s the highest number since April 2011. Any reading above 50 means the manufacturing sector is expanding. Below 50 indicates a contraction.
This was the best ISM report since April 2011. The ISM has topped 50 for 50 of the last 52 months.
-
We’re Back!
Posted by Eddy Elfenbein on December 2nd, 2013 at 9:35 amWe’re back! I hope everyone had an enjoyable long weekend. This will be a busy week for economic news. The ISM report comes out later today. On Thursday, the government will update the third-quarter GDP report. Then on Friday, the November jobs report comes out. Last week’s initial claims report was the fifth-lowest in the last six years.
Trading was very slow last week, but the stock market managed to climb higher. At one point on Friday, the S&P 500 got to 1,813.55 which is an all-time high. However, the market dropped shortly before the early close. Last Monday, the Nasdaq Composite closed above 4,000 for the first time in 13 years.
I’ve often noted that the current rally is the most-hated rally in Wall Street’s history. Perhaps a little overstatement. Still, I suspect that a major reason isn’t that the bears haven’t seen drops, but it’s that they have. Consider that during the current rally which began in March 2009, we’ve seen separate drops of 5.6%, 5.8%, 6.4%, 7.1%, 7.7%, 8.1%, 9.9%, 16.0% and 19.4%. Every single one led to a new high. All of them.
What’s also interesting is the breadth of this market. The top 10 point contributors in the S&P 500 have accounted for 18% of this year’s gain. In 1999, that number was 65%. The tech bubble was created by a very small number of stocks. That’s not what’s happening now. Since World War II, the S&P 500 has gained 20% or more 18 times. The following year’s gain has averaged 10%.
-
Archives
- June 2026
- May 2026
- April 2026
- March 2026
- February 2026
- January 2026
- December 2025
- November 2025
- October 2025
- September 2025
- August 2025
- July 2025
- June 2025
- May 2025
- April 2025
- March 2025
- February 2025
- January 2025
- December 2024
- November 2024
- October 2024
- September 2024
- August 2024
- July 2024
- June 2024
- May 2024
- April 2024
- March 2024
- February 2024
- January 2024
- December 2023
- November 2023
- October 2023
- September 2023
- August 2023
- July 2023
- June 2023
- May 2023
- April 2023
- March 2023
- February 2023
- January 2023
- December 2022
- November 2022
- October 2022
- September 2022
- August 2022
- July 2022
- June 2022
- May 2022
- April 2022
- March 2022
- February 2022
- January 2022
- December 2021
- November 2021
- October 2021
- September 2021
- August 2021
- July 2021
- June 2021
- May 2021
- April 2021
- March 2021
- February 2021
- January 2021
- December 2020
- November 2020
- October 2020
- September 2020
- August 2020
- July 2020
- June 2020
- May 2020
- April 2020
- March 2020
- February 2020
- January 2020
- December 2019
- November 2019
- October 2019
- September 2019
- August 2019
- July 2019
- June 2019
- May 2019
- April 2019
- March 2019
- February 2019
- January 2019
- December 2018
- November 2018
- October 2018
- September 2018
- August 2018
- July 2018
- June 2018
- May 2018
- April 2018
- March 2018
- February 2018
- January 2018
- December 2017
- November 2017
- October 2017
- September 2017
- August 2017
- July 2017
- June 2017
- May 2017
- April 2017
- March 2017
- February 2017
- January 2017
- December 2016
- November 2016
- October 2016
- September 2016
- August 2016
- July 2016
- June 2016
- May 2016
- April 2016
- March 2016
- February 2016
- January 2016
- December 2015
- November 2015
- October 2015
- September 2015
- August 2015
- July 2015
- June 2015
- May 2015
- April 2015
- March 2015
- February 2015
- January 2015
- December 2014
- November 2014
- October 2014
- September 2014
- August 2014
- July 2014
- June 2014
- May 2014
- April 2014
- March 2014
- February 2014
- January 2014
- December 2013
- November 2013
- October 2013
- September 2013
- August 2013
- July 2013
- June 2013
- May 2013
- April 2013
- March 2013
- February 2013
- January 2013
- December 2012
- November 2012
- October 2012
- September 2012
- August 2012
- July 2012
- June 2012
- May 2012
- April 2012
- March 2012
- February 2012
- January 2012
- December 2011
- November 2011
- October 2011
- September 2011
- August 2011
- July 2011
- June 2011
- May 2011
- April 2011
- March 2011
- February 2011
- January 2011
- December 2010
- November 2010
- October 2010
- September 2010
- August 2010
- July 2010
- June 2010
- May 2010
- April 2010
- March 2010
- February 2010
- January 2010
- December 2009
- November 2009
- October 2009
- September 2009
- August 2009
- July 2009
- June 2009
- May 2009
- April 2009
- March 2009
- February 2009
- January 2009
- December 2008
- November 2008
- October 2008
- September 2008
- August 2008
- July 2008
- June 2008
- May 2008
- April 2008
- March 2008
- February 2008
- January 2008
- December 2007
- November 2007
- October 2007
- September 2007
- August 2007
- July 2007
- June 2007
- May 2007
- April 2007
- March 2007
- February 2007
- January 2007
- December 2006
- November 2006
- October 2006
- September 2006
- August 2006
- July 2006
- June 2006
- May 2006
- April 2006
- March 2006
- February 2006
- January 2006
- December 2005
- November 2005
- October 2005
- September 2005
- August 2005
- July 2005
 Eddy Elfenbein is a Washington, DC-based speaker, portfolio manager and editor of the blog Crossing Wall Street. His