-
CWS Market Review – September 27, 2013
Posted by Eddy Elfenbein on September 27th, 2013 at 7:09 am“Our job is to find a few intelligent things to do, not to keep
up with every damn thing in the world.” – Charlie MungerAfter rallying eleven out of the first twelve days of September, the S&P 500 then had a five-day losing streak which was finally snapped thanks to a small rally on Thursday. Despite the recent downturn, the index is still within shouting distance of its all-time high (1,729.86 on September 19th, to be precise). Importantly, we’re still above the 50-day moving average.
So what was the cause of the market’s brief downturn? That’s hard to say. In fact, it’s probably impossible to say what impacts the market in the near-term. Some say it’s worries over another Debt Ceiling showdown. (Groan.) Or it could be worries ahead of earnings season. No matter. That’s not our concern around here (see Charlie’s statement above). Our strategy is to be focused on good stocks for the long term, and it’s been working very well for us this year.
Speaking of which, our favorite home furnishings stock, Bed Bath & Beyond ($BBBY), jumped more than 4.4% on Thursday after another solid earnings report. The shares broke out to a new all-time high. I’ll review the earnings report in just a bit. I also want to discuss the latest botherations at JPMorgan Chase ($JPM). The bank is currently in talks with regulators to write a monster check to make their problems go away. But first, let’s look at the good news from Bed Bath Beyond.
Bed Bath & Nearly Beyond $80 Per Share
On Wednesday, Bed Bath & Beyond ($BBBY) reported fiscal second-quarter earnings of $1.16 per share. That’s an increase of 18.4% over last year. Sales rose 8.9% to $2.824 billion. This was a very good quarter for BBBY. Three months ago, they had given us a range of $1.11 to $1.16 per share, so they hit the top of their own range.
I was especially impressed by the comparable store sales number which was up 3.7%. That topped last year’s figure of 3.5%. If you’re new to investing, this metric is the gold standard for retailers.
For Q3, which ends in November, BBBY sees earnings ranging between $1.11 and $1.16 per share which is the exact same range they had for Q2. For Q4, which is the biggie for BBBY, they see earnings coming in between $1.70 and $1.77 per share. That covers the key months of December, January and February. For a retailer like Bed Bath & Beyond, that’s the biggest quarter of the year by far.
Bed Bath & Beyond also reiterated their full-year forecast of $4.88 to $5.01 per share. By my numbers, that’s a very conservative outlook and I don’t think they’ll have much trouble beating it. The low-end number in particular is way too low. For comparison, the company earned $4.56 per share last year. I think they should be able to clear $5 per share by year’s end. Even $5.10 is possible.
I really like how well-run BBBY is. They have a solid balance sheet and nearly $1 billion in cash. They’re also one of the few companies that use share buybacks to actually reduce their share count. Consider this: In the last three years, net income is up 37% but EPS is up 66%. Why? There are fewer shares. That’s how real buybacks work. Not phony ones that mask executive compensation.
Let me also say that BBBY is a perfect example of our style of investing. You may recall that the stock got hammered a few times last year. BBBY crashed 17% in one day last June, and it dropped another 10% after the earnings report from last September. That earnings report missed Wall Street’s consensus by four cents per share. OMG! Panic!
Yet here we are a year later, and the stock and earnings are at all-time highs. This didn’t involve a Great Swami-like prediction on our part. It involved recognizing the simple fact that BBBY is a great company, and the stock will eventually reflect that. The stock is now a 38.7% winner on the year for us. Aren’t you glad we stuck with them? I’m raising my Buy Below on Bed Bath & Beyond to $83 per share.
JPMorgan Is In Talks to Settle Mortgage Abuses
I’m getting tired of discussing the latest mishaps at JPMorgan Chase ($JPM). For the record, I think it’s a very profitable bank and the stock is a good value. However, the seemingly endless parade of bad news is frustrating.
JPM has already paid huge fines this year. Over the last three years, their litigation costs have totaled a staggering $17 billion. Maybe their lawyers should IPO. Now the bank is in talks with federal and state regulators to secure a massive deal that would resolve all the outstanding mortgage issues they face. Specifically, the allegations deal with how JPM sold mortgage bonds before the crisis.
CEO Jamie Dimon recently met with Attorney General Eric Holder. According to news sources, JPM initially offered to pay $3 billion. The government was, shall we say, unimpressed. The current number we’re hearing is $11 billion. That’s $7 billion in cash plus $4 billion in relief for homeowners. That works out to about $3 per share. Understandably, JPM wants to get all this bad news behind them. Interestingly, the stock rebounded on Wednesday and Thursday on speculation of a possible deal. That’s good to see.
JPM had done well for us this year until hitting some rough ground this summer. It’s important to remember just how massive JPM is. They have more than 250,000 employees and close to $2 trillion in assets. I have to give JPM credit. The last few earnings reports have been outstanding. The next report is due in two weeks. Wall Street’s consensus is for $1.32 per share. I’m keeping JPM as a conservative buy up to $56 per share. I’d be a lot happier if Jamie Dimon is shown the door.
Crossing Wall Street Buy List Updates
It’s mostly been a quiet week for our stocks, but I wanted to touch on a few items. Perhaps the most impressive is that Larry Ellison led Oracle Team USA to a stunning America’s Cup victory. Sure, I doubt it will help Oracle’s ($ORCL) stock, but it’s cool to see. As far as the stock goes, I was relieved by last week’s good earnings, and the shares of ORCL have started to recover. Oracle remains a very good buy up to $35 per share.
Little Nicholas Financial ($NICK) popped as high as $16.79 this week. There was no news, but it’s nice to see NICK get some love. NICK is an excellent buy up to $17 per share. Don’t forget the dividend yield which is currently a hair below 3%.
If I had to guess which Buy List stock would be the top performer this year, I doubt I would have said Moog ($MOG-A), but indeed it is. It’s always the quiet ones! Moog is up 42.3% this year, and this week it nearly poked through the $60 barrier. My take: Don’t chase Moog. I’m keeping our Buy Below at $57 for now. Look for more good earnings news in a few weeks.
Cognizant Technology ($CTSH) continues to do very well for us. Barclay’s just upgraded CTSH and raised their price target from $80 to $97 per share. Remember in April when it plunged 21% in two weeks? Nope, me neither. I’m keeping our Buy Below at $84 per share. CTSH is a solid buy.
On Wednesday, Stryker ($SYK) announced that it’s buying MAKO Surgical ($MAKO) for $1.65 billion. MAKO is involved in robotic-assisted surgery which is a very hot sector. Stryker obviously sees big opportunities here—they’re paying an 86% premium for MAKO.
Shares of SYK took a dip which usually happens to the acquirer, but I’m not worried. Wells Fargo just reaffirmed their Outperform rating, and both RBC Capital and Deutsche Bank recently raised their price targets for SYK. Stryker remains a very good buy up to $71 per share.
That’s all for now. This Monday will be the final day of the third quarter. After that, we’ll get the important turn-of-month economic reports. The ISM Index will be out on Tuesday. The last two reports were quite good. Then on Wednesday, ADP releases its jobs report. Initial claims will be out on Thursday. Finally, on Friday morning, the big September jobs report will be released. Be sure to keep checking the blog for daily updates. I’ll have more market analysis for you in the next issue of CWS Market Review!
– Eddy
-
Morning News: September 27, 2013
Posted by Eddy Elfenbein on September 27th, 2013 at 6:43 amEU Chief Says Political Risks Still Threaten Recovery
British Postal Service Valued at $5.3 Billion in I.P.O.
Pound Rises on Report Carney Sees No Need for Extra Stimulus
Top Shareholders Back Alibaba’s Controversial Corporate Structure
Consumer Prices Spike in Japan
BOJ’s Takeaway From Fed Bungle: Keep The Message Simple
JPMorgan Urged to Pay More in Mortgage Deal
McDonald’s to Offer Alternatives to Fries, Soda
Nike Surges As Q1 Profit Beats On Strong North America Sales
Candy Crush Saga: Making Money From Free Games
EBay’s $800 Million Braintree Deal Expands Mobile Payments
KKR to Buy Panasonic Health Care Business for $1.67 Billion
J.C. Penney Offers 84 Million Shares to Fund Turnaround
Cullen Roche: Is Capex Finally Picking Up?
Epicurean Dealmaker: Mirror, Mirror
Be sure to follow me on Twitter.
-
Oracle CEO Mark Hurd at Oracle World
Posted by Eddy Elfenbein on September 26th, 2013 at 2:01 pm -
BBBY Soars to All-Time High
Posted by Eddy Elfenbein on September 26th, 2013 at 11:09 amBed Bath & Beyond ($BBBY) is having an outstanding day today. The shares gapped as high as $78.88 this morning. The stock has moved into second place on our Best Performers list this year.
-
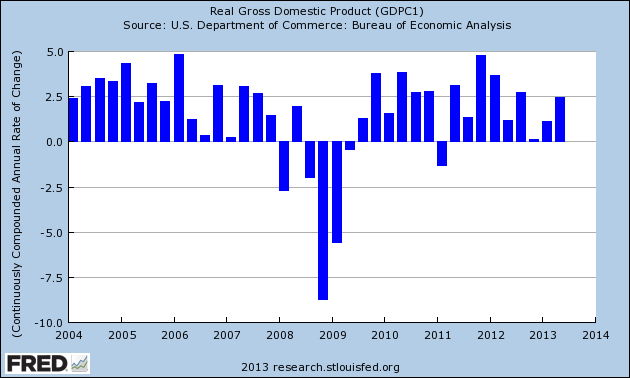
Q2 GDP Unchanged at 2.5%
Posted by Eddy Elfenbein on September 26th, 2013 at 10:20 amThe government reported today that Q2 GDP grew by 2.5% which was unchanged from its report in August. This is tepid growth. One positive aspect is that growth has accelerated the last two quarters. This is a trend I’d like to see continue.
-
Kristen Bell LOVES Bed Bath & Beyond
Posted by Eddy Elfenbein on September 26th, 2013 at 10:01 am -
Morning News: September 26, 2013
Posted by Eddy Elfenbein on September 26th, 2013 at 6:59 amJapan defends PM Shinzo Abe’s ‘Gordon Gekko speech’ on Wall Street
Tokyo Stocks Jump on Talk of Corporate Tax Cut
Pursuing Graft at Higer Levels, Chinese Leader Risks Unsettling Elites
Pimco Sees Buffett’s India Dream Cut to Junk as Vote Looms
Lew Pressures Congress on Debt Limit With Deadline
JPMorgan in Talks to Settle Government Cases for $11 Billion, Source Says
Lixil to Buy Grohe in $4 Billion Landmark Deal
Wal-Mart Cutting Orders as Unsold Merchandise Piles Up
Alibaba U.S. Listing Would Be New Battle for Exchanges
Fund to Let Investors Bet on Price of Bitcoins
New Era as Brussels Tightens its Grip on Budget Miscreants
Barclays To Shut Wealth Management Services In 130 Countries
Richard Koo: Forget Hyperinflation — The Fed Is Now Facing The True Cost Of Quantitative Easing
Joshua Brown: Cliff Asness: Pure Alpha is Still Worth It
Credit Writedowns: BOJ’s Aggressive QE Has Brought JGBs to Negative Real Yields
Be sure to follow me on Twitter.
-
Yes, But Does Google Have an America’s Cup?
Posted by Eddy Elfenbein on September 25th, 2013 at 6:51 pm
Congratulations to Larry Ellison and Oracle Team USA on winning the America’s Cup:
Capping the greatest comeback in America’s Cup history, Oracle Team USA trailed at the start of the race but sailed away from Emirates Team New Zealand on Wednesday to retain the Cup in a winner-take-all decider.
After falling behind 8-1, the American team under never-say-die skipper Jimmy Spithill captured eight consecutive races to win 9-8 in the first-to-nine-wins series. Oracle won 11 races but was hit with a two-race penalty for cheating in a warm-up race with smaller boats.
The deciding race didn’t start well for Oracle. The Kiwis took advantage of their port position at the start and maintained an early seven-second lead at Mark 1 as Oracle plunged its two bows into the water while making the turn. But after three lead changes in the third upwind leg – once the Americans’ weakness – Oracle sailed away with a 44-second victory.
On Monday, shares of ORCL hit a three-month high. As always, correlation doesn’t imply causation.
-
Bed Bath & Beyond Earns $1.16 Per Share
Posted by Eddy Elfenbein on September 25th, 2013 at 4:20 pmBed Bath & Beyond‘s ($BBBY) earnings report is out. The company earned $1.16 per share for fiscal Q2 which was at the top of their range.
I like how BBBY really buys back shares in an effort to reduce share count. Consider this: BBBY’s net income is up 37% from Q2 three years ago, but EPS is up 66%. That’s how real buybacks work. Not phony ones that mask executive compensation.
For Q3, they see earnings ranging between $1.11 to $1.16 per share (which is exactly what they said for Q2).
For the year, BBBY sees earnings coming in between $4.88 to $5.01 per share.
Bed Bath & Beyond Inc. today reported net earnings of $1.16 per diluted share ($249.3 million) in the fiscal second quarter ended August 31, 2013, an increase of approximately 18.4% versus net earnings of $0.98 per diluted share ($224.3 million) in the same quarter a year ago. Net sales for the fiscal second quarter of 2013 were approximately $2.824 billion, an increase of approximately 8.9% from net sales of approximately $2.593 billion reported in the fiscal second quarter of 2012. Comparable store sales in the fiscal second quarter of 2013 increased by approximately 3.7%, compared with an increase of approximately 3.5% in last year’s fiscal second quarter.
During the fiscal second quarter of 2013, the Company repurchased approximately $257 million of its common stock, representing approximately 3.5 million shares. As of August 31, 2013, the remaining balance of the existing share repurchase program authorized in December 2012 was approximately $1.8 billion.
For the fiscal first half ended August 31, 2013, the Company reported net earnings of $2.09 per diluted share ($451.8 million), an increase of approximately 11.8% over net earnings of $1.87 per diluted share ($431.2 million) in the corresponding period a year ago. Net sales for the fiscal first half of 2013 were approximately $5.436 billion, an increase of approximately 13.0% from net sales of approximately $4.811 billion in the corresponding period a year ago. Comparable store sales for the fiscal first half of 2013 increased by approximately 3.5%, compared with an increase of approximately 3.3% in last year’s fiscal first half.
The Company is modeling net earnings per diluted share in 2013 to be approximately $1.11 to $1.16 for the fiscal third quarter, $1.70 to $1.77 for the fiscal fourth quarter, and to be approximately $4.88 to $5.01 for the full year, which will include Cost Plus, Inc. (“World Market”) and Linen Holdings for all of fiscal 2013.
Here are the sales and earnings figures for the past few quarters:
Quarter Sales Gross Profit Operating Profit Net Profit EPS May-99 $356,633 $146,214 $28,015 $17,883 $0.06 Aug-99 $451,715 $185,570 $53,580 $33,247 $0.12 Nov-00 $480,145 $196,784 $50,607 $31,707 $0.11 Feb-00 $569,012 $238,233 $77,138 $48,392 $0.17 May-00 $459,163 $187,293 $36,339 $23,364 $0.08 Aug-00 $589,381 $241,284 $70,009 $43,578 $0.15 Nov-01 $602,004 $246,080 $64,592 $40,665 $0.14 Feb-01 $746,107 $311,802 $101,898 $64,315 $0.22 May-01 $575,833 $234,959 $45,602 $30,007 $0.10 Aug-01 $713,636 $291,342 $84,672 $53,954 $0.18 Nov-02 $759,438 $311,030 $83,749 $52,964 $0.18 Feb-02 $879,055 $370,235 $132,077 $82,674 $0.28 May-02 $776,798 $318,362 $72,701 $46,299 $0.15 Aug-02 $903,044 $370,335 $119,687 $75,459 $0.25 Nov-03 $936,030 $386,224 $119,228 $75,112 $0.25 Feb-03 $1,049,292 $443,626 $168,441 $105,309 $0.35 May-03 $893,868 $367,180 $90,450 $57,508 $0.19 Aug-03 $1,111,445 $459,145 $155,867 $97,208 $0.32 Nov-04 $1,174,740 $486,987 $161,459 $100,506 $0.33 Feb-04 $1,297,928 $563,352 $231,567 $144,248 $0.47 May-04 $1,100,917 $456,774 $128,707 $82,049 $0.27 Aug-04 $1,273,960 $530,829 $189,108 $120,008 $0.39 Nov-05 $1,305,155 $548,152 $190,978 $121,927 $0.40 Feb-05 $1,467,646 $650,546 $283,621 $180,980 $0.59 May-05 $1,244,421 $520,781 $150,884 $98,903 $0.33 Aug-05 $1,431,182 $601,784 $217,877 $141,402 $0.47 Nov-06 $1,448,680 $615,363 $205,493 $134,620 $0.45 Feb-06 $1,685,279 $747,820 $304,917 $197,922 $0.67 May-06 $1,395,963 $590,098 $148,750 $100,431 $0.35 Aug-06 $1,607,239 $678,249 $219,622 $145,535 $0.51 Nov-07 $1,619,240 $704,073 $211,134 $142,436 $0.50 Feb-07 $1,994,987 $862,982 $309,895 $205,842 $0.72 May-07 $1,553,293 $646,109 $154,391 $104,647 $0.38 Aug-07 $1,767,716 $732,158 $211,037 $147,008 $0.55 Nov-08 $1,794,747 $747,866 $203,152 $138,232 $0.52 Feb-08 $1,933,186 $799,098 $259,442 $172,921 $0.66 May-08 $1,648,491 $656,000 $118,819 $76,777 $0.30 Aug-08 $1,853,892 $739,321 $187,421 $119,268 $0.46 Nov-08 $1,782,683 $692,857 $136,374 $87,700 $0.34 Feb-09 $1,923,274 $785,058 $231,282 $141,378 $0.55 May-09 $1,694,340 $666,818 $142,304 $87,172 $0.34 Aug-09 $1,914,909 $773,393 $222,031 $135,531 $0.52 Nov-09 $1,975,465 $812,412 $245,611 $151,288 $0.58 Feb-10 $2,244,079 $955,496 $370,741 $226,042 $0.86 May-10 $1,923,051 $775,036 $225,394 $137,553 $0.52 Aug-10 $2,136,730 $874,918 $296,902 $181,755 $0.70 Nov-10 $2,193,755 $896,508 $305,110 $188,574 $0.74 Feb-11 $2,504,967 $1,076,467 $461,052 $283,451 $1.12 May-11 $2,109,951 $857,572 $288,948 $180,578 $0.72 Aug-11 $2,314,064 $950,999 $371,636 $229,372 $0.93 Nov-11 $2,343,561 $958,693 $357,020 $228,544 $0.95 Feb-12 $2,732,314 $1,163,669 $550,765 $351,043 $1.48 May-12 $2,218,292 $887,199 $313,398 $206,836 $0.89 Aug-12 $2,593,015 $1,032,669 $365,137 $224,330 $0.98 Nov-12 $2,701,801 $1,074,010 $361,649 $232,750 $1.03 Feb-13 $3,401,477 $1,394,877 $598,034 $373,872 $1.68 May-13 $2,612,140 $1,032,971 $323,101 $202,490 $0.93 Aug-13 $2,823,672 $1,113,484 $389,766 $249,304 $1.16 -
New Home Sales and Durable Goods Order
Posted by Eddy Elfenbein on September 25th, 2013 at 11:15 amWe had two economic reports today. The first said that sales of new homes rose 7.9% last month. This was nice to see because sales had dropped sharply in July. Since mortgage rates have risen, analysts have been looking for evidence of weakness in the housing sector. While there have been some bumps, there’s no evidence yet of a broad downturn in housing. Homebuilder confidence is at an eight-year high. In the past year, sales of new homes are up 12.6%.
The number of new homes available for sale rose 3.6 percent from July to 175,000. That’s still relatively lean — at the August sales’ pace it would take five months to exhaust the supply.
The median price of a new home sold in August fell 0.7 percent from July to $254,600.
Sales rose in all but one region of the country in August, increasing 19.6 percent in the Midwest, 15.3 percent in the South and 8.8 percent in the Northeast. Sales plunged 14.6 percent in the West, the second straight month of double-digit declines.
The Commerce Department reported that durable goods (items expected to last at least three years) rose 0.1% in August. Like new home sales, this was a turnaround from a drop in July when durable goods fell 8.1%. Much of that drop was due to a fall in aircraft orders.
The August orders were held back by a decline in demand for defense aircraft and other military goods. That could be related to steep government spending cuts that took effect in March. Excluding defense spending, orders rose 0.5%.
Auto factories reported a 2.4% increase in orders, the biggest in six months.
And orders for so-called core capital goods rose 1.5%, after falling 3.3% the previous month. Core capital goods are a good measure of businesses’ confidence in the economy and include items that point to expansion, such as machinery and computers.
Durable goods shipments rose 0.9% in August, after two months of declines. The shipments figures are used to calculate economic growth.
-
Archives
- June 2026
- May 2026
- April 2026
- March 2026
- February 2026
- January 2026
- December 2025
- November 2025
- October 2025
- September 2025
- August 2025
- July 2025
- June 2025
- May 2025
- April 2025
- March 2025
- February 2025
- January 2025
- December 2024
- November 2024
- October 2024
- September 2024
- August 2024
- July 2024
- June 2024
- May 2024
- April 2024
- March 2024
- February 2024
- January 2024
- December 2023
- November 2023
- October 2023
- September 2023
- August 2023
- July 2023
- June 2023
- May 2023
- April 2023
- March 2023
- February 2023
- January 2023
- December 2022
- November 2022
- October 2022
- September 2022
- August 2022
- July 2022
- June 2022
- May 2022
- April 2022
- March 2022
- February 2022
- January 2022
- December 2021
- November 2021
- October 2021
- September 2021
- August 2021
- July 2021
- June 2021
- May 2021
- April 2021
- March 2021
- February 2021
- January 2021
- December 2020
- November 2020
- October 2020
- September 2020
- August 2020
- July 2020
- June 2020
- May 2020
- April 2020
- March 2020
- February 2020
- January 2020
- December 2019
- November 2019
- October 2019
- September 2019
- August 2019
- July 2019
- June 2019
- May 2019
- April 2019
- March 2019
- February 2019
- January 2019
- December 2018
- November 2018
- October 2018
- September 2018
- August 2018
- July 2018
- June 2018
- May 2018
- April 2018
- March 2018
- February 2018
- January 2018
- December 2017
- November 2017
- October 2017
- September 2017
- August 2017
- July 2017
- June 2017
- May 2017
- April 2017
- March 2017
- February 2017
- January 2017
- December 2016
- November 2016
- October 2016
- September 2016
- August 2016
- July 2016
- June 2016
- May 2016
- April 2016
- March 2016
- February 2016
- January 2016
- December 2015
- November 2015
- October 2015
- September 2015
- August 2015
- July 2015
- June 2015
- May 2015
- April 2015
- March 2015
- February 2015
- January 2015
- December 2014
- November 2014
- October 2014
- September 2014
- August 2014
- July 2014
- June 2014
- May 2014
- April 2014
- March 2014
- February 2014
- January 2014
- December 2013
- November 2013
- October 2013
- September 2013
- August 2013
- July 2013
- June 2013
- May 2013
- April 2013
- March 2013
- February 2013
- January 2013
- December 2012
- November 2012
- October 2012
- September 2012
- August 2012
- July 2012
- June 2012
- May 2012
- April 2012
- March 2012
- February 2012
- January 2012
- December 2011
- November 2011
- October 2011
- September 2011
- August 2011
- July 2011
- June 2011
- May 2011
- April 2011
- March 2011
- February 2011
- January 2011
- December 2010
- November 2010
- October 2010
- September 2010
- August 2010
- July 2010
- June 2010
- May 2010
- April 2010
- March 2010
- February 2010
- January 2010
- December 2009
- November 2009
- October 2009
- September 2009
- August 2009
- July 2009
- June 2009
- May 2009
- April 2009
- March 2009
- February 2009
- January 2009
- December 2008
- November 2008
- October 2008
- September 2008
- August 2008
- July 2008
- June 2008
- May 2008
- April 2008
- March 2008
- February 2008
- January 2008
- December 2007
- November 2007
- October 2007
- September 2007
- August 2007
- July 2007
- June 2007
- May 2007
- April 2007
- March 2007
- February 2007
- January 2007
- December 2006
- November 2006
- October 2006
- September 2006
- August 2006
- July 2006
- June 2006
- May 2006
- April 2006
- March 2006
- February 2006
- January 2006
- December 2005
- November 2005
- October 2005
- September 2005
- August 2005
- July 2005
 Eddy Elfenbein is a Washington, DC-based speaker, portfolio manager and editor of the blog Crossing Wall Street. His