-
How Much is Microsoft Worth?
Posted by Eddy Elfenbein on January 31st, 2013 at 8:03 amLast week, Microsoft ($MSFT) finally delivered a decent earnings number. The company earned 76 cents per share which was a penny ahead of expectations. The quarter before that, MSFT missed by three cents per share, and Wall street was not pleased.
Microsoft’s fiscal year ends in June, and the company is on track to earn about $2.85 per share, give or take. But the stock is only up to $27.85 going by yesterday’s close, and that’s after a small rebound. MSFT certainly has its problems, but I would think the world’s largest software outfit could command a P/E Ratio greater than 10.
Here’s a look at Microsoft’s stock and earnings over the past few years. The stock is the blue line and it follows the left scale. The earnings are in black and they follow the right scale. I scaled the two lines at a ratio of 10-to-1 so whenever the lines cross, the stock’s earnings multiple is exactly 10. The red line is Wall Street’s earnings projections.
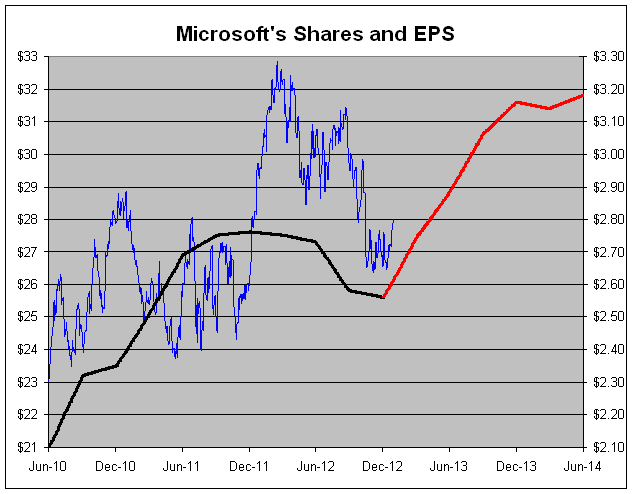
The stock gapped up between November 2011 and March 2012 and investors expected an earnings rebound. It didn’t come. If — and this is a strong if — Wall Street’s earnings forecast is correct, MSFT’s stock should rebound this year. And that’s going by very modest valuations.
To get a good idea of what a fair value is for Microsoft, let’s look at my “world’s simplest stock valuation measure.” The equation is:
Growth Rate/2 + 8 = PE Ratio
For Microsoft, the expected five-year earnings growth rate is 8.38%. The calendar year 2013 earnings estimate is $3.16 per share. That gives us a fair value of $38.52 which means the stock is 28% undervalued.
Please bear in mind that my little equation isn’t a precise measure of true value. It’s a ballpark guideline of what might be a good value. What it really tells us is that investors don’t like Microsoft and they’re steering clear of it, but the recent earnings report had many hopeful signs. For example, the company is seeing renewed strength among its business clients.
Microsoft isn’t in good shape but it’s not nearly as dire as the share price suggests. If the company continues to deliver earnings like last quarter, I think the shares could break $37 before the end of the year.
-
Morning News: January 31, 2013
Posted by Eddy Elfenbein on January 31st, 2013 at 7:20 amReal Estate Losses Weigh On Santander
Philippine Fourth-Quarter GDP Growth Holds Above 6% on Spending
Deutsche Bank Posts $3 Billion Loss on Job Cuts, Capital
Economy’s Slight Shrinkage Late Last Year Surprises Experts
Federal Rule Limits Aid to Families Who Can’t Afford Employers’ Health Coverage
Biggest Defense Spending Dive Since Vietnam Shows Risk of Cuts
Facebook’s Mobile Ad Push Takes Toll On Profit
Honda Sees Quarterly Profits Rise But Cuts Annual Forecast
Shell Profit Up on Refining Margins
AstraZeneca Forecasts Lower Profit Amid Generic Pressure
Diageo Maintains Profit Growth With Move Away From Europe
BlackBerry, Rebuilt, Lives to Fight Another Day
Credit Writedowns: Going For Broke
Epicurean Dealmaker: Where Angels Fear to Tread
Be sure to follow me on Twitter.
-
Nicholas Financial Earned 37 Cents Per Share
Posted by Eddy Elfenbein on January 30th, 2013 at 4:48 pmNicholas Financial ($NICK) earned 37 cents per share for the December quarter which is their Q3. Don’t worry, they had a six-cent charge related to the special dividend. Except for that, these results were largely what I expected.
Nicholas Financial, Inc., announced that for the three months ended December 31, 2012 net earnings decreased 15% to $4,566,000 as compared to $5,363,000 for the three months ended December 31, 2011. Per share diluted net earnings decreased 18% to $0.37 as compared to $0.45 for the three months ended December 31, 2011. Revenue increased 4% to $17,889,000 for the three months ended December 31, 2012 as compared to $17,140,000 for the three months ended December 31, 2011.
For the nine months ended December 31, 2012, net earnings decreased 7% to $15,101,000 as compared to $16,186,000 for the nine months ended December 31, 2011. Per share diluted net earnings decreased 9% to $1.24 as compared to $1.35 for the nine months ended December 31, 2011. Revenue increased 4% to $52,940,000 for the nine months ended December 31, 2012 as compared to $50,985,000 for the nine months ended December 31, 2011.
“During the three months ended December 31, 2012, our results were affected by an increase in the net charge-off rate and an after-tax charge of $747,000 or $0.06 per share, which is related to a 5% withholding tax associated with the one-time special cash dividend of $2.00 per share paid in December 2012. The withholding is required under the Canada-United States Income Tax Convention. While competition remains fierce, we are committed to maintaining our conservative underwriting principles. We will continue to develop additional markets and expect to continue our branch network expansion”, stated Peter L. Vosotas, Chairman and CEO.
A few few things to note. Operating costs rose by 6.3% over Q4 2011 which is steeper than I expected. The provision for credit losses jumped to $819,000 last quarter. That’s the most in two years. We knew the ultra-low numbers weren’t going to last forever, but this provision is still well below what NICK had been setting aside a few years ago.
Outside that and the special dividend taxes, the numbers here are almost the same as the previous few quarters. The portfolio’s gross yield is the highest in four years. Even with the dividend tax, the pre-tax yield is over 10%. During the financial crises and recession, NICK wasn’t able to hit 10% pre-tax for more than three straight years. Without the dividend tax, NICK would have earned 43.6 cents per share last quarter.
-
Has Value Turned a Corner?
Posted by Eddy Elfenbein on January 30th, 2013 at 3:01 pmHere’s a look at the Vanguard Growth Fund (VIGRX) divided by the Vanguard Value Fund (VIVAX). I use these two mutual funds as proxies to see where we are in the growth-value cycle. When the line is rising, growth is leading and when it’s falling, value is leading.
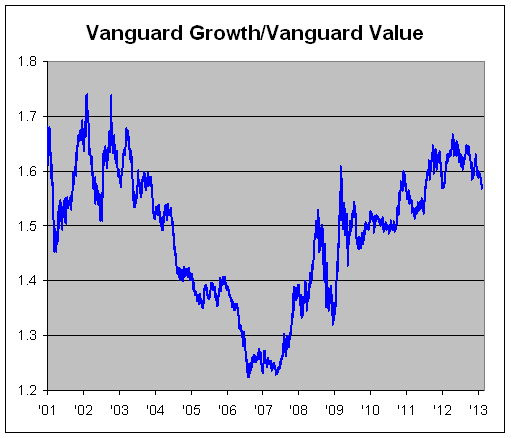
The market was in a growth cycle from August 8, 2006 until April 13, 2012. Value has done well over the last nine months but I think it’s too early to say whether or not this is a multi-year trend. There have been more prominent breakdowns along the way so this could be just another.
Value generally does better when short-term rates are rising. Since rates are at 0%, and have been for a while, growth and value haven’t diverged that much. Once the Fed finally moves, this will probably change very quickly.
-
ADP Jobs Report: +192K
Posted by Eddy Elfenbein on January 30th, 2013 at 2:39 pmThe big jobs report is this Friday. The last few initial claims reports have been quite good. Another positive omen was today’s jobs report from ADP, the private payroll firm. According to ADP, 192,000 private sectors jobs were created last month. Wall Street had been expecting 175,000.
Small businesses led the way, hiring 115,000 workers. Medium-sized businesses added 79,000 jobs, while large firms cut 2,000 positions.
“That’s a good solid number,” said Mark Zandi, chief economist for Moody’s Analytics, which works with ADP on the report. “The job growth is broad-based, across may industries.”
Most jobs were created in the service sector, which added 177,000 positions. The goods producing sector added 15,000. Bright spots included construction, trade, and professional services. The manufacturing sector lost 3,000 jobs.
-
Today’s Fed Statement
Posted by Eddy Elfenbein on January 30th, 2013 at 2:20 pmInformation received since the Federal Open Market Committee met in December suggests that growth in economic activity paused in recent months, in large part because of weather-related disruptions and other transitory factors. Employment has continued to expand at a moderate pace but the unemployment rate remains elevated. Household spending and business fixed investment advanced, and the housing sector has shown further improvement. Inflation has been running somewhat below the Committee’s longer-run objective, apart from temporary variations that largely reflect fluctuations in energy prices. Longer-term inflation expectations have remained stable.
Consistent with its statutory mandate, the Committee seeks to foster maximum employment and price stability. The Committee expects that, with appropriate policy accommodation, economic growth will proceed at a moderate pace and the unemployment rate will gradually decline toward levels the Committee judges consistent with its dual mandate. Although strains in global financial markets have eased somewhat, the Committee continues to see downside risks to the economic outlook. The Committee also anticipates that inflation over the medium term likely will run at or below its 2 percent objective.
To support a stronger economic recovery and to help ensure that inflation, over time, is at the rate most consistent with its dual mandate, the Committee will continue purchasing additional agency mortgage-backed securities at a pace of $40 billion per month and longer-term Treasury securities at a pace of $45 billion per month. The Committee is maintaining its existing policy of reinvesting principal payments from its holdings of agency debt and agency mortgage-backed securities in agency mortgage-backed securities and of rolling over maturing Treasury securities at auction. Taken together, these actions should maintain downward pressure on longer-term interest rates, support mortgage markets, and help to make broader financial conditions more accommodative.
The Committee will closely monitor incoming information on economic and financial developments in coming months. If the outlook for the labor market does not improve substantially, the Committee will continue its purchases of Treasury and agency mortgage-backed securities, and employ its other policy tools as appropriate, until such improvement is achieved in a context of price stability. In determining the size, pace, and composition of its asset purchases, the Committee will, as always, take appropriate account of the likely efficacy and costs of such purchases.
To support continued progress toward maximum employment and price stability, the Committee expects that a highly accommodative stance of monetary policy will remain appropriate for a considerable time after the asset purchase program ends and the economic recovery strengthens. In particular, the Committee decided to keep the target range for the federal funds rate at 0 to 1/4 percent and currently anticipates that this exceptionally low range for the federal funds rate will be appropriate at least as long as the unemployment rate remains above 6-1/2 percent, inflation between one and two years ahead is projected to be no more than a half percentage point above the Committee’s 2 percent longer-run goal, and longer-term inflation expectations continue to be well anchored. In determining how long to maintain a highly accommodative stance of monetary policy, the Committee will also consider other information, including additional measures of labor market conditions, indicators of inflation pressures and inflation expectations, and readings on financial developments. When the Committee decides to begin to remove policy accommodation, it will take a balanced approach consistent with its longer-run goals of maximum employment and inflation of 2 percent.
Voting for the FOMC monetary policy action were: Ben S. Bernanke, Chairman; William C. Dudley, Vice Chairman; James Bullard; Elizabeth A. Duke; Charles L. Evans; Jerome H. Powell; Sarah Bloom Raskin; Eric S. Rosengren; Jeremy C. Stein; Daniel K. Tarullo; and Janet L. Yellen. Voting against the action was Esther L. George, who was concerned that the continued high level of monetary accommodation increased the risks of future economic and financial imbalances and, over time, could cause an increase in long-term inflation expectations.
-
The U.S. Economy Grew Less in the Last 39 Years Than in the 26 Years Before That
Posted by Eddy Elfenbein on January 30th, 2013 at 9:21 amEarlier this morning, I tweeted out a fact that got a lot of attention so I wanted to flesh it out a bit more.
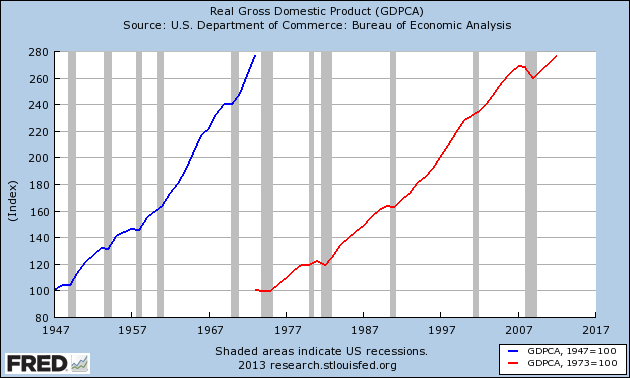
The US economy grew more in real terms from 1947 to 1973 than from 1973 to 2012. That’s 26 years compared with 39 years, exactly 50% longer.
The total growth was almost exactly the same, but the earlier, and shorter, period won by a nose. To be specific, the U.S. economy grew by 176.84% from 1947 to 1973, and 176.60% from 1973 to 2012. Here’s the data source at the FRED database.
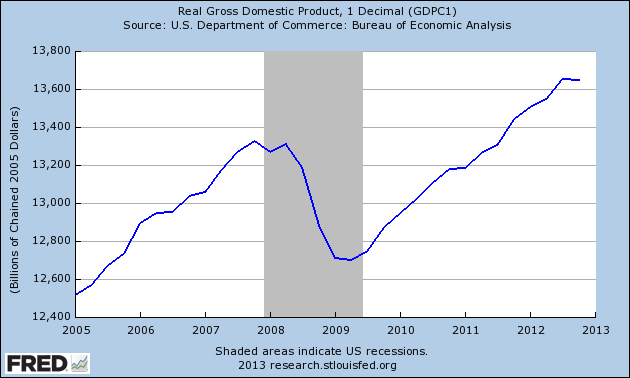
The U.S. economy also grew less over the last 12 years than in the five years prior to that. Over the last 20 quarters (five years), real GDP has grown by 2.41%. Historically, the economy should grow around 16% to 17% over a five-year stretch.
-
Q4 GDP = -0.1%
Posted by Eddy Elfenbein on January 30th, 2013 at 9:06 amA few moments before today’s GDP report, I tweeted that if the number is negative, Twitter would go into complete melt down mode. I was only kidding, but the GDP number was in fact negative. Well, -0.1%. And it was Rick Santelli, CNBC’s in-house scare-monger, that melted down.
As odd as this may sound, the GDP report truly wasn’t that bad. There was a big drop off in military spending. There was also a decline in inventory build-ups which is hardly a bad thing. The numbers “under the hood” were rather decent:
Real personal consumption expenditures increased 2.2 percent in the fourth quarter, compared with an increase of 1.6 percent in the third. Durable goods increased 13.9 percent, compared with an increase of 8.9 percent. Nondurable goods increased 0.4 percent, compared with an increase of 1.2 percent. Services increased 0.9 percent, compared with an increase of 0.6 percent.
Real nonresidential fixed investment increased 8.4 percent in the fourth quarter, in contrast to a decrease of 1.8 percent in the third. Nonresidential structures decreased 1.1 percent; it was unchanged in the third quarter. Equipment and software increased 12.4 percent in the fourth quarter, in contrast to a decrease of 2.6 percent in the third. Real residential fixed investment increased 15.3 percent, compared with an increase of 13.5 percent.
-
Morning News: January 30, 2013
Posted by Eddy Elfenbein on January 30th, 2013 at 6:51 amDeutsche Bank Seen Missing Goldman-Led Gains on Cost Rise
Santander’s Capital in Focus as Spain Property Purge Ends
Japan Has Changed The Game, And Now There Really Could Be A Currency War
Consumer Confidence in U.S. Falls to Lowest Level Since 2011
TARP Watchdog Spars With Treasury on Ally Financial Exit
Breuer Leaves Justice Department With Shift in Tactics
Analysts See the Good in Amazon’s Poor Results
UPS’s Dropped TNT Acquisition Is Formally Blocked by EU
Roche Boosted By Robust US Sales
LG Electronics Posts Loss After EU Fine
Canon Sees Profit Growth on Weaker Yen
Joshua Brown: Business Lessons From The Beatles
Phil Pearlman: Research In Motion: The Phone’s The Thing
Be sure to follow me on Twitter.
-
Rotten Day for our Buy List
Posted by Eddy Elfenbein on January 29th, 2013 at 4:53 pmI always try to upfront about the performance of our Buy List. There are a lot of sketchy characters on the Internet, so I want to be as transparant as possible. Fortunately, we’ve done well over the years so there’s been a lot of celebrating. But there are bad days, too, and today was one.
For the day, our Buy List dropped 0.34% while the S&P 500 gained 0.51%. Ouch, that stings. The good news is that we’re still ahead of the index for the year.
The culprits are easy to spot. Ford fell by 4.64% and Harris lost 4.39%. Our Buy List is very well-diversified so we can often shake off one stock having a bad day, but two weaklings is tough. Outside Ford and Harris, we were only modestly behind the S&P 500 today.
What’s more important to me is that I thought both earnings reports were quite good. I like Ford a lot. While Harris’ lower guidance was troubling, the shares are still going for less than 10 times forward earnings. I expect both stocks to rebound soon.
Today’s lesson: Not every day is a winner for us, but we’re still focused on the long-term.
-
Archives
- June 2026
- May 2026
- April 2026
- March 2026
- February 2026
- January 2026
- December 2025
- November 2025
- October 2025
- September 2025
- August 2025
- July 2025
- June 2025
- May 2025
- April 2025
- March 2025
- February 2025
- January 2025
- December 2024
- November 2024
- October 2024
- September 2024
- August 2024
- July 2024
- June 2024
- May 2024
- April 2024
- March 2024
- February 2024
- January 2024
- December 2023
- November 2023
- October 2023
- September 2023
- August 2023
- July 2023
- June 2023
- May 2023
- April 2023
- March 2023
- February 2023
- January 2023
- December 2022
- November 2022
- October 2022
- September 2022
- August 2022
- July 2022
- June 2022
- May 2022
- April 2022
- March 2022
- February 2022
- January 2022
- December 2021
- November 2021
- October 2021
- September 2021
- August 2021
- July 2021
- June 2021
- May 2021
- April 2021
- March 2021
- February 2021
- January 2021
- December 2020
- November 2020
- October 2020
- September 2020
- August 2020
- July 2020
- June 2020
- May 2020
- April 2020
- March 2020
- February 2020
- January 2020
- December 2019
- November 2019
- October 2019
- September 2019
- August 2019
- July 2019
- June 2019
- May 2019
- April 2019
- March 2019
- February 2019
- January 2019
- December 2018
- November 2018
- October 2018
- September 2018
- August 2018
- July 2018
- June 2018
- May 2018
- April 2018
- March 2018
- February 2018
- January 2018
- December 2017
- November 2017
- October 2017
- September 2017
- August 2017
- July 2017
- June 2017
- May 2017
- April 2017
- March 2017
- February 2017
- January 2017
- December 2016
- November 2016
- October 2016
- September 2016
- August 2016
- July 2016
- June 2016
- May 2016
- April 2016
- March 2016
- February 2016
- January 2016
- December 2015
- November 2015
- October 2015
- September 2015
- August 2015
- July 2015
- June 2015
- May 2015
- April 2015
- March 2015
- February 2015
- January 2015
- December 2014
- November 2014
- October 2014
- September 2014
- August 2014
- July 2014
- June 2014
- May 2014
- April 2014
- March 2014
- February 2014
- January 2014
- December 2013
- November 2013
- October 2013
- September 2013
- August 2013
- July 2013
- June 2013
- May 2013
- April 2013
- March 2013
- February 2013
- January 2013
- December 2012
- November 2012
- October 2012
- September 2012
- August 2012
- July 2012
- June 2012
- May 2012
- April 2012
- March 2012
- February 2012
- January 2012
- December 2011
- November 2011
- October 2011
- September 2011
- August 2011
- July 2011
- June 2011
- May 2011
- April 2011
- March 2011
- February 2011
- January 2011
- December 2010
- November 2010
- October 2010
- September 2010
- August 2010
- July 2010
- June 2010
- May 2010
- April 2010
- March 2010
- February 2010
- January 2010
- December 2009
- November 2009
- October 2009
- September 2009
- August 2009
- July 2009
- June 2009
- May 2009
- April 2009
- March 2009
- February 2009
- January 2009
- December 2008
- November 2008
- October 2008
- September 2008
- August 2008
- July 2008
- June 2008
- May 2008
- April 2008
- March 2008
- February 2008
- January 2008
- December 2007
- November 2007
- October 2007
- September 2007
- August 2007
- July 2007
- June 2007
- May 2007
- April 2007
- March 2007
- February 2007
- January 2007
- December 2006
- November 2006
- October 2006
- September 2006
- August 2006
- July 2006
- June 2006
- May 2006
- April 2006
- March 2006
- February 2006
- January 2006
- December 2005
- November 2005
- October 2005
- September 2005
- August 2005
- July 2005
 Eddy Elfenbein is a Washington, DC-based speaker, portfolio manager and editor of the blog Crossing Wall Street. His