-
Cyclicals Continue to Lead
Posted by Eddy Elfenbein on January 2nd, 2013 at 11:08 amHere’s a look at the Morgan Stanley Cyclical Index ($CYC) relative to the S&P 500.
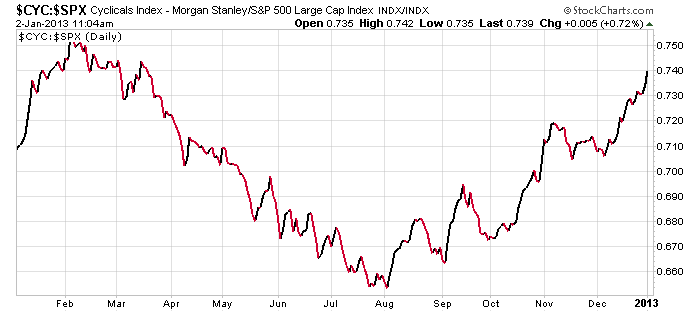
The cyclicals grabbed the lead right after Mario Draghi said that the ECB would do “whatever it takes” to save the euro. As I said before, today is a high-beta rally. The Russell 2000 ($RUT) and the Equal Weight S&P 500 are at all-time highs.
-
2013 Is Off to a Strong Start
Posted by Eddy Elfenbein on January 2nd, 2013 at 10:52 amFor the last few weeks I’ve cautioned investors to ignore the hype about the Fiscal Cliff. Eventually, I believed, some deal would be reached, and late last night, that’s exactly what happened. Here are the details.
It wasn’t pretty and not everybody got what they wanted, but compromise is the cornerstone of democracy. Plus, there will be more battles ahead on the debt ceiling.
The good news is that the markets are responding very well this morning. The S&P 500 has been as high as 1,457.53 this morning. That’s a 2.2% jump and it brings the index just eight points shy of its highest close since 2007. On our Buy List, Oracle ($ORCL) is up to an 18-month high this morning.

Today’s rally is what’s called a high-beta rally which means that the leaders are small-cap stocks plus industries like tech (like Oracle), finance and cyclicals. High-beta rallies usually (but not always) tend to pull along lower-quality stocks with them. There are lots of sketchy names among small-cap tech stocks. Since our Buy List is concentrated among high-quality stocks, we tend to lag the broader markets on days like this. The Russell 2000, which is a popular index of the small-cap sector, is up to an all-time high this morning.
Still, our Buy List is beginning 2013 on a strong note. Every stock but Ross Stores ($ROST) is higher today. I was pleased to see that CR Bard ($BCR) was upgraded by JPMorgan today. (The Buy List is so new I haven’t had time to enter in comments for the new additions. I’d better get on that.)
On the economic front, the ISM Index for December rose to 50.7. If you recall, the number for November was 49.5 which was a dud. Any reading above 50 means the manufacturing sector is expanding. Below 50 means it’s shrinking. The worry zone doesn’t really kick in until the ISM drops to 45 or so. The next big report will be Friday’s jobs report.
-
Morning News: January 2, 2013
Posted by Eddy Elfenbein on January 2nd, 2013 at 6:49 amU.S. Fiscal Cliff Deal Prompts Broad Global Market Rally
Bipartisan House Backs Tax Deal Vote as Next Fight Looms
Bond Tab for Biggest Economies Seen Falling $220 Billion
Senate Plan Undoes Most of $600 Billion in Budget Changes
Euro-Zone Manufacturing Shrinks in December
Macau Casinos End Year on a High
Malls Blossom in Russia, With a Middle Class
Tech Giants Brace for More Scrutiny From Regulators
Arcelormittal To Sell $1.1bln Stake In Canadian Unit
Hyundai, Kia Forecast Slowest Growth in Seven Years
Middleby Buys Appliance Maker Viking For $380 Million
Buffett Combines BofA With Buybacks to Beat S&P 500
Crime Forfeiture Pays for U.S. Attorney’s Office (Sometimes in Dinosaur Bones)
Joshua Brown: Binary Sunset, Revisited
Phil Pearlman: Crushing It Is a Process
Be sure to follow me on Twitter.
-
BW: How Your Buy Order Gets Filled
Posted by Eddy Elfenbein on January 1st, 2013 at 9:18 amHere’s a cool graphic from Business Week on how your buy order gets filled.
-
Morning News: January 1, 2013
Posted by Eddy Elfenbein on January 1st, 2013 at 7:45 amU.S. Budget Compromise Deal Reached
Senate Passes Legislation to Allow Taxes on Affluent to Rise
Wall Street Ends 2012 Riding High On “Cliff” Deal Optimism
Debt Limit Reached, U.S. Moving To Avoid Default: Timothy Geithner
Yen Tipped To Underperform In 2013
China Manufacturing Index Shows Third Straight Expansion
Best and Worst Bond ETFs of 2012
Bond Craze Could Run Its Course in New Year
U.S. Mortgage Firms Said to Near $10 Billion Settlement
Tribune Co. Looks To Television After Bankruptcy
Best Buy Loses Two Board Directors
Elbit Drop Cut as Conflict Lifts Orders: Israel Overnight
Facebook’s Last Sell Rating Is Lifted
Cullen Roche: Lessons From 2012…
Be sure to follow me on Twitter.
-
The 2013 Buy List
Posted by Eddy Elfenbein on December 31st, 2012 at 8:56 pmHere are the 20 stocks for the 2013 Buy List. It’s locked and sealed and I can’t make any changes for 12 months.
For tracking purposes, I assume the Buy List is a $1 million portfolio that’s equally divided among 20 stocks. Below are all 20 positions with the amount of shares for each, and the closing price for 2012. Whenever I discuss how the Buy List is doing, the list below is what I’m referring to.
Company Ticker Price Shares Balance AFLAC AFL $53.12 941.2651 $50,000.00 Bed Bath & Beyond BBBY $55.91 894.2944 $50,000.00 CA Technologies CA $21.98 2,274.7953 $50,000.00 Cognizant Technology Solutions CTSH $73.88 676.7731 $50,000.00 CR Bard BCR $97.74 511.5613 $50,000.00 DirecTV DTV $50.16 996.8102 $50,000.00 FactSet Research Systems FDS $88.06 567.7947 $50,000.00 Fiserv FISV $79.03 632.6711 $50,000.00 Ford Motor F $12.95 3,861.0039 $50,000.00 Harris Corporation HRS $48.96 1,021.2418 $50,000.00 JPMorgan Chase JPM $43.97 1,137.1390 $50,000.00 Medtronic MDT $41.02 1,218.9176 $50,000.00 Microsoft MSFT $26.71 1,871.9581 $50,000.00 Moog MOG-A $41.03 1,218.6205 $50,000.00 Nicholas Financial NICK $12.40 4,032.2581 $50,000.00 Oracle ORCL $33.32 1,500.6002 $50,000.00 Ross Stores ROST $54.09 924.3853 $50,000.00 Stryker SYK $54.82 912.0759 $50,000.00 Wells Fargo WFC $34.18 1,462.8438 $50,000.00 WEX Inc. WXS $75.37 663.3939 $50,000.00 There are five new stocks and five stocks that I’m removing. The five new stocks are Cognizant Technology Solutions ($CTSH), FactSet Research Systems ($FDS), Microsoft ($MSFT), Ross Stores ($ROST) and Wells Fargo ($WFC).
The five stocks I’m removing are Hudson City Bancorp ($HCBK), Johnson & Johnson ($JNJ), JoS. A Bank Clothiers ($JOSB), Reynolds American ($RAI) and Sysco ($SYY).
The average market cap is $49 billion. That ranges from a high of $225 billion for Microsoft to $150 million for Nicholas Financial ($NICK). Moog ($MOG-A) is the second-smallest and it’s still 12 times the size of Nicholas.
Fourteen of the twenty stocks pay dividends. The average yield is 1.64%.
Only four stocks have remained on the Buy List for all seven years: AFLAC ($AFL), Bed Bath & Beyond ($BBBY), Fiserv ($FISV) and Medtronic ($MDT).
The 2012 Buy List
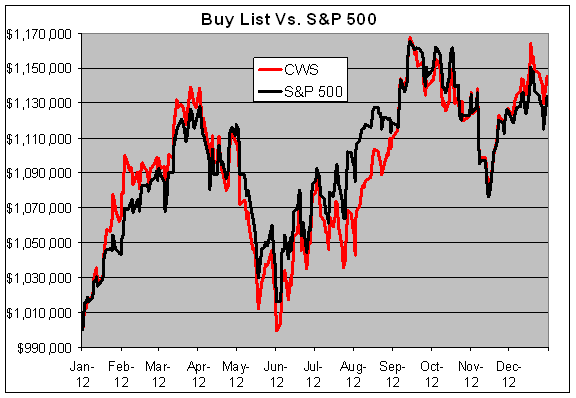
Posted by Eddy Elfenbein on December 31st, 2012 at 7:43 pmThe 2012 trading year has come to a close. I’m happy to report that our Buy List had another market-beating year. The 20 stocks on the Crossing Wall Street Buy List gained 14.56% while the S&P 500 gained 13.41%. This is the sixth year in a row that we have beaten the market.
Including dividends, our Buy List gained 17.85% compared with 16.00% for the S&P 500. The dividend yield for the Buy List worked out to 2.16% while it was 2.28% for the S&P 500. For the year, our beta was 1.0376.
Over the seven-year history of the Buy List, we’ve gained 62.30% to the S&P 500’s 32.65%. Our annual turnover has been just 25% which means we’ve only changed five stocks per year. The seven-year beta is 0.9591.
I’ll restate the rules of the Buy List. I choose a portfolio of 20 stocks at the beginning of the year. After that, the Buy List is locked for the year and I can’t make any changes until the following year. For tracking purposes, I assume that the Buy List is a $1 million portfolio equally divided among the 20 stocks. You can check the performance of the Buy List anytime at our Buy List page.
My goal is to show investors that by choosing stocks wisely and by sticking with high-quality stocks, they can beat the market—and that’s exactly what we’ve done. I try to beat the market by a few percentage points and to do it with less risk.
Our top-performing stock in 2012 was WEX Inc. ($WXS) which gained 38.85%. Other big winners were Harris Corp. ($HRS) up 35.85%, Fiserv ($FISV) up 34.54% and JPMorgan Chase ($JPM) up 32.24%.
Here’s how each stock performed:
Stock Shares 12/31/2011 Beginning 12/31/2012 Ending Profit/Loss AFL 1155.8021 $43.26 $50,000.00 $53.12 $61,396.21 22.79% BBBY 862.5151 $57.97 $50,000.00 $55.91 $48,223.22 -3.55% CA 2472.7992 $20.22 $50,000.00 $21.98 $54,352.13 8.70% BCR 584.7953 $85.50 $50,000.00 $97.74 $57,157.89 14.32% DTV 1169.3171 $42.76 $50,000.00 $50.16 $58,652.95 17.31% FISV 851.2087 $58.74 $50,000.00 $79.03 $67,271.02 34.54% F 4646.8401 $10.76 $50,000.00 $12.95 $60,176.58 20.35% HRS 1387.3474 $36.04 $50,000.00 $48.96 $67,924.53 35.85% HCBK 8000.0000 $6.25 $50,000.00 $8.13 $65,040.00 30.08% JNJ 762.4276 $65.58 $50,000.00 $70.10 $53,446.17 6.89% JOSB 1025.4307 $48.76 $50,000.00 $42.58 $43,662.84 -12.67% JPM 1503.7594 $33.25 $50,000.00 $43.97 $66,120.30 32.24% MDT 1307.1895 $38.25 $50,000.00 $41.02 $53,620.91 7.24% MOG-A 1138.1744 $43.93 $50,000.00 $41.03 $46,699.29 -6.60% NICK 3900.1560 $12.82 $50,000.00 $12.40 $48,361.93 -3.28% ORCL 1949.3177 $25.65 $50,000.00 $33.32 $64,951.27 29.90% RAI 1207.1463 $41.42 $50,000.00 $41.43 $50,012.07 0.02% SYK 1005.8338 $49.71 $50,000.00 $54.82 $55,139.81 10.28% SYY 1704.7392 $29.33 $50,000.00 $31.66 $53,972.04 7.94% WXS 921.1496 $54.28 $50,000.00 $75.37 $69,427.04 38.85% Total $1,000,000 $1,145,608.20 14.56% Here’s how the Buy List performed throughout the year.
Two Thoughts As 2012 Winds Down
Posted by Eddy Elfenbein on December 31st, 2012 at 11:45 amHere are two things that have been on my mind as the year winds down.
I’m curious if the March 2009 low in the S&P 500, now nearly four years old, marked the end of the brutal nine-year bear market that began in March 2000. That, of course, was the capstone of an 18-year bull market that began in 1982.
If so, it’s interesting that the bear run was about half the time of the bull run. We never know these things until a few years after they happen. I suspect that it was the low.
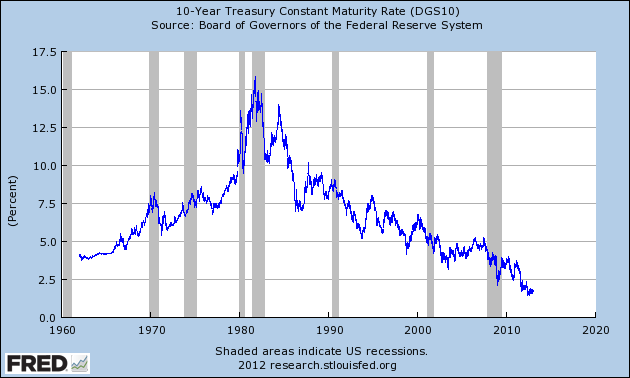
The other item on my mind is, did the bond market’s peak this past July of this year mark the end of its 31-year run? On July 25, 2012, the yield on the three-, five-, seven-, ten-, twenty- and thirty-year Treasuries all hit their lows. This was right at the time of Mario Draghi’s “whatever it takes” pledge.
Yields have risen since then but every prediction of the bond market’s demise — and there have been many — has been wrong. I’m fairly certain that stocks hit their low, but I’m not so sure about bonds.
NICK’s Special Dividend
Posted by Eddy Elfenbein on December 31st, 2012 at 11:27 amA few of you have asked about Nicholas Financial‘s ($NICK) special dividend. I was expecting it to hit accounts today but haven’t seen it yet. I’m not sure why but I’m looking into it. I’m sure there’s no need to be alarmed. Like many of you, I just want to find out exactly what’s happening.
Update: The big dividend hit my personal account around 5:30 pm.
A Deal May Be Near
Posted by Eddy Elfenbein on December 31st, 2012 at 11:09 amThe final day of trading is underway. The seemingly unending Fiscal Cliff drama continues. Honestly, I’m a bit dizzy from the constant news. The latest is that both sides are very close to reaching a deal. On the major points, the Democrats have agreed to raise the tax threshold to $450,000. The GOP is holding out for $550,000. The Democrats want to raise dividend taxes to 20% on households making over $250,000.
Despite the positive news on Fiscal Cliff negotiations, the market is up rather modestly. Joe Weisenthal of Business Insider notes that the market is actually doing quite well when compared to some of the worse points of the futures market this weekend. The Senate has just reconvened to discuss the Fiscal Cliff.
The S&P 500 is currently up five points to 1,407.
-
Archives
- July 2026
- June 2026
- May 2026
- April 2026
- March 2026
- February 2026
- January 2026
- December 2025
- November 2025
- October 2025
- September 2025
- August 2025
- July 2025
- June 2025
- May 2025
- April 2025
- March 2025
- February 2025
- January 2025
- December 2024
- November 2024
- October 2024
- September 2024
- August 2024
- July 2024
- June 2024
- May 2024
- April 2024
- March 2024
- February 2024
- January 2024
- December 2023
- November 2023
- October 2023
- September 2023
- August 2023
- July 2023
- June 2023
- May 2023
- April 2023
- March 2023
- February 2023
- January 2023
- December 2022
- November 2022
- October 2022
- September 2022
- August 2022
- July 2022
- June 2022
- May 2022
- April 2022
- March 2022
- February 2022
- January 2022
- December 2021
- November 2021
- October 2021
- September 2021
- August 2021
- July 2021
- June 2021
- May 2021
- April 2021
- March 2021
- February 2021
- January 2021
- December 2020
- November 2020
- October 2020
- September 2020
- August 2020
- July 2020
- June 2020
- May 2020
- April 2020
- March 2020
- February 2020
- January 2020
- December 2019
- November 2019
- October 2019
- September 2019
- August 2019
- July 2019
- June 2019
- May 2019
- April 2019
- March 2019
- February 2019
- January 2019
- December 2018
- November 2018
- October 2018
- September 2018
- August 2018
- July 2018
- June 2018
- May 2018
- April 2018
- March 2018
- February 2018
- January 2018
- December 2017
- November 2017
- October 2017
- September 2017
- August 2017
- July 2017
- June 2017
- May 2017
- April 2017
- March 2017
- February 2017
- January 2017
- December 2016
- November 2016
- October 2016
- September 2016
- August 2016
- July 2016
- June 2016
- May 2016
- April 2016
- March 2016
- February 2016
- January 2016
- December 2015
- November 2015
- October 2015
- September 2015
- August 2015
- July 2015
- June 2015
- May 2015
- April 2015
- March 2015
- February 2015
- January 2015
- December 2014
- November 2014
- October 2014
- September 2014
- August 2014
- July 2014
- June 2014
- May 2014
- April 2014
- March 2014
- February 2014
- January 2014
- December 2013
- November 2013
- October 2013
- September 2013
- August 2013
- July 2013
- June 2013
- May 2013
- April 2013
- March 2013
- February 2013
- January 2013
- December 2012
- November 2012
- October 2012
- September 2012
- August 2012
- July 2012
- June 2012
- May 2012
- April 2012
- March 2012
- February 2012
- January 2012
- December 2011
- November 2011
- October 2011
- September 2011
- August 2011
- July 2011
- June 2011
- May 2011
- April 2011
- March 2011
- February 2011
- January 2011
- December 2010
- November 2010
- October 2010
- September 2010
- August 2010
- July 2010
- June 2010
- May 2010
- April 2010
- March 2010
- February 2010
- January 2010
- December 2009
- November 2009
- October 2009
- September 2009
- August 2009
- July 2009
- June 2009
- May 2009
- April 2009
- March 2009
- February 2009
- January 2009
- December 2008
- November 2008
- October 2008
- September 2008
- August 2008
- July 2008
- June 2008
- May 2008
- April 2008
- March 2008
- February 2008
- January 2008
- December 2007
- November 2007
- October 2007
- September 2007
- August 2007
- July 2007
- June 2007
- May 2007
- April 2007
- March 2007
- February 2007
- January 2007
- December 2006
- November 2006
- October 2006
- September 2006
- August 2006
- July 2006
- June 2006
- May 2006
- April 2006
- March 2006
- February 2006
- January 2006
- December 2005
- November 2005
- October 2005
- September 2005
- August 2005
- July 2005
 Eddy Elfenbein is a Washington, DC-based speaker, portfolio manager and editor of the blog Crossing Wall Street. His