-
Morning News: October 17, 2012
Posted by Eddy Elfenbein on October 17th, 2012 at 5:47 amRelief As Spain Avoids Being Downgraded On Eve Of EU Summit
RBS Exits Government Insurance Plan
BoE Officials Split On Likely Need For Further QE
Crude Oil Trades Near One-Week High in New York
Strong Earnings Reports at Bellwether Companies Bolster Shares
What Happened to Vikram Pandit?
Electric Car Battery Maker A123 Systems Files Bankruptcy
Softbank’s Son Seeks to Skirt Cross-Border Failure History
ASML to Buy Cymer for $2.6 Billion to Boost Chip Technology
J&J’s Third-Quarter Profit Beats Estimates on Drug Sales
I.B.M. Squeezes Out a Profit as Its Revenue Declines
Coca-Cola Third-Quarter Profit Advances as Europe Improves
Goldman Sachs Swings to Profit as Revenue Surges
Roger Nusbaum: Bill Miller Update
Howard Lindzon: The Stocktwits Blog Network, Citibank and Pandit on LinkedIN
Be sure to follow me on Twitter.
-
The Dow-to-Gold Ratio Since 1968
Posted by Eddy Elfenbein on October 16th, 2012 at 2:00 pmI usually caution investors from looking at these types of charts, so you’ll have to excuse me, but here’s a look at how the Dow has performed in terms of gold since 1968.
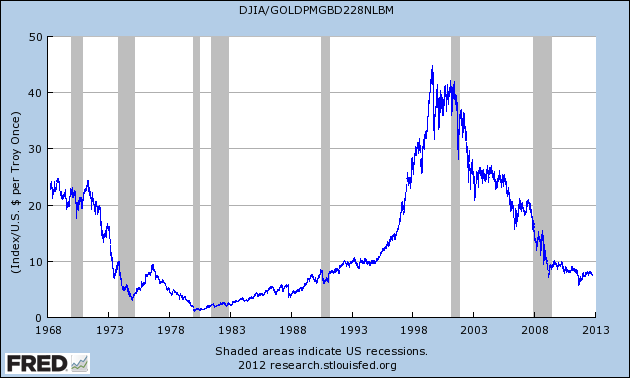
The difference is that I think this chart is interesting for its own sake. I don’t think there’s any useful analysis here. For one, it leaves out dividends which add up over the decades.
The trend of gold’s out-performance over the past several years is remarkable. If the Dow had kept pace with gold since August 25, 1999, it would be at 77,800 today instead of 13,500.
On January 21, 1980, the ratio got down to 1, but by August 1999, it had risen to 44. Since then, it’s been down, down, down. In August of last year, the ratio fell below 5.8. By this past August, the ratio got back over 8.2, and today we’re right around 7.75.
-
September Industrial Production = +0.4%
Posted by Eddy Elfenbein on October 16th, 2012 at 10:49 amThe government reported this morning that industrial production rose by 0.4% last month which was above Wall Street’s consensus of 0.2%. This was an interesting report to watch because industrial production took a big hit in August when it dropped by 1.4%. That may have just been a blip instead of the beginning of a long-term trend. This also confirms the strength we’re seeing from consumers. Retail sales just had their biggest two-month gain in nearly two years. The Commerce Department said that retail sales rose by 1.1% in September which comes after a 1.2% increase in August.
The government also reported that the CPI rose by 0.6% in September. But the core rate, which excludes food and energy, rose by just 0.1%.
Goldman Sachs ($GS) reported third-quarter earnings of $2.85 per share. That was 73 cents per share above forecasts. The company also raised its quarterly dividend by four cents to 5 cents per share. In the same quarter one year ago, Goldman lost 84 cents per share.
Perhaps the biggest news today is that Vikram Pandit resigned as CEO of Citigroup ($C). This was a big surprise. Apparently Pandit and the board clashed over how to lead the business. Citigroup aside, I’d like to see more instances of a board winning conflicts with CEOs. The stock has lost 88.4% since Pandit took over in 2007.
So far, 48 companies in the S&P 500 have reported earnings and 35 have topped estimates.
-
Johnson & Johnson Earns $1.25 Per Share
Posted by Eddy Elfenbein on October 16th, 2012 at 9:43 amGood news for Johnson & Johnson ($JNJ). The company reported third-quarter earnings of $1.25 per share which was four cents more than expectations. JNJ also raised full-year guidance from a range of $5.00 to $5.07 per share, to a new range of $5.05 to $5.10 per share.
Sales of recently approved drugs, including Zytiga for prostate cancer, Xarelto for stroke prevention and Stelara for psoriasis helped push revenue 6.5 percent to $17.1 billion for the quarter, from $16 billion a year earlier. The June purchase of Synthes Inc. with novel financing that used cash that had accumulated outside the U.S. also bolstered the company’s quarterly earnings.
“We continue to see improving fundamentals at J&J across all of its segments,” Derrick Sung, an analyst at Sanford C. Bernstein & Co. in New York, said in an Oct. 12 note to investors. “In pharma, J&J will start seeing contributions this year” from products that could generate nearly $7 billion annually by 2015, he said. “J&J’s competitive position and growth prospects are now strengthened by the closing of the Synthes acquisition.”
For the first nine months of this year, JNJ has earned $3.91 per share. That means they see Q4 coming in between $1.14 and $1.19 per share. The stock has a very good shot of making a new 52-week high today, and then making a run at the all-time high set four years ago.
In July, JNJ lowered their full-year guidance from $5.07 to $5.17 per share to $5.00 to $5.07 per share. So they’re taking back a good deal of that lowering.
The Street currently expects JNJ to earn $5.47 per share for 2013. With today’s earnings report, I think that will be bumped up a few pennies. JNJ remains a very good buy.
-
What I’m Watching this Earnings Season
Posted by Eddy Elfenbein on October 16th, 2012 at 9:24 amOutside of pure bottom line numbers, here are eight things I’m looking for this earnings season.
1. How much has the dollar hurt revenues? This was a big factor during Q2. It shouldn’t be as much for Q3, but let’s see the details.
2. Are companies raising dividends? This has been a big year for dividends. Goldman just raised its payout. Will this trend continue?
3. Where are the strong areas? So far, there were impressive beats from ConAgra and Lennar. Does this mean that housing is continuing to lift the consumer?
4. What kind of guidance are we seeing for Q4 and 2012? J&J just bumped up guidance after lowering it before.
5. What are expansion plans like? A few retailers recently announced quite large hiring plans over the holidays. Walmart’s stock is at an all-time high.
6. Do we have any clues what the holiday season will be like? We haven’t had a blow-out holiday season in a few years.
7. Margin pressure. We stretched profit margins about as far as they can go. What kind of pricing pressure do firms have, especially at the high end?
8. What’s the damage from Europe? This was another major theme during Q2. Do U.S.-based firms still have large exposure to the economic chaos there?
-
Morning News: October 16, 2012
Posted by Eddy Elfenbein on October 16th, 2012 at 5:57 amSpain Considers EU Credit Line
German Investor Sentiment Rose in October on ECB Plan
U.K. Inflation Cools to 2.2%, Least in Almost Three Years
China Credit Card Romney Assails Gives Way to Japan
Soybeans Fall Below $15 for First Time Since July on Demand Drop
Wall Street Rallies On Citigroup’s Earnings, Retail Sales
Retail Sales Rise 1.1% In September, Beating Expectations
5 Huge Myths About Social Security
Japanese Firm Softbank To Buy 70% Of Sprint For $20.1 Billion
Citigroup Profit Beats Estimate on Gains From Bond Trading
There Will Be a Factory Skills Shortage. Just Not Yet
Inside Yahoo! How Marissa Mayer Can Turn it All Around
2 From U.S. Win Nobel in Economics
Credit Writedowns: Switzerland And The Euro Zone: An Overlooked Currency War In Europe
Be sure to follow me on Twitter.
-
The 50-DMA Holds Again
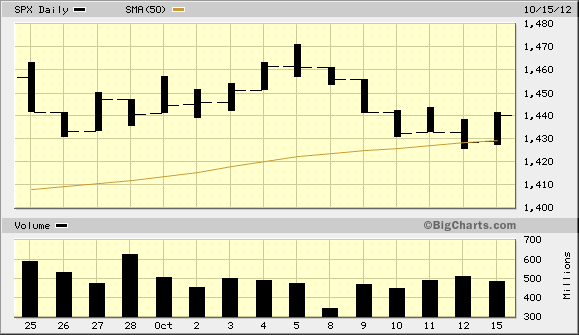
Posted by Eddy Elfenbein on October 15th, 2012 at 6:00 pmThe biggest difference between theory and practice on Wall Street is technical analysis. Every academic dismisses it as voodoo, but nearly everyone who follows the market regularly gives it at least some credibility.
Personally, I’m in the doubter camp but I do have to concede that the market seems to take moving average points seriously. Perhaps it’s just a coincidence — yet another attempt to find logic in a random pattern — but the S&P 500 just made a near perfect bounce off its 50-DMA.
-
WMT and JNJ Break Out from Long Ranges
Posted by Eddy Elfenbein on October 15th, 2012 at 1:26 pmIn June, shares of Walmart ($WMT) finally took out the stock’s all-time high from 12.5 years before. For much of that time, the stock was locked in what I called the “Mother of All Trading Ranges.” Consider this: For 3,107 straight trading days (or 148 months), Walmart never closed above $65 or below $42. Not once.
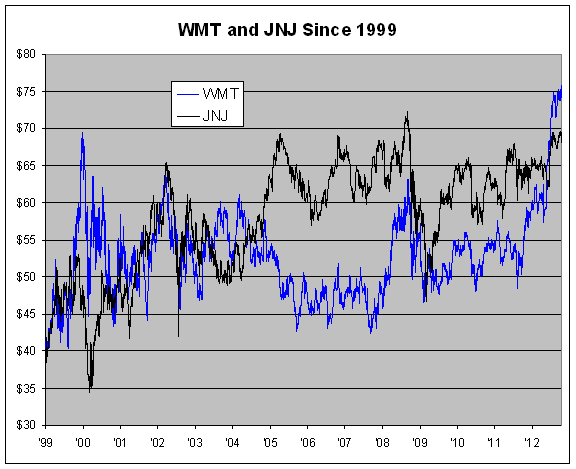
Now we’re seeing a similar story with Johnson & Johnson ($JNJ). Last week, the stock came close to breaking through $70 per share which is something it hasn’t done in more than four years. While JNJ’s trading range hasn’t been as narrow or as long as Walmart’s, the stock has spent almost the entire past eight years bouncing between $57 and $72 per share.
This could signal that after a very long rough patch, large-cap blue chips are ready to make new highs.
-
Lazard Lowers Harris to Sell
Posted by Eddy Elfenbein on October 15th, 2012 at 12:20 pmShares of Harris Corp. ($HRS) are down today after Lazard Capital lowered their rating on the stock to “Sell.” The stock has been down as much as 4.7% today. This comes after a drop of 4% on Friday.
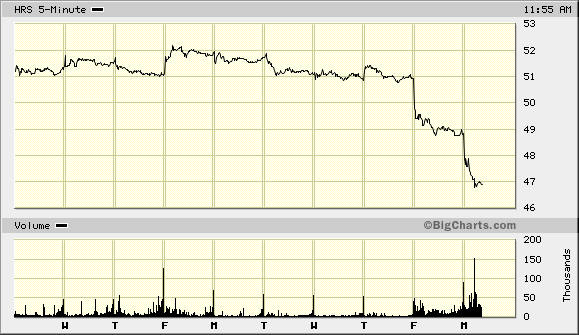
Let me caution investors not to get too rattled by this sell-off. I think Lazard is way off base here but let’s remember that Harris has had a very strong run since the summer. I had purposely kept my buy-below price at $50 even though the stock had cleared that hurdle. It even broke $52 per share recently. We want to stay disciplined and wait for good stocks to come to us.
Good stocks can bounce around like that. In fact, Harris lost 15.6% between April 30 and May 18 of this year. Despite that, it’s still up over 30% on the year for us. That’s just how the stock market works.
Harris is going for less than 10 times earnings, and the lower share price gives the dividend a yield of 3.15%. Only a few weeks ago, Harris raised their dividend by 12%. I expect another good earnings report in a few weeks. Harris remains a very solid buy.
-
Profits from HFT Down 35% from Last Year
Posted by Eddy Elfenbein on October 15th, 2012 at 11:11 amThe New York Times reports that profits from high-frequency trading are down big this year:
Profits from high-speed trading in American stocks are on track to be, at most, $1.25 billion this year, down 35 percent from last year and 74 percent lower than the peak of about $4.9 billion in 2009, according to estimates from the brokerage firm Rosenblatt Securities. By comparison, Wells Fargo and JPMorgan Chase each earned more in the last quarter than the high-speed trading industry will earn this year.
While no official data is kept on employment at the high-speed firms, interviews with more than a dozen industry participants suggest that firms large and small have been cutting staff, and in some cases have shut down. The firms also are accounting for a declining percentage of a shrinking pool of stock trading, from 61 percent three years ago to 51 percent now, according to the Tabb Group, a data firm.
It is a swift reversal for trading firms that have often looked to other investors like profit machines, thanks to high-powered software and superfast data connections that can take advantage of small changes in the price of a stock.
Part of the reason HFT is getting squeezed is a general decline in trading volume. There’s also been a decline in volatility. Rising markets tend to be much calmer than falling markets.
-
Archives
- July 2026
- June 2026
- May 2026
- April 2026
- March 2026
- February 2026
- January 2026
- December 2025
- November 2025
- October 2025
- September 2025
- August 2025
- July 2025
- June 2025
- May 2025
- April 2025
- March 2025
- February 2025
- January 2025
- December 2024
- November 2024
- October 2024
- September 2024
- August 2024
- July 2024
- June 2024
- May 2024
- April 2024
- March 2024
- February 2024
- January 2024
- December 2023
- November 2023
- October 2023
- September 2023
- August 2023
- July 2023
- June 2023
- May 2023
- April 2023
- March 2023
- February 2023
- January 2023
- December 2022
- November 2022
- October 2022
- September 2022
- August 2022
- July 2022
- June 2022
- May 2022
- April 2022
- March 2022
- February 2022
- January 2022
- December 2021
- November 2021
- October 2021
- September 2021
- August 2021
- July 2021
- June 2021
- May 2021
- April 2021
- March 2021
- February 2021
- January 2021
- December 2020
- November 2020
- October 2020
- September 2020
- August 2020
- July 2020
- June 2020
- May 2020
- April 2020
- March 2020
- February 2020
- January 2020
- December 2019
- November 2019
- October 2019
- September 2019
- August 2019
- July 2019
- June 2019
- May 2019
- April 2019
- March 2019
- February 2019
- January 2019
- December 2018
- November 2018
- October 2018
- September 2018
- August 2018
- July 2018
- June 2018
- May 2018
- April 2018
- March 2018
- February 2018
- January 2018
- December 2017
- November 2017
- October 2017
- September 2017
- August 2017
- July 2017
- June 2017
- May 2017
- April 2017
- March 2017
- February 2017
- January 2017
- December 2016
- November 2016
- October 2016
- September 2016
- August 2016
- July 2016
- June 2016
- May 2016
- April 2016
- March 2016
- February 2016
- January 2016
- December 2015
- November 2015
- October 2015
- September 2015
- August 2015
- July 2015
- June 2015
- May 2015
- April 2015
- March 2015
- February 2015
- January 2015
- December 2014
- November 2014
- October 2014
- September 2014
- August 2014
- July 2014
- June 2014
- May 2014
- April 2014
- March 2014
- February 2014
- January 2014
- December 2013
- November 2013
- October 2013
- September 2013
- August 2013
- July 2013
- June 2013
- May 2013
- April 2013
- March 2013
- February 2013
- January 2013
- December 2012
- November 2012
- October 2012
- September 2012
- August 2012
- July 2012
- June 2012
- May 2012
- April 2012
- March 2012
- February 2012
- January 2012
- December 2011
- November 2011
- October 2011
- September 2011
- August 2011
- July 2011
- June 2011
- May 2011
- April 2011
- March 2011
- February 2011
- January 2011
- December 2010
- November 2010
- October 2010
- September 2010
- August 2010
- July 2010
- June 2010
- May 2010
- April 2010
- March 2010
- February 2010
- January 2010
- December 2009
- November 2009
- October 2009
- September 2009
- August 2009
- July 2009
- June 2009
- May 2009
- April 2009
- March 2009
- February 2009
- January 2009
- December 2008
- November 2008
- October 2008
- September 2008
- August 2008
- July 2008
- June 2008
- May 2008
- April 2008
- March 2008
- February 2008
- January 2008
- December 2007
- November 2007
- October 2007
- September 2007
- August 2007
- July 2007
- June 2007
- May 2007
- April 2007
- March 2007
- February 2007
- January 2007
- December 2006
- November 2006
- October 2006
- September 2006
- August 2006
- July 2006
- June 2006
- May 2006
- April 2006
- March 2006
- February 2006
- January 2006
- December 2005
- November 2005
- October 2005
- September 2005
- August 2005
- July 2005
 Eddy Elfenbein is a Washington, DC-based speaker, portfolio manager and editor of the blog Crossing Wall Street. His