-
How to Know When to Sell
Posted by Eddy Elfenbein on July 5th, 2012 at 6:13 pm -
Morning News: July 5, 2012
Posted by Eddy Elfenbein on July 5th, 2012 at 7:07 amLagarde Consumed by Crisis Steers IMF Tough Love to EU
Draghi-King Push May Mean Bigger Step Into Zero-Rate Era
German Factory Orders Unexpectedly Rose on Euro-Area Demand
Ireland Takes First Step Towards Bond Market Return
Spain Meets Target at Bond Auction as Borrowing Costs Rise
Britain’s Hidden Hunger Puts Spotlight on Cameron Budget Cuts
Apple Said to Plan Smaller IPad to Vie With Google Nexus
In Silicon Valley, Chieftains Rule With Few Checks and Balances
Volkswagen to Buy Remaining Stake in Porsche
Boeing Seeks Big Farnborough Orders Under New Boss
Luring Online Shoppers Offline
Barclays’ Ex-Chief Spreads the Blame in Rate-Rigging Scandal
Credit Writedowns: How To Achieve Financial Reform in China
Stone Street: Accountability – Taking Stock
Be sure to follow me on Twitter.
-
Happy 236th, America!
Posted by Eddy Elfenbein on July 4th, 2012 at 10:10 amI hope everyone has a wonderful Fourth of July.

-
Morning News: July 4, 2012
Posted by Eddy Elfenbein on July 4th, 2012 at 8:02 amFormer UK Minister Denies Talks With BOE Over Libor Adjustments
IMF Urges U.S. Lawmakers to Remove ‘Fiscal Cliff’
Draghi’s Giant Leap on Rates May Be Small Step for Euro
Mexico’s Slim Not Eyeing More Europe Buys For Now
Manchester United Shoots for $100 Million IPO
Big Banks’ ‘Living Wills’ Aiming for Bankruptcy Not Bailouts
Finding Success on the Oil Frontier
Orders to U.S. Factories Rise for First Time in Three Months
Auto Sales in June Provided Bright Spot for U.S. Economy
Mercedes Extends Luxury Lead as U.S. June Sales Rise 7.6%
JPMorgan Probed Over Potential Power-Market Manipulation
Twitter Adds to Pressure on Facebook in Mobile Ads
A More Perfect Union, Built on Shared Debt
Epicurean Dealmaker: Ready, Fire, Aim
Be sure to follow me on Twitter.
-
Morning News: July 3, 2012
Posted by Eddy Elfenbein on July 3rd, 2012 at 7:23 amGreece Must Pay Suppliers’ Arrears: EU Taskforce Head
BRICs Priced for Economic Meltdown
Europe’s Banking Chief Wields New Power in Crisis
Malaysia’s IHH Healthcare Said to Seek $2 Billion in IPO
Australia Holds Key Rate at 3.5% as Hiring, Currency Strengthen
Sour Global Economy Drains Confidence From Deal Makers
U.S. Manufacturing Shrinks, 1st Time in Nearly 3 Years
California Lawmakers Pass Historic Foreclosure Protections
Diamond Quits as Pressure Mounts on Barclays Over Libor
Former Brokers Say JPMorgan Favored Selling Bank’s Own Funds Over Others
Let’s Put A Smile On Your Facebook
Samsung Loses Bid To Lift Ban On U.S. Tablet Sales
Microsoft Takes $6.2 Billion Charge, Slows Internet Hopes
Cullen Roche: Wall Street’s Analysts Are Excessively Bearish
Joshua Brown: This Is…How You Say? Ah Yes, Bad.
Be sure to follow me on Twitter.
-
Dividends Up 15%
Posted by Eddy Elfenbein on July 2nd, 2012 at 8:18 amDividends continue to be popular. During the second quarter, the S&P 500 paid out $7.49 (adjusted to the index) in dividends. That’s a 14.9% increase over last year. That’s a payout ratio of less than 30% so it’s hardly stretching companies at all.
Here’s a look at the S&P 500 (in blue, left scale) while its trailing dividends (in black, right scale). The two lines are scaled at a ratio of 50-to-1 so anytime the lines cross, the dividend yield is exactly 2%.
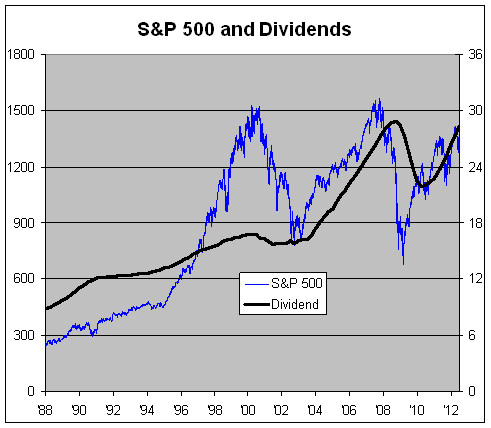
I think it’s fascinating how closely the S&P 500 has tracked 50 times its dividend over the last 10 years (except during the financial crises).
-
Morning News: July 2, 2012
Posted by Eddy Elfenbein on July 2nd, 2012 at 7:04 amEuro Leaders Turn to Central Bank for Help to Tackle Crisis
Agius Steps Down As British Bankers’ Association Chairman Amid Interest-Rate Probe
Greece Accused of Wasting Time on Bailout Negotiations
Top Auditor Says France Needs EUR43B to Respect 2012, 2013 Deficit Targets
Japan Tankan Confidence Improves Even as Yen Limits Exports
Iran Won’t Endure West’s Sanctions
In Caymans, It’s Simple to Fill a Hedge Fund Board
Bond Market Backs Obama With Record Demand for New Debt
Euro Zone Factories Hit Hard In June, Job Cuts Rise
Apple Pays $60 Million to End China IPad Fight With Proview
Why Bristol And Astra Teamed Up To Buy Amylin In Unique $7 Billion Deal
Linde to Fund Lincare Deal With $4.5 Billion Acquisition Loan
Ingram Micro to Buy BrightPoint for $650 Million
Pragmatic Capitalism: How the U.S. Economy will Impact the Presidential Election
Roger Nusbaum: The Big Picture for the Week of July 1, 2012
Be sure to follow me on Twitter.
-
Vacation Time
Posted by Eddy Elfenbein on July 1st, 2012 at 8:58 pm
I’m off to Newport this week for some sailing and to celebrate July 4th so posting will be light. There also won’t be a CWS Market Review this week. The stock market will close at 1 pm on Tuesday and will be closed all day on Wednesday. I expect trading volume to be light this week.
The big news story will be Friday’s jobs report. The last report was a dud. Wall Street currently expects 100,000 nonfarm payrolls, and the unemployment rate to stay at 8.2%. They’ll also revise previous months’ numbers.
A few weeks ago, Bernanke testified before the Joint Economic Committee and addressed employment:
This apparent slowing in the labor market may have been exaggerated by issues related to seasonal adjustment and the unusually warm weather this past winter. But it may also be the case that the larger gains seen late last year and early this year were associated with some catch-up in hiring on the part of employers who had pared their workforces aggressively during and just after the recession. If so, the deceleration in employment in recent months may indicate that this catch-up has largely been completed, and, consequently, that more-rapid gains in economic activity will be required to achieve significant further improvement in labor market conditions.
We’ll see if the sluggish trend continues. I’ll also be curious to see what Monday’s ISM report has in store. Anything above 52ish is fine. A number below that is a concern.
-
The Buy List So Far
Posted by Eddy Elfenbein on July 1st, 2012 at 9:32 amThe first half of the year is over and thanks to a nice rally on Friday, our Buy List is up 7.61% for the year. That trails the S&P 500 just slightly — the index was up 8.31% for the first six months of 2012. Including dividends, our Buy List was up 8.71% while the S&P 500 was up 9.49%.
We’ve beaten the S&P 500 for the last five years in a row. I’m not at all worried about us making it six straight. For the complete six-and-a-half year record of the Buy List, we’ve nearly doubled the return of the S&P 500, 49.72% to 25.19%.
-
RIP: Count Robert de La Rochefoucauld
Posted by Eddy Elfenbein on June 30th, 2012 at 11:58 pmThis is one amazing life:
Count Robert de La Rochefoucauld, who has died aged 88, escaped from Occupied France to join the Special Operations Executive (SOE); parachuted back on sabotage missions, he twice faced execution, only to escape on both occasions, once dressed as a Nazi guard.
Other disguises also came in useful. On the run in occupied Bordeaux he dressed as a nun. In later life he helped Maurice Papon to flee to Switzerland.
Robert Jean-Marie de La Rochefoucauld was born in Paris on September 16 1923, one of 10 children of an aristocratic family which lived in old-fashioned splendour on Avenue de la Bourdonnais, in the shadow of the Eiffel Tower. An ancestor was François de La Rochefoucauld, famous for his maxims. Robert’s mother (née Wendel) was daughter of the Duke of Maillé. His father’s family retained a private carriage which was hitched on to trains during rail journeys.
Read the whole thing.
-
Archives
- October 2026
- September 2026
- August 2026
- July 2026
- June 2026
- May 2026
- April 2026
- March 2026
- February 2026
- January 2026
- December 2025
- November 2025
- October 2025
- September 2025
- August 2025
- July 2025
- June 2025
- May 2025
- April 2025
- March 2025
- February 2025
- January 2025
- December 2024
- November 2024
- October 2024
- September 2024
- August 2024
- July 2024
- June 2024
- May 2024
- April 2024
- March 2024
- February 2024
- January 2024
- December 2023
- November 2023
- October 2023
- September 2023
- August 2023
- July 2023
- June 2023
- May 2023
- April 2023
- March 2023
- February 2023
- January 2023
- December 2022
- November 2022
- October 2022
- September 2022
- August 2022
- July 2022
- June 2022
- May 2022
- April 2022
- March 2022
- February 2022
- January 2022
- December 2021
- November 2021
- October 2021
- September 2021
- August 2021
- July 2021
- June 2021
- May 2021
- April 2021
- March 2021
- February 2021
- January 2021
- December 2020
- November 2020
- October 2020
- September 2020
- August 2020
- July 2020
- June 2020
- May 2020
- April 2020
- March 2020
- February 2020
- January 2020
- December 2019
- November 2019
- October 2019
- September 2019
- August 2019
- July 2019
- June 2019
- May 2019
- April 2019
- March 2019
- February 2019
- January 2019
- December 2018
- November 2018
- October 2018
- September 2018
- August 2018
- July 2018
- June 2018
- May 2018
- April 2018
- March 2018
- February 2018
- January 2018
- December 2017
- November 2017
- October 2017
- September 2017
- August 2017
- July 2017
- June 2017
- May 2017
- April 2017
- March 2017
- February 2017
- January 2017
- December 2016
- November 2016
- October 2016
- September 2016
- August 2016
- July 2016
- June 2016
- May 2016
- April 2016
- March 2016
- February 2016
- January 2016
- December 2015
- November 2015
- October 2015
- September 2015
- August 2015
- July 2015
- June 2015
- May 2015
- April 2015
- March 2015
- February 2015
- January 2015
- December 2014
- November 2014
- October 2014
- September 2014
- August 2014
- July 2014
- June 2014
- May 2014
- April 2014
- March 2014
- February 2014
- January 2014
- December 2013
- November 2013
- October 2013
- September 2013
- August 2013
- July 2013
- June 2013
- May 2013
- April 2013
- March 2013
- February 2013
- January 2013
- December 2012
- November 2012
- October 2012
- September 2012
- August 2012
- July 2012
- June 2012
- May 2012
- April 2012
- March 2012
- February 2012
- January 2012
- December 2011
- November 2011
- October 2011
- September 2011
- August 2011
- July 2011
- June 2011
- May 2011
- April 2011
- March 2011
- February 2011
- January 2011
- December 2010
- November 2010
- October 2010
- September 2010
- August 2010
- July 2010
- June 2010
- May 2010
- April 2010
- March 2010
- February 2010
- January 2010
- December 2009
- November 2009
- October 2009
- September 2009
- August 2009
- July 2009
- June 2009
- May 2009
- April 2009
- March 2009
- February 2009
- January 2009
- December 2008
- November 2008
- October 2008
- September 2008
- August 2008
- July 2008
- June 2008
- May 2008
- April 2008
- March 2008
- February 2008
- January 2008
- December 2007
- November 2007
- October 2007
- September 2007
- August 2007
- July 2007
- June 2007
- May 2007
- April 2007
- March 2007
- February 2007
- January 2007
- December 2006
- November 2006
- October 2006
- September 2006
- August 2006
- July 2006
- June 2006
- May 2006
- April 2006
- March 2006
- February 2006
- January 2006
- December 2005
- November 2005
- October 2005
- September 2005
- August 2005
- July 2005
 Eddy Elfenbein is a Washington, DC-based speaker, portfolio manager and editor of the blog Crossing Wall Street. His